FIN310 Class Web Page, Fall ' 22
Instructor: Maggie Foley
Jacksonville University
Term project Option 1 (due with
final)
– Please refer
to the following for the weblinks of the databases needed for the term project
·
https://www-mergentonline-com.ju.idm.oclc.org/basicsearch.php -- mergent
·
https://research-valueline-com.ju.idm.oclc.org/Secure/Research/Home#sec=library - value line
Term project Explanation
video on Youtube (FYI)
Term project Option 2 (due with final)
Soccer PPT
(Francisco and Trey) Stock Valuation Chevron (Chris) Inflation
(Yihang)
Stock Valuation AMD
(Spencer) Sorority
(Samantha, Sara, Victoria)
Weekly SCHEDULE, LINKS, FILES and Questions
|
Chapter |
Coverage,
HW, Supplements -
Required |
References
|
||||||||||||||||||||||||||||||||||||||||||||||||||||||||||||||||||||||||||||||||||||||||||||||||||||||||||||||||||||||||||||||||||||||||||||||||||||||||||||||||||||||||||||||||||||||||||||||||||||||||||||||||||||||||||||||||||||||||||||||||||||||||||||||||||||||||||||||||||||||||||||||||||||||||||||||||||||||||||||||||||||||||||||||
|
Chapter 1-1 |
Discussion: How to pick stocks (finviz.com) How To Win The MarketWatch Stock Market Game
Daily earning announcement: http://www.zacks.com/earnings/earnings-calendar IPO schedule: http://www.marketwatch.com/tools/ipo-calendar Part I – Review of the Financial
Market Chapter
1 Introduction |
Part IV – Stagflation Stagflation Explained in One Minute
Stagflation in 2022 | Ray Dalio
80% of economists see ‘stagflation’ as a
long-term risk. What it is and how to prepare for it JUN 21
2022, Lorie Konish https://www.cnbc.com/2022/06/21/what-stagflation-is-and-how-to-prepare-for-it.html KEY
POINTS ·
Stagflation
is a term coined in the 1970s to refer to a combination of high inflation and
high unemployment. ·
Recent surveys show economists and fund managers
see increased risks of stagflation on the horizon. ·
There are steps you can take now to get in
a better financial position in case stagflation or a recession does happen. Runaway
inflation has raised fears that the economy is headed towards a return of
stagflation but a host of Wall Street banks such as Goldman Sachs and HSBC
believe there remains opportunities for investors to safely navigate this
tricky backdrop. Runaway
inflation has raised fears that the economy is headed towards a return of stagflation
but a host of Wall Street banks such as Goldman Sachs and HSBC believe there
remains opportunities for investors to safely navigate this tricky backdrop. UCG |
Getty Images The
next big risk to the U.S. economy may be summed up in one word. And no,
it’s not necessarily recession, though economists are evenly split on the
risks one is coming. Instead,
80% of economists in the same survey
named stagflation as the greater long-term risk to the economy, according
to the Securities Industry and Financial Markets Association. The next biggest risk they identified was
deflation, with 13% of respondents ( 'Japanification’: As U.S.
Inflation Surges, Here’s Why Japan’s Prices Have Held Steady | WSJ (video)) Moreover,
a recent Bank of America global fund manager survey found fears of
stagflation are the highest they have been since June 2008. Stagflation is
“by far and away the most popular description of what the economic backdrop
will be in the next 12 months,” according to the report. What is stagflation? Stagflation is a term coined in the 1970s
when there was simultaneous high
inflation and economic stagnation or high unemployment, according to Jonathan Wright, professor
of economics at Johns Hopkins University. While
there were some nasty recessions back then, many economists aren’t expecting
a return to anything like that now, he said. “The
sense in which you had stagflation in the 1970s is not one that I think is at
all in the cards,” Wright said. However, high inflation is prompting the
Federal Reserve to raise interest rates — known as tightening monetary
policy. With that, it is “quite likely” the unemployment rate will rise “a fair bit” from the 3.6% it is at now,
Wright said. Here’s
how the Fed hopes to rein in inflation without harming the labor market The
result may at least be a mild recession, he said. Stagflation may happen if a recession sets
in before inflation has gone down to where the Fed wants it to be, Wright said. For example, if unemployment were to go up to about 5%
and consumer price index inflation were also at above 5% in 2023, that would
be a kind of stagflation, though not to the degree we experienced in the
1970s, he said. “It
certainly would mean that the job market would be a lot less hot than it’s
been,” Wright said. In the
near term, the labor market may cool simply by having fewer vacancies, he
said. How
likely is stagflation? Despite
surveys sounding the alarm on stagflation, not everyone agrees it’s
inevitable. “It
doesn’t seem like a high probability,” said Josh Bivens, director of research
at the Economic Policy Institute. To have stagflation, you need both high
unemployment and high inflation at the same time, which Bivens does not see as likely. I think
it’s inevitable that we’re going to hit a recession. Whether this is a mild
recession or we go into stagflation will be the big question. Ted
Jenkin CEO OF
OXYGEN FINANCIAL “If we
had a situation where unemployment rose pretty sharply, I actually think that
would likely cause inflation to start coming down pretty sharply,” Bivens
said. A more likely scenario is that if we end
the year with a series of interest rate hikes by the Federal Reserve, we
could be in a recession by 2023,
he said. “If that
happens, I just expect inflation to relent pretty quickly,” Bivens said. How can
you prepare for a recession or stagflation? A
combination of inflation and shrinkflation, where product companies reduce the
contents of everything that we buy, is making it so people’s money just
doesn’t go as far now, said Ted Jenkin, a certified financial planner and CEO
of Oxygen Financial in Atlanta. Now,
stagflation is also a possibility that clients are asking about, Jenkin said. “I
think it’s inevitable that we’re going to hit a recession,” he said. “Whether
this is a mild recession or we go into stagflation will be the big question.” Consequently,
now is a great time to revisit your personal financial plan. “This
is the absolute time for people to batten down the hatches and beef up the
foundation of their financial house,” Jenkin said. Try to aim for at least six months’ worth
of emergency expenses in case a downturn does happen, he said. Also make sure
you have prepared a recent budget to see if there are places where you can
cut back. Additionally, take a look at any
adjustable-rate debt you may have — credit cards, mortgages, student loans —
and see if you can pare those balances down or refinance them. Now that
interest rates are poised to go up, those balances will become more
expensive. Moreover, it’s a great time to invest in
yourself to be more marketable professionally if layoffs become the norm. “Make
sure you’ve really brushed up on your skills and competencies or education so
that if the job market gets tighter, you’re marketable,” Jenkin said. Part V – Why is inflation so high? Benjamin
Curry, Aug 10, 2022, 9:31am https://www.forbes.com/advisor/investing/why-is-inflation-rising-right-now/ Inflation Explained | What is causing inflation? | Why
is inflation so high? | How to fix inflation?
The era
of ever-rising prices may be over. Hopes
that inflation has begun to moderate gained steam after the Labor Department
reported that the consumer price index (CPI) was relatively unchanged in July
compared to June. “This
is a good number,” said Rusty Vanneman, chief investment strategist at Orion
Advisor Solutions. “If this is truly the peak in inflation, this could
officially signal an economic tide shift that both consumers and investors
can appreciate.” Still,
the positive report doesn’t mean everything has suddenly become cheap. The
CPI rose 8.5% in July compared to the prior year. While that’s an improvement
from last month, it’s still very high. The main reason for prices leveling off:
energy. The gas price index fell by 7.7% in the month, which helped to
overcome increases in the costs of food and housing. In a
twist, the news was worse for so-called core CPI, which strips out volatile
food and energy prices, where prices gained by 0.3% in the month, and are
5.9% higher than last year. The
inflation report comes after the Federal Reserve raised interest rates to a
range of 2.25%–2.5%, a dramatic increase in a short period. While this report
won’t stop the Fed from increasing rates further, it may give the nation’s
central bank hope that they’re making progress. “The
deceleration in the consumer price index for July is likely a big relief for
the Federal Reserve, especially since the Fed insisted that inflation was
transitory, which was incorrect,” said Nancy Davis, founder of Quadratic
Capital Management. CPI
Inflation Finally Moderates The
headline July CPI data follows a shocking June report that shows
year-over-year CPI growth surged to 9.1% after an 8.6% gain in May. Drivers
were perhaps the main group of Americans who could have presaged such a
decline was nigh. The gasoline index’s massive decline came after an 11.2%
year-over-year increase in June. Overall, energy prices dropped 4.6% over the
same period. Car
owners, though, shouldn’t get too comfortable. Gas prices dropped 6.1% in April
this year from the month before jumping in the subsequent month, and gas
prices are still 45% higher than last year. Meanwhile,
the news was less sanguine when it comes to another staple of life: food. The
price of buying groceries and dining out surged in July, now 13.1% and 7.6%
higher than a year ago, respectively. The overall food index gained 10.9%,
the biggest 12–month jump since May 1979. But
there’s a reason why Fed officials and economists generally look at core
inflation seriously: food and energy prices tend to jump around, even if they
are vital to household budgets. The
core CPI data, though, shows just how much work the Fed has to do. According
to this metric, prices gained 0.3% in the month, and are 5.9% higher than
last year. That’s well above the Fed’s 2% target. Shelter
was a major driver here. Housing prices grew 0.5% in July and are up by 5.7%
compared to a year prior. The
latest CPI numbers come after some confusing data. Employers added 528,000
jobs in July, exceeding economist, while wages were up 5.2% over the past
year. Still, inflation-adjusted earnings were down 3% over the same period,
and the nation’s gross domestic product dropped for another successive
quarter, which is a common, but not definitive, definition of recession. The
Commerce Department reported that the core personal consumption expenditures
(PCE) price index, the Federal Reserve’s favorite inflation metric, was up
4.8% in June, slightly higher than its 4.7% year-over-year gain in April.
Still, that’s below the February reading of 5.3%. Inflation
Remains Enemy #1 for the Fed Inflation has been the Federal Reserve‘s
enemy number one in 2022. The Federal Open Market Committee (FOMC) has made
aggressive changes to U.S. monetary policy to bring inflation down to its
long-term target of around 2%. In
July, the FOMC raised its target range for the federal funds rate by 75 basis
points (bps) for a consecutive month. It
looks like the Fed won’t raise rates so high when it reconvenes on Sept
20-21. Market observers are expecting the Fed hikes rates by 50 bps,
according to the CME Group’s FedWatch tool. Markets
are currently pricing in a 62% chance of such a hike bps rate hike, which
would bring the fed funds rate to between 2.75% and 3%. The market is only
pricing in a 39% chance for a 75 bps rate increase. “The
Fed will have another inflation report before September’s FOMC meeting and if
August’s inflation report is as good as this one, we could expect a 50 basis
point hike instead of a more aggressive increase in rates,” said Jeffrey
Roach, chief economist for LPL Financial. Could Inflation Help Spark a Recession? The Fed is facing a difficult balancing
act, needing to raise interest rates aggressively to bring down inflation
without triggering a U.S. recession. Rising interest rates increase borrowing
costs for companies and consumers, weighing on economic activity. Up to this point, the U.S. labor market
has been solid, but the S&P 500’s 13.5% year-to-date decline reflects
concerns on Wall Street that the economy may not take spiking interest rates
in stride. Growth stocks are particularly sensitive
to rising interest rates because fund managers typically use discounted cash
flow models to determine their price targets for growth stocks. Future cash
flows are considered less valuable when the discounted rate is higher. So far
in 2022, the Russell 1000 Growth Index is down 19.2%, while the Russell 1000
Value Index is down 7.3%. Inflation isn’t necessarily bad news for
every stock market sector, however. Soaring oil, natural gas and other
commodity prices have helped energy sector stocks generate record profits in
2022. The Energy Select Sector SPDR Fund (XLE) is up 37.8% so far this year
amid broad-based market weakness. Today’s
report may buoy traders’ animal spirits. “Stock
markets will be cheered by news that the world’s largest economy’s headline
inflation rate seems to have peaked,” said Nigel Green of deVere Group. “It
means the Federal Reserve has more scope not to hike interest rates so
aggressively to fight rising prices.” What’s
Next? Investors will be monitoring the Fed’s
commentary on the economy at its upcoming meeting. The U.S. Bureau of
Economic Analysis (BEA) will release the July PCE reading on Aug. 26. CPI and
PCE measure inflation based on pricing a basket of goods. The two
baskets are different, and the formulas used to calculate each measure are
not the same. The CPI calculation is
based on a survey of goods consumers buy, whereas the PCE is based on a
survey of goods businesses sell. It’s
important to remember today’s release is but one data point, and the Fed will
digest more information before its next confab. The Fed is trying to lower inflation
without harming employment too dramatically. While it has many more miles to go, this
report offers hope. Part VI – What is QE? What is Quantitative Easing? (video)
What
Is Quantitative Easing (QE)? By
THE INVESTOPEDIA TEAM, Updated August 03,
2022, Reviewed by ERIKA RASURE, Fact checked by KATRINA MUNICHIELLO https://www.investopedia.com/terms/q/quantitative-easing.asp Quantitative easing (QE) is
a form of monetary policy in which a central bank, like the U.S. Federal
Reserve, purchases securities from the open market to reduce interest rates
and increase the money supply. Quantitative easing creates
new bank reserves, providing banks with more liquidity and encouraging
lending and investment. In the United States, the Federal Reserve implements
QE policies. Understanding
Quantitative Easing (QE) Quantitive easing is often implemented
when interest rates hover near zero and economic growth is stalled. Central
banks have limited tools, like interest rate reduction, to influence economic
growth. Without the ability to lower rates further, central banks must
strategically increase the supply of money. To
execute quantitative easing, central
banks buy government bonds and other securities, injecting bank reserves into
the economy. Increasing the supply of money lowers interest rates further and
provides liquidity to the banking system, allowing banks to lend with easier
terms. During
the COVID-19 pandemic, quantitative easing was used and the Federal Reserve
increased its holdings, accounting for 56 percent of the Treasury issuance of
securities through the first quarter of 2021. A
government's fiscal policy may be implemented concurrently to expand the
money supply. While the Federal Reserve can influence the supply of money in
the economy, The U.S. Treasury
Department can create new money and implement new tax policies with fiscal
policy, sending money, directly or indirectly, into the economy. Quantitative
easing can be a combination of both monetary and fiscal policy. Does
Quantitative Easing (QE) Work? Most
economists believe that the Federal Reserve's quantitative easing program
helped to rescue the U.S. and global economy following the 2007-2008 financial
crisis, however, the results of QE are difficult to quantify. Globally, central banks have attempted to
deploy quantitative easing as a means of preventing recession and deflation
in their countries with similarly inconclusive results. While QE policy is effective at lowering
interest rates and boosting the stock market, its broader impact on the
economy isn’t apparent. Commonly,
the effects of quantitative easing benefit borrowers over savers and
investors over non-investors, and there are pros and cons to QE, according to
Stephen Williamson, a former economist with the Federal Reserve Bank of St.
Louis. Risks of Quantitative Easing (QE) Inflation As
money is increased in an economy, the risk of inflation looms. As the liquidity works through the
system, central banks remain vigilant, as the time lag between the increase
in the money supply and the inflation rate is generally 12 to 18 months. A quantitative easing strategy that does
not spur intended economic growth but causes inflation can also create
stagflation, a scenario where both the inflation rate and the unemployment
rate are high. Limited Lending As
liquidity increases for banks, a central bank like the Fed cannot force banks
to increase lending activities nor can they force individuals and businesses
to borrow and invest. This creates a “credit crunch,” where cash is held at banks or corporations hoard cash
due to an uncertain business climate. Devalued Currency Quantitative easing may devalue the domestic currency as the money supply increases. While a devalued currency can help domestic manufacturers with exported goods cheaper in the global market, a falling currency value makes imports more expensive, increasing the cost of production and consumer price levels. |
||||||||||||||||||||||||||||||||||||||||||||||||||||||||||||||||||||||||||||||||||||||||||||||||||||||||||||||||||||||||||||||||||||||||||||||||||||||||||||||||||||||||||||||||||||||||||||||||||||||||||||||||||||||||||||||||||||||||||||||||||||||||||||||||||||||||||||||||||||||||||||||||||||||||||||||||||||||||||||||||||||||||||||||
|
Chapter 1-II |
Chapter 1 -II
ppt
1.
What are
the six parts of the financial markets
Money: · To
pay for purchases and store wealth (fiat money, fiat currency) What is Bitcoin for
BEGINNERS in 7-Min. & Bitcoin Explained | What is Cryptocurrency
Explained 2019
Financial Instruments: · To
transfer resources from savers to investors and to transfer risk to those
best equipped to bear it. Where do student loans
go? (video)
An Introduction to
Securitized Products: Asset-Backed Securities (ABS) (video)
Financial Markets: · Buy and
sell financial instruments · Channel
funds from savers to investors, thereby promoting economic efficiency · Affect
personal wealth and behavior of business firms. Example? Financial Institutions. · Provide
access to financial markets, collect information & provide services · Financial
Intermediary: Helps get funds from savers to investors Central Banks · Monitor
financial Institutions and stabilize the economy Regulatory Agencies · To
provide oversight for financial system. The role of financial
regulation (Video)
|
Citi’s Painful Flash Crash Highlights
Risks From Algo Trades · Monday’s shock spread quickly from one
erroneous trade · Selloff briefly erased $315 billion from
European equities ByKsenia Galouchko, Albertina Torsoli, and Jonas
Ekblom May 3, 2022 at 8:44 AM EDTUpdated onMay 3, 2022 at
12:09 PM EDT A rare
flash crash in European stocks caused by a Citigroup Inc. trader highlights
the risks from computer-initiated sell orders exacerbating a single human
error. The OMX
Stockholm 30 Index slumped as much as 8% in just five minutes before 10 a.m.
CET on Monday, but quickly recovered most of the losses. A trader at Citi’s
London desk made an error inputting a transaction, sparking an abrupt selloff
across European equities that briefly wiped out 300 billion euros ($315
billion). “The problem is not the mistake per se, but all
the algorithms and stops that were triggered,” said John Plassard, a director
at Mirabaud & Cie. “It shows the market is always vulnerable to human
error and that algorithms and various CTAs are far too present in markets,”
he added, referring to the commodity trading advisors that often use rapid
systematic orders to pursue market trends.
On Monday, there was added pressure: a public
holiday in the U.K. left European stock markets with about a quarter less
liquidity than normal, giving the remaining trades an outsized chance of
moving prices. It was “the worst day possible for this to
happen,” Guillermo Hernandez Sampere, head of trading at asset manager
Manfred Piontke Vermoegensverwalt EK in Germany, said by phone. While the
circumstances were unusual, he said the flash crash demonstrated a broader
need to take action and prevent such moves in the future. “We shouldn’t
wait for the regulator to do something, that’ll take too long -- instead,
brokers, banks and stock exchanges need to implement changes now, such as
introducing circuit breakers,” he said. Black Monday Previous sudden crashes include the slide in the
pound in 2016, as well as Wall Street’s Black Monday in October 1987 and the
flash crash in May 2010. In the U.S., regulators have tried to stave off further
shocks to share prices with new rules including greater disclosure for big
traders, as well as circuit breakers to cool off overheated price moves and
curbs on algos to prevent shares moving too quickly. Europe, though, governs its markets mostly on a
country-by-country basis. Nasdaq
Stockholm, where Monday’s crash originated, has volatility guards for
individual stocks, according to spokesperson David Augustsson. These guards
halt trading if a share price moves a certain amount from its last price or
that day’s opening price. Each stock has its own thresholds, he
added. About two-thirds of all trading is based on algorithmic dealing
now, compared with about 30% a decade ago, he said. Between 9:57 a.m. and 10:05 a.m. CET on Monday,
the Nasdaq Nordic’s total turnover was 378 million euros, about five times
the average volume, according to Augustsson. The exchange is in touch with
Citi and doesn’t see a reason to cancel any trades, he said. Sweden’s financial regulator is in ongoing contact
with Nasdaq, said Susan Vo Bergqvist, a spokesperson for the Financial
Supervisory Authority. It is too early to say whether any action will be
taken, she added. “It’s hard to know the outcome, but this could
perhaps be a trigger to look at European system for managing trading halts
and circuit breakers,” said Anish Puaar, European market structure analyst at
Rosenblatt Securities. — With assistance by Jonas Ekblom, Thyagaraju
Adinarayan, Jan-Patrick Barnert, and Anton Wilen U.S. exchanges defeat high-frequency
trading lawsuit By Jonathan Stempel March 28, 2022 NEW YORK, March 28 (Reuters) - A federal judge on Monday dismissed long-running litigation accusing
seven U.S. stock exchanges of defrauding ordinary investors by quietly
allowing high-frequency traders to trade faster and at better prices. Exchanges including the New
York Stock Exchange, Nasdaq (NDAQ.O) and BATS Global Markets were accused of providing
high-frequency trading firms with enhanced data feeds and faster order
processing, and letting them locate their servers near the exchanges' own so
trading signals would be sent faster. But in a 46-page decision, U.S. District Judge Jesse Furman in Manhattan said investors in the
proposed class action could not prove they suffered harm because of the
exchanges' actions, which they said violated federal securities law. The judge said reports from
the plaintiffs' expert witness, a former high-frequency trader who now
consults on market structure, were "not based on reliable
methodology," and did not track the trading firms' use of the
specialized services. Because those reports were
inadmissible, "it follows that plaintiffs have adduced no admissible
evidence that their own trades were harmed by the exchanges' challenged
conduct," depriving them of legal standing to sue, Furman wrote. The investors were led by the city of Providence, Rhode Island
and several pension plans, including for the city of Boston. Their lawyers
did not respond to requests for comment. High-frequency traders use
computer algorithms to gain split-second trading advantages. They were the subject of
Michael Lewis' best-seller "Flash Boys," published in March 2014. The
lawsuit began the next month. The NYSE and its parent Intercontinental Exchange Inc (ICE.N)
said they were pleased with the decision. Neither the other defendants nor
their lawyers provided comments. BATS is now part of CBOE Global Markets Inc
. Furman had also dismissed the investors' claims in 2015,
finding the exchanges absolutely immune from liability under federal law, but
an appeals court overturned that finding two years later. The case is City of Providence, Rhode Island et al v BATS
Global Markets Inc et al, U.S. District Court, Southern District of New York,
No. 14-02811. |
||||||||||||||||||||||||||||||||||||||||||||||||||||||||||||||||||||||||||||||||||||||||||||||||||||||||||||||||||||||||||||||||||||||||||||||||||||||||||||||||||||||||||||||||||||||||||||||||||||||||||||||||||||||||||||||||||||||||||||||||||||||||||||||||||||||||||||||||||||||||||||||||||||||||||||||||||||||||||||||||||||||||||||||
|
Special
topic: Blockchain, NFT, Metaverse, Crypto Currency and Inflation, and CBDC Part 1
- Blockchain and Bitcoin Blockchain Technology Explained (2 Hour Course)
(optional)
By ADAM HAYES Updated June 24, 2022,
Reviewed by JEFREDA R. BROWN, Fact checked by SUZANNE KVILHAUG https://www.investopedia.com/terms/b/blockchain.asp What Is a Blockchain? A blockchain is a distributed database or
ledger that is shared among the nodes of a computer network. As a database, a
blockchain stores information electronically in digital format. Blockchains
are best known for their crucial role in cryptocurrency systems, such as
Bitcoin, for maintaining a secure and decentralized record of transactions. The innovation with a blockchain is that
it guarantees the fidelity and security of a record of data and generates
trust without the need for a trusted third party. One key
difference between a typical database and a blockchain is how the data is
structured. A blockchain collects
information together in groups, known as blocks, that hold sets of
information. Blocks have certain storage capacities and, when filled, are
closed and linked to the previously filled block, forming a chain of data
known as the blockchain. All new information that follows that freshly added
block is compiled into a newly formed block that will then also be added to
the chain once filled. A
database usually structures its data into tables, whereas a blockchain, as its name implies,
structures its data into chunks (blocks) that are strung together. This data structure
inherently makes an irreversible timeline of data when implemented in a
decentralized nature. When a block is filled, it is set in stone and becomes
a part of this timeline. Each block in the chain is given an exact timestamp
when it is added to the chain. KEY TAKEAWAYS ·
Blockchain is a type of shared database
that differs from a typical database in the way that it stores information;
blockchains store data in blocks that are then linked together via
cryptography. ·
As new data comes in, it is entered into a
fresh block. Once the block is filled with data, it is chained onto the
previous block, which makes the data chained together in chronological order. ·
Different types of information can be
stored on a blockchain, but the most common use so far has been as a ledger
for transactions. ·
In Bitcoin’s case,
blockchain is used in a decentralized way so that no single person or group
has control—rather, all users collectively retain
control. ·
Decentralized blockchains are immutable,
which means that the data entered is irreversible. For Bitcoin, this means
that transactions are permanently recorded and viewable to anyone. How
Does a Blockchain Work? The
goal of blockchain is to allow digital information to be recorded and
distributed, but not edited. In this way, a blockchain is the foundation for
immutable ledgers, or records of transactions that cannot be altered,
deleted, or destroyed. This is why blockchains are also known as a
distributed ledger technology (DLT). First proposed as a research project in
1991, the blockchain concept predated its first widespread application in
use: Bitcoin, in 2009. In the years since, the use of blockchains has
exploded via the creation of various cryptocurrencies, decentralized finance
(DeFi) applications, non-fungible tokens (NFTs), and smart contracts. Imagine
that a company owns a server farm with 10,000 computers used to maintain a
database holding all of its client’s account
information. This company owns a warehouse building that contains all of
these computers under one roof and has full control of each of these
computers and all of the information contained within them. This, however,
provides a single point of failure. What happens if the electricity at that
location goes out? What if its Internet connection is severed? What if it
burns to the ground? What if a bad actor erases everything with a single
keystroke? In any case, the data is lost or corrupted. What a blockchain does is to allow the
data held in that database to be spread out among several network nodes at
various locations. This not only creates redundancy but also maintains the
fidelity of the data stored therein—if somebody tries
to alter a record at one instance of the database, the other nodes would not
be altered and thus would prevent a bad actor from doing so. If one user tampers with Bitcoin’s record of transactions, all other nodes would
cross-reference each other and easily pinpoint the node with the incorrect
information. This system helps to establish an exact and transparent order of
events. This way, no single node within the network can alter information
held within it. Because
of this, the information and history (such as of transactions of a
cryptocurrency) are irreversible. Such a record could be a list of
transactions (such as with a cryptocurrency), but it also is possible for a
blockchain to hold a variety of other information like legal contracts, state
identifications, or a company’s product inventory. To
validate new entries or records to a block, a majority of the decentralized
network’s computing power would need to agree to it. To
prevent bad actors from validating bad transactions or double spends,
blockchains are secured by a consensus mechanism such as proof of work (PoW)
or proof of stake (PoS). These mechanisms allow for agreement even when no
single node is in charge. Transparency Because of the decentralized nature of
Bitcoin’s blockchain, all transactions can be transparently viewed by either having
a personal node or using blockchain explorers that allow anyone to see
transactions occurring live. Each node has its own copy of the chain that
gets updated as fresh blocks are confirmed and added. This means that if you wanted to, you
could track Bitcoin wherever it goes. For
example, exchanges have been hacked in the past, where those who kept Bitcoin
on the exchange lost everything. While the hacker may be entirely anonymous,
the Bitcoins that they extracted are easily traceable. If the Bitcoins stolen
in some of these hacks were to be moved or spent somewhere, it would be
known. Of
course, the records stored in the Bitcoin blockchain (as well as most others)
are encrypted. This means that only the owner of a record can decrypt it to
reveal their identity (using a public-private key pair). As a result, users of blockchains can remain anonymous
while preserving transparency. Is Blockchain Secure? Blockchain technology achieves
decentralized security and trust in several ways. To begin with, new blocks
are always stored linearly and chronologically. That is, they are always
added to the “end” of the
blockchain. After a block has been added to the end of the blockchain, it is
extremely difficult to go back and alter the contents of the block unless a
majority of the network has reached a consensus to do so. That’s because each block contains its own hash, along with the
hash of the block before it, as well as the previously mentioned timestamp.
Hash codes are created by a mathematical function that turns digital
information into a string of numbers and letters. If that information is
edited in any way, then the hash code changes as well. Let’s say that a hacker, who also runs a node on a blockchain
network, wants to alter a blockchain and steal cryptocurrency from everyone
else. If they were to alter their own single copy, it would no longer align
with everyone else’s copy. When everyone else cross-references their copies
against each other, they would see this one copy stand out, and that hacker’s version of the chain would be cast away as illegitimate.
Succeeding
with such a hack would require that the hacker simultaneously control and
alter 51% or more of the copies of the blockchain so that their new copy
becomes the majority copy and, thus, the agreed-upon chain. Such an attack
would also require an immense amount of money and resources, as they would
need to redo all of the blocks because they would now have different
timestamps and hash codes. Due to
the size of many cryptocurrency networks and how fast they are growing, the
cost to pull off such a feat probably would be insurmountable. This would be
not only extremely expensive but also likely fruitless. Doing such a thing
would not go unnoticed, as network members would see such drastic alterations
to the blockchain. The network members would then hard fork off to a new
version of the chain that has not been affected. This would cause the
attacked version of the token to plummet in value, making the attack
ultimately pointless, as the bad actor has control of a worthless asset. The
same would occur if the bad actor were to attack the new fork of Bitcoin. It
is built this way so that taking part in the network is far more economically
incentivized than attacking it. Bitcoin vs. Blockchain Blockchain technology was first outlined
in 1991 by Stuart Haber and W. Scott Stornetta, two researchers who wanted to
implement a system where document timestamps could not be tampered with. But
it wasn’t until almost two decades later, with the launch of Bitcoin in
January 2009, that blockchain had its first real-world application. The
Bitcoin protocol is built on a blockchain. In a research paper introducing
the digital currency, Bitcoin’s pseudonymous creator,
Satoshi Nakamoto, referred to it as “a new electronic
cash system that’s fully peer-to-peer, with no
trusted third party.” The key
thing to understand here is that Bitcoin
merely uses blockchain as a means to transparently record a ledger of
payments, but blockchain can, in theory, be used to immutably record any
number of data points. As
discussed above, this could be in the form of transactions, votes in an
election, product inventories, state identifications, deeds to homes, and
much more. Currently, tens of thousands of projects
are looking to implement blockchains in a variety of ways to help society
other than just recording transactions—for example,
as a way to vote securely in democratic elections. The
nature of blockchain’s immutability means that fraudulent voting would become
far more difficult to occur. For
example, a voting system could work such that each citizen of a country would
be issued a single cryptocurrency or token. Each candidate would then be
given a specific wallet address, and the voters would send their token or
crypto to the address of whichever candidate for whom they wish to vote. The
transparent and traceable nature of blockchain would eliminate both the need
for human vote counting and the ability of bad actors to tamper with physical
ballots. Pros
and Cons of Blockchain For all
of its complexity, blockchain’s potential as a decentralized form of
record-keeping is almost without limit. From greater user privacy and
heightened security to lower processing fees and fewer errors, blockchain
technology may very well see applications beyond those outlined above. But
there are also some disadvantages. Pros ·
Improved accuracy by removing human
involvement in verification ·
Cost reductions by eliminating third-party
verification ·
Decentralization makes it harder to tamper
with ·
Transactions are secure, private, and
efficient ·
Transparent technology ·
Provides a banking alternative and a way
to secure personal information for citizens of countries with unstable or
underdeveloped governments Cons ·
Significant technology cost associated
with mining bitcoin ·
Low transactions per second ·
History of use in illicit activities, such
as on the dark web ·
Regulation varies by jurisdiction and
remains uncertain ·
Data storage limitations Part II - Non-Fungible Token (NFT) By
RAKESH SHARMA Updated June 22, 2022, Reviewed by DORETHA CLEMON, Fact checked
by PETE RATHBURN https://www.investopedia.com/non-fungible-tokens-nft-5115211 NFTs and
the Metaverse: The internet enters a new phase (youtube)
What Is a
Non-Fungible Token (NFT)? Non-fungible
tokens (NFTs) are cryptographic assets on a blockchain with unique
identification codes and metadata that distinguish them from each other. Unlike cryptocurrencies,
they cannot be traded or exchanged at equivalency. This differs from fungible
tokens like cryptocurrencies, which are identical to each other and,
therefore, can serve as a medium for commercial transactions. KEY TAKEAWAYS ·
NFTs
(non-fungible tokens) are unique cryptographic tokens that exist on a
blockchain and cannot be replicated. ·
NFTs can
represent real-world items like artwork and real estate. ·
"Tokenizing"
these real-world tangible assets makes buying, selling, and trading them more
efficient while reducing the probability of fraud. ·
NFTs can
also function to represent individuals' identities, property rights, and
more. Understanding
Non-Fungible Tokens (NFTs) NFTs evolved
from the ERC-721 standard. Developed by some of the same people responsible
for the ERC-20 smart contract, ERC-721 defines the minimum interface—ownership details, security, and metadata—required
for the exchange and distribution of gaming tokens. The ERC-1155 standard
takes the concept further by reducing the transaction and storage costs
required for NFTs and batching multiple types of non-fungible tokens into a
single contract. NFTs have the potential for several use
cases. For example, they are an ideal vehicle to digitally represent physical
assets like real estate and artwork. Because they are based on blockchains,
NFTs can also work to remove intermediaries and connect artists with
audiences or for identity management. NFTs can remove intermediaries,
simplify transactions, and create new markets. Much of the current market for NFTs is
centered around collectibles, such as digital artwork, sports cards, and
rarities. Perhaps the most hyped space is NBA Top Shot, a place to collect
non-fungible tokenized NBA moments in digital card form. Some of these cards
have sold for millions of dollars. Recently, Twitter's (TWTR) Jack Dorsey
tweeted a link to a tokenized version of the first tweet ever, in which he
wrote: "just setting up my twttr." The NFT version of the
first-ever tweet sold for more than $2.9 million. NFTs shift the crypto paradigm by making
each token unique and irreplaceable, thereby making it impossible for one
non-fungible token to be equal to another. They are digital representations
of assets and have been likened to digital passports because each token
contains a unique, non-transferable identity to distinguish it from other
tokens. They are also extensible, meaning you can combine one NFT with
another to “breed” a third,
unique NFT. Just
like Bitcoin, NFTs also contain ownership details for easy identification and
transfer between token holders. Owners can also add metadata or attributes
pertaining to the asset in NFTs. For example, tokens representing coffee
beans can be classified as fair trade. Or, artists can sign their digital
artwork with their own signature in the metadata. Examples
of NFTs Perhaps the most famous use case for NFTs
is that of cryptokitties. Launched in November 2017, cryptokitties are
digital representations of cats with unique identifications on Ethereum’s
blockchain. Each kitty is unique and has a price in ether. They reproduce
among themselves and produce new offspring, which have different attributes
and valuations compared to their parents. Within a few short weeks of their launch,
cryptokitties racked up a fan base that spent $20 million worth of ether to
purchase, feed, and nurture them. Some enthusiasts even spent upward of
$100,000 on the effort. More recently, the Bored Ape Yacht Club has
garnered controversial attention for its high prices, celebrity following,
and high-profile thefts of some of its 10,000 NFTs. Though the cryptokitties and Bored Ape
Yacht Club use cases may sound trivial, others have more serious business
implications. For example, NFTs have been used in private equity transactions
as well as real estate deals. One
of the implications of enabling multiple types of tokens in a contract is the
ability to provide escrow for different types of NFTs—from
artwork to real estate—into a single financial
transaction. Why NFTs
Are Important Non-fungible tokens are an evolution of the
relatively simple concept of cryptocurrencies. Modern finance systems consist
of sophisticated trading and loan systems for different asset types, ranging
from real estate to lending contracts to artwork. By enabling digital
representations of physical assets, NFTs are a step forward in the
reinvention of this infrastructure. To be sure, the idea of digital
representations of physical assets is not novel nor is the use of unique
identification. However, when these concepts are combined with the benefits
of a tamper-resistant blockchain of smart contracts, they become a potent
force for change. Perhaps, the most obvious benefit of NFTs
is market efficiency. The conversion of a physical asset into a digital one
streamlines processes and removes intermediaries. NFTs representing digital
or physical artwork on a blockchain remove the need for agents and allow
artists to connect directly with their audiences. They can also improve
business processes. For example, an NFT for a wine bottle will make it easier
for different actors in a supply chain to interact with it and help track its
provenance, production, and sale through the entire process. Consulting firm
Ernst & Young has already developed such a solution for one of its
clients. Non-fungible tokens are also excellent for
identity management. Consider the case of physical passports that need to be produced
at every entry and exit point. By converting individual passports into NFTs,
each with its own unique identifying characteristics, it is possible to
streamline the entry and exit processes for jurisdictions. Expanding this use
case, NFTs can serve an identity management purpose within the digital realm
as well. What Are
Some Examples of Non-Fungible Tokens? Non-fungible tokens can digitally represent
any asset, including online-only assets like digital artwork and real assets
such as real estate. Other examples of the assets that NFTs can represent
include in-game items like avatars, digital and non-digital collectibles,
domain names, and event tickets. How Can I
Buy NFTs? Many NFTs can only be purchased with Ether,
so owning some of this cryptocurrency—and storing it
in a digital wallet—is usually the first step. You
can then purchase NFTs via any of the online NFT marketplaces, including
OpenSea, Rarible, and SuperRare. Are NFTs
Safe? Non-fungible tokens, which use blockchain technology
just like cryptocurrency, are generally secure. The distributed nature of
blockchains makes NFTs difficult (although not impossible) to hack. One
security risk for NFTs is that you could lose access to your non-fungible
token if the platform hosting the NFT goes out of business. Part III
- Metaverse What is the metaverse? (CNBC, youtube)
What's next for tech's big bet on the metaverse?
(CNBC, youtube)
How The Metaverse Will Change The World | Brian Jung |
TEDxRockville (optional)
By JEAN FOLGER Updated August 05, 2022, Reviewed
by JEFREDA R. BROWN, Fact checked by VIKKI VELASQUEZ What Is
the Metaverse? The
metaverse is a digital reality that combines aspects of social media, online gaming,
augmented reality (AR), virtual reality (VR), and cryptocurrencies to allow
users to interact virtually. Augmented reality overlays visual elements,
sound, and other sensory input onto real-world settings to enhance the user
experience. In contrast, virtual reality is entirely virtual and enhances
fictional realities. KEY TAKEAWAYS ·
The
metaverse is a shared virtual environment that people access via the
Internet. ·
Cryptocurrency
is an aspect of the metaverse. ·
Technologies
like virtual reality (VR) and augmented reality (AR) are combined in the
metaverse to create a sense of "virtual presence." ·
Meta
(formerly Facebook) CEO Mark Zuckerberg believes augmented reality glasses
will eventually be as widespread as smartphones. ·
In
October 2021, Meta announced plans to create 10,000 new high-skilled jobs in
the European Union (EU) to help shape the metaverse. How Does
the Metaverse Work? An exact definition of the metaverse may be
hard to explain because of its depths, but most technology experts agree,
that the metaverse is a vast network
where individuals via their avatars can interact socially and professionally,
invest in currency, take classes, work, and travel in 3-D virtual reality. As the
metaverse grows, it may likely create online spaces where user interactions
are more multidimensional than current technology supports. In simple terms,
the metaverse will allow users to go beyond just viewing digital content,
users in the metaverse will be able to immerse themselves in a space where
the digital and physical worlds converge. Meta and
the Metaverse In July 2021, Mark Zuckerberg talked with
journalist Casey Newton about the metaverse and the changes he envisioned for
Facebook. Then rumors began swirling in mid-October 2021 about a Facebook
rebrand—complete with a new name—to embrace the company’s commitment to the
metaverse. Unnamed sources told The Verge that an announcement could come
soon. And it did. Proponents of the metaverse view the
concept as the next stage in developing the Internet. Meta, for example, has
already invested heavily in AR and VR, developing hardware such as its Oculus
VR headsets, while AR glasses and wristband technologies are in the works.
Zuckerberg, who believes AR glasses will one day be as ubiquitous as
smartphones, told The Verge that over the next several years, Facebook
"will effectively transition from people seeing us as primarily being a
social media company to being a metaverse company." How Do I
Invest in the Metaverse? There are
several ways you could invest in the metaverse. You could purchase and invest
in cryptocurrency, you could invest in companies working on areas of the
metaverse, like Meta and Niantic, or invest in an exchange-traded fund (ETF)
that focuses on gaming and technology companies. |
How
OpenSea cornered the $17 billion market for NFTs (cnbc video)
NFTs have been taking over the art world.
And at the center of the NFT craze is
a company called OpenSea. OpenSea is the Amazon of NFTs, or non-fungible
tokens. It’s an online marketplace that allows people to easily create, sell and
buy NFTs. It’s one of the largest NFT trading platforms with more than 1.5
million active users, according to Dune Analytics. This past January was
OpenSea’s busiest month yet. It recorded a monthly trading volume of nearly
$5 billion, surpassing its previous high in August of 2021. FRI, APR 15 202212:00 PM EDT How
99-year-old publisher Time is leading legacy media into the NFT future PUBLISHED SUN, JUL 17 20228:58 AM
EDTUPDATED MON, JUL 18 20229:34 AM EDT, Riley de León KEY POINTS ·
NFTs, or non-fungible tokens, are a
controversial piece of the crypto conversation, evoking both passionate
criticism and praise as Web3 becomes a bigger part of popular culture. ·
Keith Grossman, president of Time, has
spent the past year building the 99-year-old media brand’s NFT business,
TIMEPieces, and the publisher now accepts 33 cryptocurrencies for digital
subscriptions. ·
Since September, the media giant has
created, or “dropped” as it’s
known in the space, more than 20,000 TIMEPieces NFTs, generating a $10 million
profit and $600,000 for charities. NFTs,
or non-fungible tokens, have become, perhaps, the most controversial piece of
the crypto conversation, evoking both passionate criticism and praise as Web3
becomes a bigger part of popular culture. NFTs
are unique digital assets, like artwork and sports trading cards, that are
verified and stored using blockchain technology, but critics see them as
overhyped and potentially harmful to the environment given the
energy-intensive nature of cryptocurrencies. Many NFTs are built on the
network behind ethereum, the second-biggest token. The rise of the internet meant that anyone
could view images, videos and songs online for free. People are buying NFTs out of the belief that they’ll
be able to prove ownership of a virtual item thanks to blockchain technology. “All it is is a token that allows you to
verify ownership on the blockchain. Its secondary value is allowing the owner
to control their personal information,” Grossman told
CNBC in a recent interview. TIMEPieces
token holders can connect their digital wallets to TIME’s website, which
gives them unlimited access to TIME content, as well as exclusive invitations
to both virtual and in-person events. Some of the more popular tokens within
the TIMEPieces collection include photography and other forms of digital art
from 89 emerging Web3 artists, including Farokh Sarmad, Joanne Hollings and
Julie Pacino, daughter of actor Al Pacino, among others. It’s also attracted
many well-known celebrity collectors, from Anthony Hopkins to Eva Longoria
and Miguel. In addition to auctioning off original
renderings of their most famous cover stories, TIME adds its iconic red-frame
to each NFT created by these emerging artists — a
group curated by the media giant’s creative director, D.W. Pine. Grossman
describes it as highlighting the “next generation of
artists,” as the brand prepares to celebrate a
century of publishing the news-related cover art it’s known for today. Since
September, TIME has created, or “dropped” as it’s known in the space, more than 20,000 TIMEPieces
NFTs that are owned by roughly 12,000 digital wallets, approximately half of
which are connected to Time.com,
according to Grossman — that’s translated into $10
million in profit for TIME, as well as $600,000 generated for various
charities. TIME
recently partnered with ethereum-based gaming platform The Sandbox to create
a virtual space in the metaverse dubbed TIME Square, which will serve as a
central location for the brand to host virtual art and commerce events. With
its $1.5 billion market cap, according to CoinGecko, The Sandbox is among the
largest metaverse projects, due in large part to its early adoption of
blockchain technology. In November,
a virtual plot in The Sandbox set the record for the highest-valued digital
land sale when metaverse developer Republic Realm paid $4.3 million to
purchase a digital parcel from Atari. Investors have been quick to assert that
long-term value in digital assets will come from their utility. It’s a
message that’s been difficult for institutional
investors to digest as collectible artwork, such as the prominent Bored Ape
Yacht Club, which took center stage in the early days of NFTs, and
equally-hyped Crypto Punks, recently saw prices fall precipitously. “As this new technology was getting
adapted, one camp emerged around the notion of building a community that had
a set of values and principles,” Grossman said. “And another emerged around what I would call ‘greed-based communities.’” Getting past greed-based communities Vitalik Buterin, who co-created ethereum
in 2013, recently said in an interview with TIME that he is worried about
trends he has observed in the space, telling the publication that “crypto itself has a
lot of dystopian potential if implemented wrong.” “The peril is you have these $3 million
monkeys and it becomes a different kind of gambling,”
Buterin said. Speaking at a recent TechCrunch talk, Bill Gates described the crypto and NFT
phenomenon as something that’s “100% based on greater
fool theory,” referring to the idea that
overvalued assets will go up in price when there are enough investors willing
to pay more for them. The billionaire Microsoft co-founder joked that “expensive digital images of monkeys”
would “improve the world immensely.” The
crypto industry has experienced steep cuts in valuation for currencies and
metaverse projects since reaching all-time highs in November 2021, according to CoinGecko. Cryptocurrencies
have seen $2 trillion in value erased. It estimates the metaverse sector to
currently be worth over $6 billion. Adding to broader crypto concerns,
Celsius, a crypto lending platform that promised high yields to users who
deposited their cryptocurrency, recently filed for Chapter 11 bankruptcy
protection. Meanwhile, OpenSea — the world’s largest NFT marketplace and home for
TIMEPieces token listings — announced on Thursday
that it’s cutting its workforce by 20%. “Forget Bored Apes for a second,”
Grossman told CNBC. “When you move out of the
collectible space and focus on the community [of creators and artists] ...the
tokens not only allow you to verify ownership, but it allows them to affix a
royalty on future sales.” “What you’re seeing right now, as the markets
are sort of unstable and correcting themselves, is that the greed-based
communities without liquidity in the system, are not really performing with
the expectations of the members in those communities,”
Grossman said. Turning online renters into brand owners The past decade of technology saw the
value created in the world of Web2 accrue to tech giants instead of creators,
said Avery Akkineni, president of NFT consulting firm Vayner3. Blockchain
allows there to be a more decentralized method of payments, incentives and
rewards, which she said, “I think we’ll see play into
media.” “For enterprises, there’s never been a
better time to launch a product that’s free, or very low cost, that allows
your community to participate without a very high barrier to entry price
point,” Akkineni said in a May interview from Gary
Vaynerchuk’s VeeCon in Minneapolis. Mathew Sweezey, director of market
strategy at Salesforce — Salesforce co-founder and
co-CEO Marc Benioff owns Time — said in a blog post that
2022 would be the year “pioneering brands will search
for utility via NFTs,” and he referred to Time’s
project as a “great example.” Big
brands from every industry, including Coca-Cola, McDonald’s, Nike, Gucci and
the National Football League, have brought NFTs into their marketing
initiatives. Many
analysts say TIME’s move into the metaverse heralds
good opportunities ahead. “The more mainstream brands
we can get transitioning into Web3, the quicker we can reach mass adoption,” Kieran
Warwick, co-founder of metaverse game Illuvium, told The Defiant. “Partnering with The Sandbox is massive news for anyone in
the space.” “Media
companies, for years, have looked at consumers and said ‘you’re a renter on my platform and I’ll give you access to
portraying your identity on Facebook or Twitter or Instagram or the like, and
in return, I’m going to extract your data,’” Grossman
said. “What an NFT actually does behind the scenes is
it allows consumers to own an asset, so you move from being an online renter
to an online owner ... and not actually say who they are from a personally
identifiable aspect.” It’s not just Time within the legacy media
industry. The Associated Press and the
New York Times have also launched their own NFT collections in the past year.
But Grossman’s strategy is
underpinned by the thesis that online identity is just as important as
physical identity. “In September 2020, I started getting
really fascinated with the crypto space from a personal perspective, because
I kept hearing everyone say there’s going to be no inflation, and yet,
everyone was just pumping money into the system to try and stave off Covid,” Grossman said. “That equation
didn’t make sense to me.” Covid
played a big role in the NFT boom. Last year, the total value of NFT
transactions reached $17.6 billion, according to a study from NonFungible and
BNP Paribas-affiliated research firm L’Atelier, up from $250 million the
previous year and fueled by a boom in many asset markets during the pandemic
as stay-at-home restrictions resulted in people spending a lot more of their
time on the internet and building more cash savings. In February 2021, a crypto art rendition
of the Nyan Cat meme from 2011 sold for about $590,000 in an online auction. Grossman
said it caught the attention of Benioff, who appointed Grossman as the
publication’s first president since acquiring it from
Meredith Corp. for $190 million in 2018. “And that’s when everything clicked,” Grossman said, adding that, for Time, it was a natural
extension of the brand’s red-frame cover stories. “I
said that within 30 days, we would start accepting cryptocurrency for digital
payments. Today we accept 33 cryptocurrencies for digital subscriptions. ...
And then I said within six months, we will figure out how to use a token and
a blockchain to change the relationship of a consumer with our brand,” Grossman added. “To be honest, I
had no clue how we were going to do that. I just knew it was possible.” The demographics of Time platforms are
varied. According to Grossman, the average reader of TIME magazine is a
50-year-old male; the reader of Time.com is a 40-year-old female; 62% of the
engagers on TIME’s social feeds are under the age of 35, and one-third
outside the U.S. In the case of NFTs, “it’s
small; it’s like a psychographic of people who weren’t thinking about Time
before, but all of a sudden like the brand,” Grossman
said. The
average price point for a digital subscription to Time.com is about $24, but
the average TIMEPieces NFT is about $1,000. “At the end of the day, we’re able to have
just as strong a relationship with the consumer, if not stronger, through
community building, than when we sell a $24 subscription,”
he said. “Outside of the [Time] name and outside of a
tiny logo in the corner, the hero is always the creator. They have a huge
following and are uplifted by their community ... TIMEPieces comes in and
says ‘we want you to be a part of this,’ we’re validating the creator and their community ... with
the heft of our nearly 100 years of legacy and trust.” While prominent investors continue to be
believers in the long-term potential of digital assets, there are plenty of
skeptics. “I think there’s a lot of hesitancy in terms
of not understanding why this wave of digital asset ownership matters,” Akkineni said. “It’s incredible
how many [CEOs] are actually taking the time to spend learning, both from a
business building perspective and a community building perspective, as well
as a consumer engagement perspective.” The
surge in NFTs is still fairly new, but massive amounts of money have already
exchanged hands among collectors. Since 2017, for example, NFT collectibles
have generated over $6.2 billion in sales while digital art has generated
over $1.9 billion,
according to NonFungible, which tracks historical sales data of NFTs. Ultimately, moving the technology beyond
the NFT is the goal, according to Grossman, who is most bullish on the
underlying concept. “It wasn’t
until Steve Jobs held up the iPod and said we’d have ‘1,000 songs in our
pocket,’ that people stopped thinking about the technology and started
thinking about what the experience is,” Grossman
said. “In my
opinion, for mass adoption, the technology has to become invisible. In this
early stage [of NFTs], the technology is leading the conversation and the
word NFT should disappear from the lexicon. It should literally go into the
background and all the token should be doing is providing the online
verification behind the experience.” “For that to happen, you need a lot of
friction to come out of the system,” he added. What’s
All the Hype About the Metaverse?
Brian X. Chen, Jan. 18, 2022 https://www.nytimes.com/2022/01/18/technology/personaltech/metaverse-gaming-definition.html The term “metaverse” is everywhere. On Tuesday, Microsoft cited the so-called
metaverse as a reason for acquiring the game developer Activision Blizzard
for $68.7 billion, saying the deal would provide “building
blocks for the metaverse.” Facebook’s founder, Mark
Zuckerberg, has also bet on the metaverse and renamed his social networking
company Meta. Google has worked on metaverse-related technology for years.
And Apple has its own related devices in the works. But what does the metaverse really mean,
and does it even exist? Here’s what you need to know. What is
the metaverse, anyway? The
metaverse is the convergence of two ideas that have been around for many
years: virtual reality and a digital second life. For decades, technologists have dreamed of
an era when our virtual lives play as important a role as our physical
realities. In theory, we would spend lots of time interacting with our friends
and colleagues in virtual space. As a result, we would spend money there,
too, on outfits and objects for our digital avatars. In what
techies like Mr. Zuckerberg call the metaverse, virtual reality serves as a
computing platform for living a second life online. In virtual reality, you wear a headset
that immerses you in a 3-D environment. You carry motion-sensing controllers
to interact with virtual objects and use a microphone to communicate with
others. Matthew Ball, a venture capitalist who has
written extensively about the topic, said the metaverse represented the fourth wave to computers, following
mainframe computing, personal computing and mobile computing. What Is the Metaverse, and Why Does It
Matter? The origins. The word “metaverse” describes a fully realized digital world that exists
beyond the one in which we live. It was coined by Neal Stephenson in his 1992
novel “Snow Crash,” and the
concept was further explored by Ernest Cline in his novel “Ready
Player One.” An expanding universe. The metaverse appears to have gained
momentum during the online-everything shift of the pandemic. The term today
refers to a variety of experiences, environments and assets that exist in the
virtual space. Some examples. Video games in which
players can build their own worlds have metaverse tendencies, as does most
social media. If you own a non-fungible token, virtual-reality headset or
some cryptocurrency, you’re also part of the metaversal experience. How Big Tech is shifting. Facebook staked
its claim to the metaverse last year, after shipping 10 million of its
virtual-reality headsets and announcing it had renamed itself Meta. Google,
Microsoft and Apple have all been working on metaverse-related technology. The future. Many people in tech believe the metaverse will herald an era in which
our virtual lives will play as important a role as our physical realities.
Some experts warn that it could still turn out to be a fad or even dangerous. “It’s moving into what people call ambient
computing,” he said about the metaverse. “It’s about being within the computer rather than accessing
the computer. It’s about being always online rather than always having access
to an online world.” That’s it? It’s you
and your avatar interacting with others in a digital environment? To put it simply, yes. Does the metaverse already exist in
gaming? To some extent, there is already a
metaverse in games. But — and it’s an important but — it’s rudimentary. Some social elements of the metaverse can
already be found in video games. Consider Fortnite, an online shooter game
played on computers, game consoles and mobile devices. The average Fortnite
player spends hundreds of hours in the game with a personal avatar, fighting
with and interacting with the avatars of other players. Players also accrue
virtual currency that unlocks outfits and other goodies to customize their
avatars. A precursor to the metaverse could also be
found in Second Life, an online social platform developed by Linden Lab
nearly two decades ago, where people created digital representations of
themselves to socialize with others. In the virtual space, users could shop
and build property to enrich their virtual lives. Virtual reality is also somewhat advanced
in video games. In 2016, Sony released the $400 PlayStation VR, a virtual
reality headset that plugged into its PlayStation 4 console to play virtual
reality games. This month, Sony said a second-generation headset was coming
for the PlayStation 5, though it did not share a release date. But those were just steppingstones toward
the complete metaverse, which is still taking shape. Technologists say that
thanks to a number of things — fast internet connections,
powerful virtual reality headsets and a large audience of gamers — it is now more possible to live in a richly animated,
lifelike 3-D simulation. “It’s only in the last few years that a
critical mass of working pieces has come together,”
Mr. Ball said. What does Activision Blizzard build for
the metaverse? Truth be told, not too much. Activision Blizzard is well known for
making online games that have a metaverse component, where players spent
hundreds of hours forming communities within the games. In its role-playing
game World of Warcraft, released in 2004, gamers worked together online to
complete quests in an effort to make their digital avatars stronger by
collecting items like weapons and armors. But the company has not dabbled in virtual
reality. It has primarily made games for personal computers and game consoles
but has yet to release a virtual reality game. What is Microsoft building for the
metaverse? So far, Microsoft’s
work on the metaverse has been nascent. For several years, the software giant has
developed the HoloLens, a $3,500 headset that shows digital holograms, with a
focus on applications for businesses and government agencies. The device is
related to augmented reality, which some technologists consider to be part of
the future metaverse. Microsoft is also the developer of the Xbox, the second most popular game console after the Sony PlayStation. But unlike the PlayStation, the Xbox has been conspicuously absent from the virtual reality gaming space. |
|||||||||||||||||||||||||||||||||||||||||||||||||||||||||||||||||||||||||||||||||||||||||||||||||||||||||||||||||||||||||||||||||||||||||||||||||||||||||||||||||||||||||||||||||||||||||||||||||||||||||||||||||||||||||||||||||||||||||||||||||||||||||||||||||||||||||||||||||||||||||||||||||||||||||||||||||||||||||||||||||||||||||||||||
|
Bitcoin
was supposed to hedge against inflation—here’s why it hasn’t worked that way Published Fri, Jul 8 20223:57 PM
EDT, Mike Winters Bitcoin is not mature enough to be used as inflation
hedge, says Anthony Scaramucci (youtube, CNBC)
Bitcoin
has plunged in value this year, weakening the argument often made by crypto
enthusiasts that it can be an effective hedge against inflation during times
of economic turmoil. Bitcoin
advocates have long argued that its scarcity would protect its value during
times of rising inflation. Unlike central banks — which can increase the
supply of money — there are a fixed number of coins, which keeps them scarce. Even before the market crashed,
there was debate about whether or not bitcoin would hold its value.
Billionaire investor Paul Tudor Jones was bullish on bitcoin as an inflation
hedge, while Dallas Mavericks owner and investor Mark Cuban dismissed the
idea as a “marketing slogan.” Another
argument is that bitcoin, along with other similar cryptocurrencies, will
have an intrinsic store of value over time as it becomes more accepted, like
gold. Supporters believe it will be seen as an asset that won’t depreciate
over time. However, this has not been proven
to be true, at least not yet. The
value of the cryptocurrency market overall has plummeted alongside rising inflation,
with bitcoin losing half of its value since January. As of Friday, the
price of bitcoin is $21,833, according to Coin Metrics. With
crypto, “the extent of [price] volatility is so significant, it’s very hard
for me to view it as a long-term store of value,”
Anjali Jariwala, certified financial planner and founder of Fit Advisors,
tells CNBC Make It. Jariwala
says that crypto in general is a new type of asset that doesn’t yet function
either as a sought-after commodity like gold, or even as a currency,
“because it’s not easily exchanged for
a good or service.” Despite its scarcity, the price of a cryptocurrency like
bitcoin is still based largely on consumer sentiment, she says. “It’s tricky because it’s supposed to act like a currency, it’s taxed
like property and some people compare it to a commodity. At the end of the
day, it really is its own asset class that doesn’t have a pure definition.” Another consideration is that
cryptocurrencies like bitcoin have only been around for just over a decade.
Because of this, “there isn’t enough history there in terms of historical
data to really understand what purpose it serves as an investment,” Jariwala
says. While
cryptocurrencies like bitcoin are “not proven” to be a reliable, long-term
store of value, they could still gain acceptance over time and become less
volatile, Omid Malekan, an adjunct professor at
Columbia Business School specializing in crypto and blockchain technology,
tells CNBC Make It. “Once volatility smooths out, we will have a better picture of how it
responds to macro developments, like the rate of inflation or what the Fed is
doing,” he says, cautioning that current crypto prices could reflect all
sorts of inputs aside from inflation, like too many overleveraged
cryptocurrency lenders or a lack of regulation. Either way, crypto as a whole remains a highly speculative investment.
Jariwala recommends only investing with money you’re prepared to lose. She
also says to think of crypto investing
as a long-term strategy and “stick to that strategy even during times like
this.” Cryptocurrency might evolve into
a more mature asset that can be a hedge against inflation. But “we just don’t
know yet, until we see more of a track history with it,” says Jariwala. ‘ Digital Currency: The Future Of Your Money David
Rodeck, Courtney Reilly Larke, Aug 16, 2022, 1:37pm https://www.forbes.com/advisor/ca/investing/digital-currency/
What Is Digital Currency? Digital
currency is any currency that’s available exclusively in electronic form. Electronic
versions of currency already predominate most countries’ financial systems.
In Canada, for instance, the physical Canadian currency in circulation is
less than 5% of the overall money supply; the remainder is held as commercial
bank deposits that translate as data points on spreadsheets and other records
tracking transactions among people and businesses. What differentiates digital currency from
the electronic currency currently in most bank accounts is that it never
takes physical form. Right now, you could go to an ATM and
turn an electronic record of your currency holdings into physical dollars. Digital currency, however, never takes
physical form. It always remains on a computer network and is exchanged via
digital means. For
example, instead of using physical dollar bills, you’d make purchases by
transferring digital currency to retailers using your mobile device.
Functionally, this may be no different than how you currently treat your
money using payment apps like Wealthsimple
Cash, Paypal or Apple Pay. Following the successful launch of
decentralized cryptocurrencies like Bitcoin and Ethereum, which store value
but are not managed by any central authorities, governments and central banks
around the world are researching the possibility of creating their own
digital currencies, commonly known as central bank digital currencies. What Is a Central Bank Digital Currency
(CBDC)? A central bank digital currency (CBDC) is
a digital currency that would be issued and overseen by a country’s central
bank. Think of it like Bitcoin, but if Bitcoin were managed by the Bank of
Canada and had the full backing of the Canadian government. As of
2022, only a handful of countries and territories have a CBDC and many more
are exploring central bank digital currencies or have plans to issue them. Some places CBDC is already available
include the Central Bank of The Bahamas (Sand Dollar), the Eastern Caribbean
Central Bank (DCash), the Central Bank of Nigeria (e-Naira) and the Bank of
Jamaica (JamDex). Are
their plans for CBDC in Canada? Canada’s central bank, the Bank of Canada,
has stated that they do not have plans to issue a digital currency any time
soon. That said, they are researching digital currency systems and business
models while working on building the capability to issue a digital version of
the Canadian dollar (a CBDC). Still,
the final say on whether or not Canada will have a CBDC (and when it will be
issued) is up to Parliament and the Government of Canada. How Would a CBDC Work? While
an Canadian CBDC may be far off currently, Jim Cunha, senior vice president
at the Federal Reserve Bank of Boston, shared how a CBDC or a digital dollar
might work across the border in the U.S. A
CBDC would function similar to actual cash, Cunha said. “If I gave you CBDC,
it’s as if I’m handing you physical money, like a $100 bill. You’d have that
money in your account and it’s yours. I couldn’t take it back.” This is
a key difference versus other forms of electronic payment today, such as PayPal. “If I send you money through
PayPal, it’s just a promise that money is coming. Your balance may show the
funds, but money hasn’t actually moved between banks yet.” Because
of that, the transactions are not irrevocable and it’s possible for the other
party to reverse; there are 60 days when an ACH transfer can be potentially
unwound. With transfers through CBDC,
the funds would be sent close to instantly and the other party couldn’t
cancel after. Another key advantage of a CBDC is that it
could be deemed legal tender. That means all economic
actors must accept it for any legal purposes. “You could pay your taxes with
it. Anyone you owe debt to, like the bank or individuals, legally are
required to take it,” Cunha said. This is
in contrast to other digital currencies, which are not legal tender. Only certain vendors accept crypto
directly, so people may need to convert their cryptocurrency into U.S. or
Canadian dollars before making most transactions. When you use crypto as a
form of payment, you also currently create a taxable event, which means you
may owe capital gains taxes each time you purchase something with Bitcoin or
Ether. This is in addition to any sales taxes. With a CBDC, you would only owe any applicable sales taxes, just like
you do using physical currency. How
Have Digital Currencies Worked Around the World? Despite
the potential benefits of a Canadian CBDC, it still remains a concept for
now. Around the world, other countries are a little further along with digital
currencies such as the Bahamas’ Sand Dollar, which launched in October 2020,
and China’s digital yuan, which is one
of the largest CBDC programs, launching a pilot project in 2014. “They
are testing a pilot in five cities. They gave out millions in currency
through lotteries just to prove it works,” said Cunha. People who win the
lottery receive free CBDC, which they can spend at local shops that accept
it. While
it’s not at national scale yet, once China has the platform ready, it will
expand through banks and mobile providers, like Alipay. The central banks of China and UAE are also working on a project to
use blockchain and CBDC for regional payments between nations. If these
projects are a success, they could give more motivation for other nations to
create their own CBDC. Because
of these trends, Lilya Tessler, head of Sidley’s FinTech and Blockchain
group, is optimistic about the future use of digital currencies. “We
certainly will see mass adoption of digital currencies, but it is difficult
to predict how it will look. A CBDC may replace the paper version of the U.S.
dollar. At the same time, society may focus on mainstream adoption of a
decentralized cryptocurrency.” Digital Currency Benefits ·
Faster payments. Using digital currency you can complete
payments much faster than current means, like electronic fund transfers or
wire transfers, which can take days for financial institutions to confirm a
transaction. ·
Less expensive international transfers. International currency transactions are
very expensive; individuals are charged high fees to move funds from one
country to another, especially when it involves currency conversions.
“Digital assets are disrupting this marketing by making it faster and less
costly,” said Andrew Kiguel, CEO of Tokens.com. ·
24/7 access. Existing money transfers often take more
time during weekends and outside normal business hours because banks are
closed and can’t confirm transactions. With digital currency, transactions
work at the same speed 24 hours a day, seven days a week. ·
Support for the unbanked and underbanked. It’s estimated 10% to 20% of Canadians
are either unbanked or underbanked, meaning they have limited access to
everyday banking service. They end up paying costly fees to cash their
paycheques and send payments to others through money orders or remittances.
If Canada launched a CBDC, unbanked individuals could access their money and
pay their bills without extra charges. ·
More efficient government payments. If the government developed a CBDC, it
could send payments like tax refunds and child benefits to people instantly,
rather than trying to mail them a cheque or using other methods. Digital Currency Disadvantages ·
Too many currencies to navigate at the
moment. The
current popularity of cryptocurrency is actually a downside. “There are so
many digital currencies being created across different blockchains that all
have their own limitations. It will
take time to determine which digital currencies may be appropriate for
certain use cases, including whether some are designed to scale for mass
adoption,” said Tessler. ·
Takes effort to learn how to use them.
Digital
currencies require work on the part of the user to learn how to perform
fundamental tasks, like how to open a digital wallet and properly store digital
assets securely. For digital currencies to be more widely adopted, the system
needs to get simpler. ·
Blockchain
transactions can be expensive.
Cryptocurrencies use the blockchain, where computers must solve complex
equations to verify and record transactions. This takes considerable
electricity and gets more expensive as there are more transactions. These
would probably not exist for a CBDC, however, since it would likely be
controlled by the central bank and the complex consensus processes are not needed. ·
Large
swings in digital currency prices. Cryptocurrency prices and value can change suddenly. Cunha
believes this is why businesses are reluctant to use it as a medium of
exchange. “As a business, do I want to accept something that’s volatile? What
if I hold a Bitcoin for a week and it loses 20% of value?” With CBDC, though,
the value is much stabler, like paper currency, and cannot fluctuate like
this. ·
Developing a CBDC will take time and tax
dollars. A
Canadian CBDC is still hypothetical. If the government decides to create one,
there will be costs associated with its development. How Would Digital Currency Affect You? If
Canada adopts a digital currency, it would work as an alternative to cash but
would also have the built-in advantage of quick money transfer since it’s
electronic. Cunha has a few ideas on what a similar digital currency for U.S.
currency would look like for consumers across the border. “Our presumption is
that it will be free or near free, like cash. Other private sector players may
innovate on top of it and possibly add fees, but that has to be fleshed out
more.” Even
though a digital currency would be electronic, it still needs to be as
accessible as cash. “Anyone should be able use it, not just those with the
latest smartphones,” Cunha said, suggesting chip-based cards, POS systems and
web accounts as alternative ways to access the CBDC. He also believes a way
to handle transactions offline will need to be developed, so two people could
exchange CBDC even if they aren’t on a cell or wifi network. There’s
a lot to be done and a lot of industry input needed, Cunha admits, but it
could be well worth the investment. “While no decision has been made to move
past this research, I truly believe a CBDC should be fully investigated and holds
great potential,” he said. “Just think of the internet and how far it’s come
since the early days. With CBDC, the possibilities are endless.” Homework of blockchiain, NFT, Metaverse, Crypto
Currency and Inflation, CBDC ·
Briefly describe what is blockchain. ·
How does blockchain work with bitcoin? ·
What is NFT? What is Metaverse? Are they worth
investing in? · Is
Bitboin a hedge again inflation? Why or why not? · What
is CBDC? Do you support CBDC? Why or why not? ·
Optional question:
What is Luna coin and what caused it to fail? The Rise and Fall of Terra
Luna. The Terra Luna Crash Explained (youtube) · Optional question: Could digital currencies put banks out of business? What
is your opinion? Please
refer to the video | The Economist (video)
·
Optional
question: What is Web3? Is there a
future in Web3? https://101blockchains.com/future-of-web3/ What Is Web3, and Is It the Future?(youtube)
|
Why People Love Dogecoin’—Elon Musk Reveals
One Surprise Reason Behind His Support For The ‘Joke’ Bitcoin Rival Amid
Crypto Price Crash How
Dogecoin works - Tech Explained (youtube)
Elon Musk Facing $258 Billion Lawsuit Over Alleged Dogecoin Pyramid Scheme (youtube, CNBC)
Billy
BambroughSenior Contributor,May 31, 2022,07:15pm EDT Tesla billionaire Elon Musk has repeatedly
given his support to the meme-based bitcoin rival dogecoin over the last few
years—helping its price to soar while mocking legendary investor
Warren Buffett. The
dogecoin price has, however, crashed dramatically from its 2021 peak, falling
along with bitcoin and other cryptocurrencies as a brutal crypto crash sparks
fears of a "price spiral." Now,
Elon Musk, who has increasingly become embroiled in Twitter rows since his
bid to take the company private was announced in April, has revealed one reason he thinks "people love dogecoin." "Billy’s sense of humor and
irreverence is a big part of why people love dogecoin," Musk
posted to Twitter, replying to dogecoin co-creator Billy Markus after
dogecoin's other co-creator, Jackson Palmer, launched a scathing attack on
Musk, accusing him of being a "grifter." "Palmer
always forgets to mention that he never wrote a single line of dogecoin
code," Musk shot back, with Markus adding, "the people after us did
exponentially more than either Jackson or I did on the code base." Markus and Palmer created dogecoin, which
is loosely based on a fork of bitcoin, as "a joke" that used the
doge meme as inspiration. Through early 2021 dogecoin attracted huge
attention, helped on by Musk and other high-profile backers such as billionaire
Mark Cuban, becoming a top ten cryptocurrency as traders piled into the
memecoin. It reached a market capitalization of almost $90 billion in early
May 2021. The dogecoin price has since crashed back, with its market cap
falling to under $10 billion. This
week, Palmer, an outspoken crypto critic, lashed out against the crypto
space, saying he thought it "would implode a bit more quickly and people
would learn their lesson." Palmer,
speaking to Australia's Crikey to promote his new Griftonomics podcast, said
he wishes "it was the end of crypto, but it’s not," and that
"increasingly people are doing nothing but making money off doing
nothing, it’s kind of fucked us all up." Palmer
also said he messaged Musk via Twitter years ago with details of a code
script he claimed could detect and automatically report Twitter
cryptocurrency scams. "It became apparent very quickly that [Musk]
didn’t understand coding as well as he made out," Palmer said. Musk
has repeatedly railed against Twitter bots and crypto scams on the platform,
accusing Twitter of underplaying the number of fake accounts and putting his
bid to take the company private "temporarily on hold" until Twitter
provides evidence of its assertion that fewer than 5% of its users were spam
or fake accounts. Last week, Musk announced his rocket
company SpaceX will follow Tesla in accepting dogecoin for merchandise,
temporariliy boosting the dogecoin price. Tesla began accepting dogecoin for
merchandise purchases in January. Tesla
last year briefly began accepting bitcoin for car purchases but Musk pulled
the plug just two months later, blaming bitcoin's high energy demands and
carbon footprint. Musk went onto say Tesla would most likely restart
accepting bitcoin though it hasn't done so yet. What is ethereum, and how does it work?
(youtube, CNBC)
|
|||||||||||||||||||||||||||||||||||||||||||||||||||||||||||||||||||||||||||||||||||||||||||||||||||||||||||||||||||||||||||||||||||||||||||||||||||||||||||||||||||||||||||||||||||||||||||||||||||||||||||||||||||||||||||||||||||||||||||||||||||||||||||||||||||||||||||||||||||||||||||||||||||||||||||||||||||||||||||||||||||||||||||||||
|
Chapter 2 What is
Money Part I What is
Money? · There is no single "correct" measure of
the money supply: instead, there are several measures, classified along a
spectrum or continuum between narrow and broad monetary
aggregates. • Narrow measures include only the most liquid
assets, the ones most easily used to spend (currency, checkable deposits).
Broader measures add less liquid types of assets (certificates of deposit,
etc.)
· M0: In
some countries, such as the United Kingdom, M0 includes bank reserves, so M0
is referred to as the monetary base, or narrow money. · MB: is
referred to as the monetary base or total currency. This
is the base from which other forms of money (like checking deposits, listed
below) are created and is traditionally the most liquid measure of the money
supply. · M1: Bank
reserves are not included in M1. (M1 and
Components @ Fed St. Louise website)
· M2:
Represents M1 and "close substitutes" for M1. M2 is a broader
classification of money than M1. M2 is a key economic indicator used to
forecast inflation. (M2 and
components @ Fed St. Louise website) · M3: M2
plus large and long-term deposits. Since 2006, M3 is no longer published by
the US central bank. However, there are still estimates produced by
various private institutions. (M3 and
components at Fed St. Louise website) Let’s watch this money
supply video: Draw Me The Economy: Money Supply (video)
For discussion:
·
Fed balance sheet over $5 trillion for first time (video) Whiteboard Economics: The Fed’s Balance Sheet Unwind
(youtube) – 2017
Federal Reserve Balance Sheet (Khan academy)- 2009
(optional)
https://www.federalreserve.gov/releases/h41/current/h41.htm#h41tab9
For discussion:
Summary:
Money Supply M2 in the United
States averaged 4121.70 USD Billion from 1959 until 2019, reaching an all
time high of 14872.10 USD Billion in July of 2019 and a record low of 286.60
USD Billion in January of 1959.
From https://tradingeconomics.com/united-states/money-supply-m2
|
||||||||||||||||||||||||||||||||||||||||||||||||||||||||||||||||||||||||||||||||||||||||||||||||||||||||||||||||||||||||||||||||||||||||||||||||||||||||||||||||||||||||||||||||||||||||||||||||||||||||||||||||||||||||||||||||||||||||||||||||||||||||||||||||||||||||||||||||||||||||||||||||||||||||||||||||||||||||||||||||||||||||||||||||
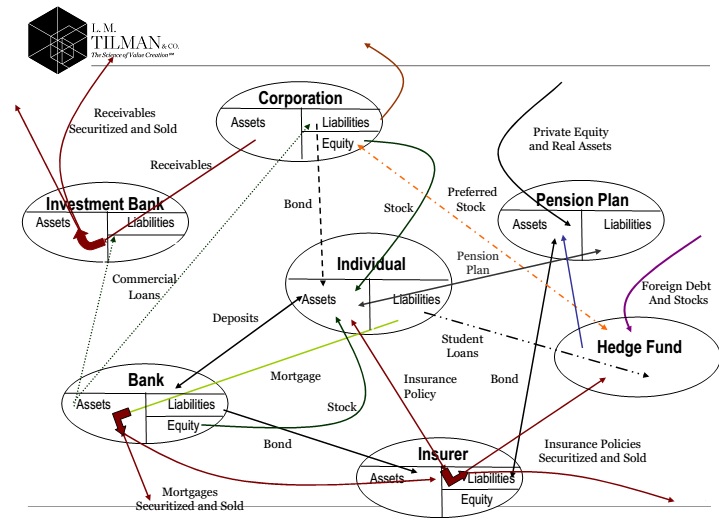
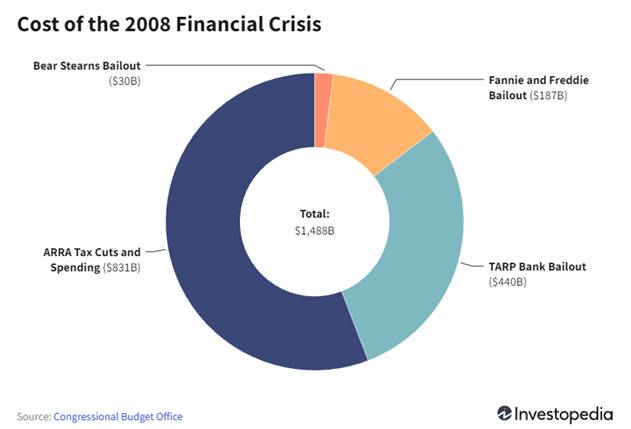


|
Related |
Last |
Previous |
Unit |
Reference |
|
2.50 |
1.75 |
percent |
Jul 2022 |
|
|
20514.70 |
20545.40 |
USD Billion |
Jul 2022 |
|
|
5536900.00 |
5506500.00 |
USD Million |
Jul 2022 |
|
|
21709.20 |
21667.50 |
USD Billion |
Jul 2022 |
|
|
8849762.00 |
8879138.00 |
USD Million |
Aug 2022 |
|
|
22882.40 |
22773.30 |
USD Billion |
Aug 2022 |
|
|
35947.00 |
36273.00 |
USD Million |
Jul 2022 |
|
|
2704.00 |
2661.89 |
USD Billion |
Jul 2022 |
|
|
2.31 |
2.31 |
Aug 2022 |
https://tradingeconomics.com/united-states/money-supply-m0

https://tradingeconomics.com/united-states/money-supply-m1

https://tradingeconomics.com/united-states/money-supply-m2

From https://www.federalreserve.gov/releases/h6/current/default.htm
|
te |
Seasonally adjusted |
Not seasonally adjusted |
||||||||
|
M1 1 |
M2 2 |
Monetary base |
M1 1 |
M2 2 |
Memorandum: Reserves |
|||||
|
Currency in circulation 3 |
Reserve balances 4 |
Monetary base 5 |
Total reserves 6 |
Total ($M) borrowings 7 |
Nonborrowed reserves 8 |
|||||
|
Mar. 2021 |
18,641.4 |
19,853.8 |
2,117.8 |
3,721.3 |
5,839.0 |
18,721.3 |
19,946.3 |
3,721.3 |
57,950.3 |
3,663.3 |
|
Apr. 2021 |
18,927.5 |
20,110.6 |
2,154.8 |
3,887.3 |
6,042.1 |
19,085.6 |
20,270.1 |
3,887.3 |
66,805.2 |
3,820.5 |
|
May 2021 |
19,259.7 |
20,418.8 |
2,169.5 |
3,872.4 |
6,041.9 |
19,169.9 |
20,319.7 |
3,872.4 |
80,781.7 |
3,791.6 |
|
June 2021 |
19,319.7 |
20,460.3 |
2,179.0 |
3,848.1 |
6,027.0 |
19,310.5 |
20,440.8 |
3,848.1 |
87,746.0 |
3,760.3 |
|
July 2021 |
19,497.5 |
20,620.9 |
2,186.3 |
3,943.9 |
6,130.2 |
19,459.5 |
20,571.9 |
3,943.9 |
87,621.1 |
3,856.3 |
|
Aug. 2021 |
19,746.6 |
20,853.5 |
2,188.6 |
4,140.1 |
6,328.7 |
19,683.8 |
20,778.1 |
4,140.1 |
80,766.7 |
4,059.3 |
|
Sept. 2021 |
19,899.0 |
20,992.5 |
2,195.6 |
4,193.2 |
6,388.8 |
19,874.2 |
20,957.9 |
4,193.2 |
68,567.7 |
4,124.6 |
|
Oct. 2021 |
20,063.5 |
21,143.9 |
2,202.8 |
4,128.1 |
6,330.9 |
20,021.0 |
21,098.0 |
4,128.1 |
54,558.8 |
4,073.5 |
|
Nov. 2021 |
20,279.9 |
21,349.4 |
2,214.1 |
4,180.6 |
6,394.7 |
20,267.4 |
21,334.5 |
4,180.6 |
45,317.6 |
4,135.3 |
|
Dec. 2021 |
20,430.7 |
21,490.1 |
2,225.2 |
4,187.9 |
6,413.1 |
20,591.3 |
21,660.4 |
4,187.9 |
38,082.2 |
4,149.9 |
|
Jan. 2022 |
20,585.4 |
21,649.6 |
2,232.8 |
3,871.1 |
6,103.9 |
20,549.2 |
21,636.7 |
3,871.1 |
32,055.1 |
3,839.1 |
|
Feb. 2022 |
20,661.2 |
21,708.5 |
2,235.5 |
3,804.5 |
6,040.0 |
20,528.0 |
21,590.3 |
3,804.5 |
28,714.6 |
3,775.8 |
|
Mar. 2022 |
20,699.1 |
21,739.8 |
2,259.8 |
3,874.7 |
6,134.5 |
20,800.8 |
21,855.8 |
3,874.7 |
26,205.8 |
3,848.5 |
|
Apr. 2022 |
20,615.3 |
21,655.5 |
2,269.8 |
3,615.4 |
5,885.2 |
20,817.7 |
21,860.3 |
3,615.4 |
23,960.3 |
3,591.4 |
|
May 2022 |
20,620.7 |
21,684.4 |
2,273.7 |
3,317.9 |
5,591.6 |
20,537.9 |
21,590.3 |
3,317.9 |
21,882.7 |
3,296.0 |
|
June 2022 |
20,545.0 |
21,667.3 |
2,278.1 |
3,228.4 |
5,506.5 |
20,535.3 |
21,645.1 |
3,228.4 |
21,422.5 |
3,207.0 |
|
July 2022 |
20,514.7 |
21,709.2 |
2,278.5 |
3,258.4 |
5,536.9 |
20,470.4 |
21,651.9 |
3,258.4 |
19,541.1 |
3,238.8 |
Part II Money Supply,
Money Velocy, and Inflation
 https://fred.stlouisfed.org/series/M2V
What Is the Velocity of Money?
The velocity of money is a
measurement of the rate at which money is exchanged in an economy. It is the
number of times that money moves from one entity to another. It also refers
to how much a unit of currency is used in a given period of time. Simply put,
it's the rate at which consumers and businesses in an economy collectively
spend money.
The velocity of money is
usually measured as a ratio of gross domestic product (GDP) to a country's M1
or M2 money supply.
Velocity of Money = GDP ÷ Money
Supply
What Does Velocity of Money Measure?
The velocity of money
estimates the movement of money in an economy—in other words, the number of times the average dollar changes
hands over a single year. A high velocity of money indicates a bustling economy
with strong economic activity, while a low velocity indicates a general
reluctance to spend money.
How Do You Calculate the Velocity of Money?
The velocity of money is
calculated by dividing a country's gross domestic product by the total supply
of money. This calculation can use either the M1 money supply, which includes
physical currency, checkable deposits, and certain other figures, or the M2
supply, which also includes savings deposits and money market funds.
Why Is the Velocity of Money So Low?
The velocity of money in the
United States fell sharply during the first and second quarters of 2020, as
calculated by the St. Louis Federal Reserve Bank. While there is no
definitive explanation, the fall is likely due to the diminished activity
incurred during the COVID-19 pandemic, as well as an increase in consumer
savings due to economic uncertainty. https://www.investopedia.com/terms/v/velocity.asp
The Velocity of Money Explained in One Minute (youtube)
Quantity Theory of Money (youtube)
Quantity theory
of money (Khan academy)
Steve Hanke says we’re going to have one ‘whopper’
of a recession in 2023
PUBLISHED MON,
AUG 29 202210:28 PM EDT,Abigail Ng
KEY POINTS
• The U.S. economy is going to fall into a recession next year, according to Steve Hanke, a professor of applied economics at Johns Hopkins University, and that’s not necessarily because of higher interest rates.
• “We will have a recession because we’ve had five months of zero M2 growth, money supply growth, and the Fed isn’t even looking at it,” he told CNBC’s “Street Signs Asia” on Monday.
• Meanwhile, inflation is going to remain high because of “unprecedented growth” in money supply in the United States, Hanke said.
The U.S.
economy is going to fall into a recession next year, according to Steve
Hanke, a professor of applied economics at Johns Hopkins University, and
that’s not necessarily because of higher interest rates.
“We will have a recession because we’ve
had five months of zero M2 growth, money supply growth, and the Fed isn’t
even looking at it,” he told CNBC’s “Street Signs Asia” on Monday.
Market watchers use the broad M2 measure as an
indicator of total money supply and future inflation. M2 includes cash,
checking and savings deposits and money market securities.
In recent months, money supply has
stagnated and that’s likely to lead to an economic slowdown, Hanke
warned.
“We’re going
to have one whopper of a recession in 2023,” he said.
Meanwhile, inflation is going to remain high because
of “unprecedented growth” in money supply in the United States, Hanke said.
Historically, there has never been “sustained
inflation” that isn’t the result of excess growth in money supply, and
pointed out that money supply in the U.S. saw “unprecedented growth” when
Covid began two years ago, he said.
“That is why we are having inflation now,
and that’s why, by the way, we will continue to have inflation through 2023
going into probably 2024,” he added.
In 2020, CNBC reported
that the growth in money supply could lead to high inflation.
“The bottom line is we’re going to have stagflation
— we’re going to have the inflation because of this excess that’s now coming
into the system,”
he added.
“The problem we have is that the [Fed Chair
Jerome Powell] does not understand, even at this point, what the causes of
inflation are and were,” Hanke said.
“He’s still going on about supply-side glitches,” he said, adding that “he
has failed to tell us that inflation is always caused by excess growth in the
money supply, turning the printing presses on.”
Powell, in his policy speech at the annual Jackson
Hole economic symposium on Friday, said he views the high inflation in the
U.S. as a “product of strong demand and constrained supply, and that the
Fed’s tools work principally on aggregate demand.”
‘Sacrificial lamb’
David
Rosenberg, president of Rosenberg Research, also expressed skepticism over
the Fed’s direction, but in other respects. He said the Fed is now “more than happy” to overtighten to get inflation down
quickly.
“Overtighten means that if the economy slips
into a recession, you know — so be it,” he told CNBC’s “Squawk Box Asia” on
Monday, adding that Powell said this is short-term pain for long-term gain.
He said he’s “a little disappointed” that the
central bank is chasing lagging indicators like the unemployment rate and
inflation, but that the Fed is “not going to take any chances” after being
“thoroughly embarrassed” for calling inflation transitory.
″[Powell] basically said the economy will
be, near term, a sacrificial lamb,” Rosenberg said.
“I think this Fed, after being on the wrong side
of the call for the past say 12 to 15 months, are going to need to see
probably at least six months of intense disinflation in the price data before
they call it quits,” he added.
Jerome Powell Is Wrong. Printing Money Causes
Inflation.
The Fed chairman insists the growth of M2 doesn’t
‘have important implications.’ The math shows otherwise.
By Steve H. Hanke
and Nicholas Hanlon, Feb. 23, 2022 1:07 pm ET
Main Street
(11/15/21): "Inflation is just
like alcoholism," said economist Milton Friedman. "In both
cases...the good effects come first, the bad effects only come later." Could
there be a lesson here for Joe Biden?
Federal Reserve Chairman Jerome Powell still
believes that inflation and the money supply are unconnected. He first made
this remarkable assertion in his Semiannual Monetary Policy Report to
Congress last February, saying that “the
growth of M2 . . . doesn’t really have important implications for the
economic outlook.” Since then, the U.S. annual inflation rate has climbed
to 7.5% from 1.7%, but Mr. Powell hasn’t changed his mind. He doubled down
during congressional testimony in December, arguing that the connection
between money and inflation ended about 40 years ago. The nearby chart shows
otherwise.
By turning a
blind eye to money, the Fed has allowed the printing presses to run in
overdrive. The money supply as
measured by M2, which is the Fed’s broadest measure of money in the economy,
has been growing at record rates—with 39.9% cumulative growth since February
2020. M2 is still growing at an elevated, inflationary rate of 12.6% a year.
Before the pandemic, you’d have to go back to the early 1980s to find a
monetary growth rate this high.

One of us, Mr.
Hanke, predicted in these pages last July that year-end inflation for 2021
would “be at least 6% and possibly as high as 9%.” That was based on the quantity theory of money, which
economic thinkers have used since the Renaissance. The theory rests on a
simple identity, the equation of exchange, which demonstrates the link
between the money supply and inflation: MV=Py, where M is the money supply, V
is the velocity of money (the speed at which it circulates relative to total
spending), P is the price level, and y is real gross domestic product. So,
the quantity theory of money provides the link between money and inflation.
If Mr. Powell
is right and all that is outdated thinking, then when looking back through
economic data, the equation of exchange shouldn’t be able to predict prices.
But look at the chart. When we took
the past 60 years of economic data and the rate-of-change form of the
identity we explained above, it predicted price changes almost perfectly. Our
estimate deviated from actual inflation only during 2020, as the money supply
grew at unprecedented rates and lockdowns stanched real growth. By June 2021,
our estimate for inflation based on the quantity theory of money had reverted
back to its conjunction with actual inflation.
Money Velocity
Is At An All-Time Low. Why Does It Matter?
Forbes
Finance Council, Ivan IllanForbes Councils Member
Forbes
Finance CouncilCOUNCIL POST| Membership (Fee-Based), Apr 25, 2022,07:00am EDT
There
are many economic measurements that could be referenced when formulating a
forecast. You’re probably familiar with economic data like unemployment
figures, Fed funds rate and the inflation rate. Those are important but don’t
necessarily tell the whole story on the state of the economy, much less the
direction to which things may be headed. In my and my team’s own research, as
part of our investment committee decision-making discussions, we often like
to seek out more obscure data. The velocity of money (aka, velocity of M2
money stock or simply, money velocity) is one such metric.
Money velocity (MV) isn’t a
complicated concept. The Federal Reserve might describe it as the turnover
rate of a dollar through the U.S. economy. A higher MV figure means a dollar
is cycling through domestic transactions for goods and services more
frequently. Conversely, a lower figure would mean the exact opposite, which
could indicate a slowing economic backdrop.
Referencing
data on MV from the Federal Reserve Bank of St. Louis, you can see something
noteworthy. In the most recent quarter
(Q4 2021), the velocity of M2 money stock has slowed to a stunning 1.123.
Essentially, this means that one USD cycled through the U.S. economy in Q4
2021 about 1.123 times. During the Great Financial Crisis (GFC), MV went from
a high of 1.989 at the GFC’s start in Q3 2007 to a low of 1.712 by end of the
crisis in Q1 2009. Now surprisingly, MV is 34.4% lower than where it was at
coming out of the GFC. This seems troubling.
It’s possible that a
declining MV could have been directly attributed to record low interest
rates, which resulted from record high growth of money supply.
Afterall, the formula for MV is
simple: GDP/money supply. Therefore, a huge increase in the denominator
naturally results in a lower figure without the same corresponding increase
in GDP. If not cycling through
transactions, where did all that newly minted money go?
Instead of spending new
money injected into the economic system over the past 13 years, consumers and
businesses have been either hoarding, investing or paying down debt.
Household savings rates spiked during the past couple of years, which
resulted in cash hoarding in checking and savings accounts.
Since
the GFC, and because of record low interest rates, investors allocated monies
toward various asset classes, primarily corporate stock shares and real
estate. Households took some of that new money and paid down debt, while
corporations took advantage of the low rates and issued record amounts of new
debt. U.S. corporations are now sitting atop the highest corporate debt
mountain in U.S. history.
Part III What is Fractional Reserve Banking System?
The Money
Multiplier (video)
Money creation in a fractional reserve system |
Financial sector | AP Macroeconomics | Khan Academy
Fractional Reserve Banking
By JULIA KAGAN Updated August 10, 2022, Reviewed by SOMER
ANDERSON
What Is Fractional Reserve Banking?
Fractional reserve
banking is a system in which only a
fraction of bank deposits are backed by actual cash on hand and available for
withdrawal. This is done to theoretically expand the economy by freeing
capital for lending. Today, most economies' financial systems use
fractional reserve banking.
KEY TAKEAWAYS
·
Fractional reserve
banking describes a system whereby banks can loan out a certain amount of the
deposits that they have on their balance sheets.
·
Banks are required
to keep on hand a certain amount of the cash that depositors give them, but
banks are not required to keep the entire amount on hand.
·
Often, banks are
required to keep some portion of deposits on hand, which is known as the
bank's reserves.
·
Some banks are
exempt from holding reserves, but all banks are paid a rate of interest on
reserves.
Understanding
Fractional Reserve Banking
Banks are required to
keep on hand and available for withdrawal a certain amount of the cash that
depositors give them. If someone deposits $100, the bank can't lend out the
entire amount. Nor are banks required to keep the entire amount on hand. Many central banks have historically
required banks under their purview to keep 10% of the deposit, referred to as
reserves. This requirement is set in the U.S. by the Federal Reserve and is
one of the central bank's tools to implement monetary policy. Increasing the
reserve requirement takes money out of the economy while decreasing the
reserve requirement puts money into the economy.
Historically, the
required reserve ratio on non-transaction accounts (such as CDs) is zero,
while the requirement on transaction deposits (e.g., checking accounts) is 10
percent. Following recent efforts to stimulate economic growth, however, the
Fed has reduced the reserve requirements to zero for transaction accounts as
well.
Fractional Reserve
Requirements
Depository
institutions must report their transaction accounts, time and savings
deposits, vault cash, and other reservable obligations to the Fed either
weekly or quarterly. Some banks are exempt from holding reserves, but all banks are paid a rate of interest on
reserves called the "interest rate on reserves" (IOR) or the
"interest rate on excess reserves" (IOER). This rate acts as an
incentive for banks to keep excess reserves.
Reserve requirements
for banks under the Federal Reserve Act were set at 13%, 10%, and 7%
(depending on what kind of bank) in 1917. In the 1950s and '60s, the Fed had
set the reserve ratio as high as 17.5% for certain banks, and it remained
between 8% to 10% throughout much of the 1970s through the 2010s.
During this period,
banks with less than $16.3 million in assets were not required to hold
reserves. Banks with assets of less than $124.2 million but more than $16.3
million had to have 3% reserves, and those banks with more than $124.2
million in assets had a 10% reserve requirement.
Beginning March 26, 2020, the 10% and 3% required reserve ratios
against net transaction deposits was reduced to 0 percent for all banks,
essentially removing the reserve requirements altogether.
Prior to the introduction
of the Fed in the early 20th century, the National Bank Act of 1863 imposed
25% reserve requirements for U.S. banks under its charge.
Fractional Reserve Multiplier Effect
"Fractional reserve" refers to the
fraction of deposits held in reserves. For example, if a bank has $500
million in assets, it must hold $50 million, or 10%, in reserve.
Analysts reference an
equation referred to as the multiplier equation when estimating the impact of
the reserve requirement on the economy as a whole. The equation provides an estimate for the amount of money created
with the fractional reserve system and is calculated by multiplying the
initial deposit by one divided by the reserve requirement. Using the
example above, the calculation is $500 million multiplied by one divided by
10%, or $5 billion.
This is not how money is actually created but only a way to
represent the possible impact of the fractional reserve system on the money
supply. As such, while is useful for economics professors, it is generally
regarded as an oversimplification by policymakers.
What Are the Pros of Fractional Reserve Banking?
Fractional reserve banking permits banks to use funds (i.e., the
bulk of deposits) that would be otherwise unused and idle to generate returns
in the form of interest rates on new loans—and to make more money available
to grow the economy. It is thus able to better allocate capital to where it
is most needed.
What Are the Cons of Fractional Reserve Banking?
Fractional reserve banking could catch a bank short of funds
on hand in the self-perpetuating panic of a bank run. This occurs when
too many depositors demand their cash at the same time, but the bank only
has, say 10% of deposits in liquid cash available. Many U.S. banks were
forced to shut down during the Great Depression because too many customers
attempted to withdraw assets at the same time. Nevertheless, fractional
reserve banking is an accepted business practice that is in use at banks
worldwide.
Where Did Fractional
Reserve Banking Originate?
Nobody knows for sure
when fractional reserve banking originated, but it is certainly not a modern
innovation. Goldsmiths during the Middle Ages were thought to issue demand
receipts for gold on hand that exceeded the amount of physical gold they had
under custody, knowing that on any given day only a small fraction of that
gold would be demanded.
In 1668, Sweden's
Riksbank introduced the first instance of modern fractional reserve banking.
Example:
You deposited $1,000 in a local bank
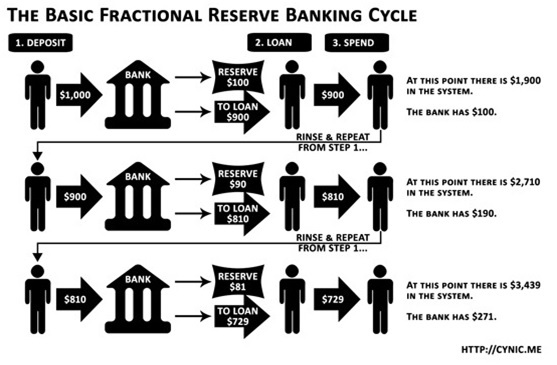
|
Iteration # |
Deposited |
= |
Reserves |
+ |
Available to Lend |
Bank |
|
Lends to |
||||||
|
1. A |
1,000.00 |
= |
100 |
+ |
900 |
A |
|
2. B |
900 |
= |
90 |
+ |
810 |
B |
|
3. C |
810 |
= |
81 |
+ |
729 |
C |
|
4. D |
729 |
= |
72.9 |
+ |
656.1 |
D |
|
And the cycle continues… |
||||||
Excel Template (FYI) – Fractional reserve banking
|
Iteration # |
Deposited by |
Amount Held |
Amount |
Total Amount that |
Total Amount that |
Total Amount |
Total Amount that |
|
Customer |
in Reserve |
Currently |
“Can” be |
Has Been |
Held in Reserve |
Customers Believe |
|
|
|
from Deposit |
Available to |
Lent Out |
Lent Out |
|
They Have |
|
|
|
|
Lend Out |
|
|
|
|
|
|
|
|
from Deposit |
|
|
|
|
|
|
1 |
1,000.00 |
100 |
900 |
900 |
0 |
100 |
1,000.00 |
|
2 |
900 |
90 |
810 |
1,710.00 |
900 |
190 |
1,900.00 |
|
3 |
810 |
81 |
729 |
2,439.00 |
1,710.00 |
271 |
2,710.00 |
|
4 |
729 |
72.9 |
656.1 |
3,095.10 |
2,439.00 |
343.9 |
3,439.00 |
|
5 |
656.1 |
65.61 |
590.49 |
3,685.59 |
3,095.10 |
409.51 |
4,095.10 |
|
6 |
590.49 |
59.05 |
531.44 |
4,217.03 |
3,685.59 |
468.56 |
4,685.59 |
|
7 |
531.44 |
53.14 |
478.3 |
4,695.33 |
4,217.03 |
521.7 |
5,217.03 |
|
8 |
478.3 |
47.83 |
430.47 |
5,125.80 |
4,695.33 |
569.53 |
5,695.33 |
|
9 |
430.47 |
43.05 |
387.42 |
5,513.22 |
5,125.80 |
612.58 |
6,125.80 |
|
10 |
387.42 |
38.74 |
348.68 |
5,861.89 |
5,513.22 |
651.32 |
6,513.22 |
|
|
Weaknesses of fractional reserve lending
(khan academy)
Homework of
chapter 2 (due with first mid term)
1.
Write down the definition of M0, M1, M2 and M3; Which one is used as
a measure of money supply in this country? How much is it by the end of July
2020?
2. From Fed St. Louis website, find
the most recent charts of M1 money stock and M2 money stock.
a.
http://research.stlouisfed.org/fred2/categories/24
b.
Compare the two charts and discuss the differences between the two
charts.
3.
What is fractional banking system?
4.
Imagine that you deposited $5,000 in Bank A. Reserve
ratio is 0.1. Imagine that the
fractional banking system is fully functioning. After five cycles, what is the amount that has been deposited and
what is the total amount that has been lent out?
5. What is Money velocity? Briefly explain the relationship between money velocity and inflation?
6. Briefly explain the relationship between money supply and inflation?
Money Multiplier and
Reserve Ratio
https://www.economicshelp.org/blog/67/money/money-multiplier-and-reserve-ratio-in-us/
The
Money Multiplier refers to
how an initial deposit can lead to a bigger final increase in the total money
supply.
For example, if the commercial banks gain deposits of £1
million and this leads to a final money supply of £10 million. The money multiplier
is 10.
The money multiplier is a
key element of the fractional banking system.
- There is an initial increase in bank
deposits (monetary base)
- The bank holds a fraction of this
deposit in reserves and then lends out the rest.
- This bank loan will, in turn, be
re-deposited in banks allowing a further increase in bank lending and a
further increase in the money supply.
The
Reserve Ratio
The reserve ratio is the %
of deposits that banks keep in liquid reserves.
For example 10% or 20%
Formula for money multiplier
In theory, we can predict the size of the money multiplier by
knowing the reserve ratio.
- If you had a reserve
ratio of 5%. You would expect a money multiplier of 1/0.05 = 20
- This is because if you
have deposits of £1 million and a reserve ratio of 5%. You can
effectively lend out £20 million.
Example of money multiplier
- Suppose banks keep a
reserve ratio of 10%. (0.1)
- Therefore, if someone
deposits $100, the bank will keep $10 as reserves and lend out $90.
- However, because $90
has been lent out – other banks will see future
deposits of $90.
- Therefore, the process
of lending out deposits can start again.
Note: This
example stops at stage 10. In theory, the process can continue for a long
time until deposits are fractionally very small.
- If allowed to repeat
for an infinite number of times, the final total deposits would be
$1,000
- Money multiplier =
1/0.1 = 10.
- Final increase in money
supply = 10 x $100 = $1,000
Using the Reserve ratio to influence monetary policy
In theory, if a Central
Bank demands a higher reserve ratio – it should have
the effect of acting like deflationary monetary policy. A higher reserve
ratio should reduce bank lending and therefore reduce the money supply.
Money Multiplier in the real
world
In a simple theory of the money multiplier, it is assumed that
if the bank lends $90 – all of this will return. However, in the real world, there are
many reasons why the actual money multiplier is significantly smaller than
the theoretically possible money multiplier.
- Import spending. If
consumers buy imports the money leaves the economy
- Taxes.
A percentage of income will be taken in taxes.
- Savings.
Not all money is spent and circulated, a significant percentage will
be saved
- Currency Drain Ratio. This is the % of banknotes that
individual consumers keep in cash, rather than depositing in banks. If
consumers deposited all their cash in banks, there would be a bigger
money multiplier. But, if people keep funds in cash then the banks
cannot lend more
- Bad loans.
A bank may lend out $90 but the company goes bankrupt and so this is
never deposited bank into the banking system.
- Safety reserve ratio. This is the % of deposits a bank may
like to keep above the statutory reserve ratio. i.e. the required
reserve ratio may be 5%, but banks may like to keep 5.2%.
- It might not be possible to lend more money out. Just because banks could lend 95%
of their deposits doesn’t mean they can, even if
they wanted to. In a recession, people may not want to borrow, but they
prefer to save.
- Banks may not want to
lend Also, at various times, the banks may not want to lend, e.g. during
a recession they feel firms and individuals more likely to default.
Therefore, the banks end up with a higher reserve ratio.
Therefore, due to these factors, the reserve ratio and money
multiplier are theoretical.
Loan first multiplier
The money multiplier model suggests banks wait for deposit and
then lend out a fraction. However, in
the real world, banks may take it upon themselves to issue a loan, and then
seek out reserves from other financial institutions/Central Bank or private
individuals.
For example, in the credit
bubble of 2000-2007, many banks were lending mortgages by borrowing on
short-term money markets. They were lending money
that wasn’t related to saving deposit accounts.
Money multiplier and
quantitative easing
In 2009-12 Central Banks pursued quantitative easing. This
involves increasing the monetary base. – Buying bonds off banks gave them
greater cash reserves. In theory, this increase in the money multiplier
should increase the overall money supply by a large amount due to the money
multiplier
However, in practice, this didn’t occur. The money supply
didn’t increase because banks were not keen to lend any extra money. Also,
banks were trying to improve their reserves following the credit crunch and
their previous over-extension of loans.
Chapter 3 Financial Instruments,
Financial Markets, and Financial Institutions
Part I: Examples and characteristics of financial instruments
What
Is a Financial Instrument? Video
https://www.investopedia.com/terms/f/financialinstrument.asp
Financial
instruments are assets that can be traded, or they can also be seen as
packages of capital that may be traded. Most types of
financial instruments provide efficient flow and transfer of capital all
throughout the world's investors. These assets can be cash, a contractual
right to deliver or receive cash or another type of financial instrument, or
evidence of one's ownership of an entity.
KEY TAKEAWAYS
- A financial instrument is a real or virtual document
representing a legal agreement involving any kind of monetary value.
- Financial instruments may be divided into two types: cash instruments and derivative instruments.
- Financial instruments may also be divided according to an asset class, which depends on whether they are debt-based or equity-based.
- Foreign exchange instruments comprise a third, unique type of financial instrument.
Understanding Financial
Instruments
Financial
instruments can be real or virtual documents representing a legal agreement
involving any kind of monetary value. Equity-based financial instruments
represent ownership of an asset. Debt-based financial instruments represent a
loan made by an investor to the owner of the asset.
Foreign exchange instruments
comprise a third, unique type of financial instrument. Different
subcategories of each instrument type exist, such as preferred share equity
and common share equity.
International Accounting
Standards (IAS) defines financial
instruments as "any contract that gives rise to a financial asset of one
entity and a financial liability or equity instrument of another
entity."
Types
of Financial Instruments
Financial
instruments may be divided into two types: cash instruments and derivative
instruments.
Cash Instruments
The
values of cash instruments are directly influenced and determined by the
markets. These can be securities that are easily
transferable.
Cash instruments may also be
deposits and loans agreed upon by borrowers and lenders.
Derivative Instruments
The value and characteristics of
derivative instruments are based on the vehicle’s underlying components, such
as assets, interest rates, or indices.
An equity options contract, for
example, is a derivative because it derives its value from the underlying
stock. The option gives the right, but not the obligation, to buy or sell the
stock at a specified price and by a certain date. As the price of the stock
rises and falls, so too does the value of the option although not necessarily
by the same percentage.
There can be over-the-counter
(OTC) derivatives or exchange-traded derivatives. OTC is a market or process
whereby securities–that are not listed on formal exchanges–are priced and
traded.
Types of Asset Classes of
Financial Instruments
Financial instruments may also be
divided according to an asset class, which depends on whether they are
debt-based or equity-based.
Debt-Based Financial Instruments
Short-term debt-based financial
instruments last for one year or less. Securities of this kind come in the
form of T-bills and commercial paper. Cash of this kind can be deposits and
certificates of deposit (CDs).
Exchange-traded derivatives under
short-term, debt-based financial instruments can be short-term interest rate
futures. OTC derivatives are forward rate agreements.
Long-term debt-based financial
instruments last for more than a year. Under securities, these are bonds.
Cash equivalents are loans. Exchange-traded derivatives are bond futures and
options on bond futures. OTC derivatives are interest rate swaps, interest
rate caps and floors, interest rate options, and exotic derivatives.
Equity-Based Financial
Instruments
Securities under equity-based
financial instruments are stocks. Exchange-traded derivatives in this
category include stock options and equity futures. The OTC derivatives are
stock options and exotic derivatives.
Getting
to Know the Money Market
By BARCLAY PALMER Updated June
08, 2021
https://www.investopedia.com/articles/04/071304.asp
The major attributes that draw an
investor to short-term money market instruments are superior safety and
liquidity. Money market instruments
have maturities that range from one day to one year, although they are most
often three months or less.
Because these investments are associated with massive and actively traded secondary
markets, you can almost always sell them prior to maturity, albeit at the
price of forgoing the interest you would have gained by holding them until
maturity.
Types of Money Market Instruments
A large number of financial
instruments have been created for the purposes of short-term lending and
borrowing. Many of these money market instruments are quite specialized, and
they are typically traded only by those with intimate knowledge of the money
market, such as banks and large financial institutions.
Some
examples of these specialized instruments are federal funds, the discount
window, negotiable certificates of deposit (NCDs), eurodollar time deposits,
repurchase agreements, government-sponsored enterprise securities, shares in
money market instruments, futures contracts, futures options, and swaps.
Aside from these specialized
instruments on the money market are the investment vehicles with which
individual investors will be more familiar, such as short-term investment pools (STIPs) and money market mutual funds,
Treasury bills, short-term municipal securities, commercial paper, and
bankers' acceptances. Here we take a closer look at STIPs, money market
mutual funds, and Treasury bills.
Short-Term Investment Pools and
Money Market Mutual Funds
Short-term
investment pools (STIPs) include money market mutual funds, local government
investment pools, and short-term investment funds of bank trust departments.
All STIPs are sold as shares in very
large pools of money market instruments, which may include any or all of the
money market instruments mentioned above. In other words, STIPs are a convenient means of
cumulating various money market products into one product, just as an
equity or fixed income mutual fund brings together a variety of stocks, bonds,
and so forth.
STIPs
make specialized money market instruments accessible to individual investors
without requiring intimate knowledge of the various instruments contained
within the pool. STIPs also alleviate the large minimum investment amounts
required to purchase most money market instruments, which generally equal or
exceed $100,000.
Money
market accounts are safe, low-risk investments. They're generally a good
place to put your money, especially if you need immediate access to it while
you collect interest. Institutions offer higher
interest rates because they use the funds in money market accounts to invest
in short-term assets with short-term maturities, as noted above.
How does the Money Market work? (video)
Part II: Order types
Understanding
order types by wall street survivor (youtube)
Order types (market, limit, stop),
video
For
discussion:
1. Why did
the other seller reduce the asking price after she posted her selling order?
2.
Why did she hide her purchasing orders of
20,000 shares?
Understanding Stock Orders that
you can try
1. Market order: A
market order instructs your broker to buy or sell the stock immediately at
the prevailing price, whatever that may be.
2. Limit order: Limit
orders instruct your broker to buy or sell a stock at a particular price. The
purchase or sale will not happen unless you get your price.
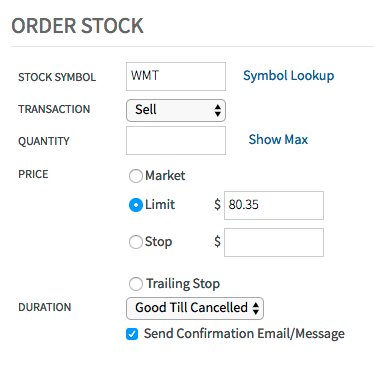 (www.investorpedia.com)
For
example, our example portfolio purchased shares of Wal-Mart for $70.35 per share. Now we plan to sell our WMT
shares after they realize a $10, or roughly 20%, increase. However, rather
than constantly checking the market several times in a single day, with the
intent of entering a market sell order once WMT reaches at least $80.35 per
share, we can submit a simple limit sell order to do that for us.
Click on Sell for the
Transaction type and enter 100 for the Quantity. For the order price, you
need to select the button corresponding to Limit and then enter 80.35 as the limit price - this will ensure your
order to sell WMT shares will not occur unless you can get at least $80.35
per share for your position of WMT shares. We keep the order's Term set
at "Good Till Cancelled",
which means the order will stay active and be processed once WMT shares reach
or exceed your limit price. (*Note: We could have set Term to be "Day Order", which means the order
would expire at the end of the current trading day if the order does not
execute).
As you can see, the use
of limit sell orders is very useful if you wish to sell a stock at a specific
target price, but are unwilling or unable to regularly check intraday or
daily closing prices of the stock. Also, an added advantage of using limit sell orders is that they remove the
emotional component of making trading decisions. Too often, investors will be tempted to hold on to a winning stock
even once it becomes overpriced. Submitting a limit sell order immediately
after you buy the stock is a good time to avoid any emotional complications,
allowing you to better maintain your strategy and realize superior long-term
returns.
Similarly, limit buy orders are equally useful. You can enter a limit buy order with a
certain limit price, which allows you to buy a set number of shares only if
the stock's market price equal to, or lower than, the maximum limit price you
entered. In our example portfolio we purchased WMT for $70.35/share with
a market buy order. But perhaps we thought WMT was a bit overpriced at the
time, so we could have used a limit buy order to purchase 100 shares only if
WMT fell to $65.00/share or less. That way, we only buy at a price we believe
is fair. If WMT does not fall to $65, the order will not be processed.
3. Stop loss order: A
stop loss order gives your broker a price trigger that protects you from a
big drop in a stock.
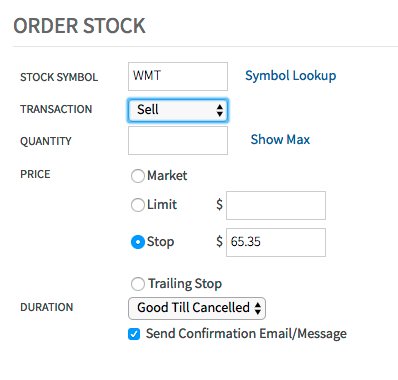 (www.investorpedia.com)
Essentially, a stop order
is "dormant" until a stock's price falls to the specified
"stop price". In other words, a stop order is an instruction to
your brokerage to buy (or sell) a specified number of shares of a company
when the prevailing market price is equal or higher than (or, in the case of
a sell stop order, equal or lower than) the specified price that you
submitted. In our example portfolio, we purchased shares of Google Inc (Nasdaq: GOOG)
for $463.18 per share. Many investors
use a sell stop order to limit their losses, meaning that they'll
automatically sell if a stock goes down a certain percentage.
Entering a stop order
is an efficient and cost-effective means of limiting losses by avoiding the
agony of regularly checking your stock and deciding whether to hold or sell
it. For instance, if a
so-called growth stock has headed south, an investor may choose to hold,
hoping the share price might rebound, but if it doesn't, losses can quickly
mount.
4.
Short selling:
For class discussion: Pro and cons of short selling?
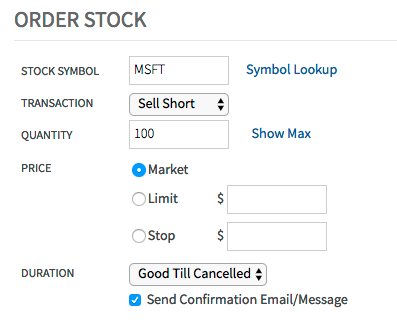 (www.investorpedia.com)
As you can see, short selling follows the conventional investing principle of “buying low” and
“selling high” but with one critical difference – the sequence of the buy and
sell transactions. While the
buy transaction precedes the sell transaction in conventional “long only”
investing, in short selling, the sell transaction precedes the buy
transaction.
When you short sell, you create a short position or a shortfall. A short position represents a binding
obligation that must be closed or covered at some point. This “short covering” obligation gives
rise to one of the biggest risks of short selling, as discussed later in this
tutorial.
Short selling is also known as "shorting,"
"selling short" or "going short." To be short a security or asset implies that one is bearish on it and
expects the price to decline. Short selling has also spawned some of the
most colorful terms in the investment lexicon.
Short selling can be used for speculation or hedging. Speculators use short selling to
capitalize on a potential decline in a specific security or the broad market.
Hedgers use the strategy to protect gains or mitigate losses in a security or
portfolio. Note that institutional investors and savvy individuals frequently
engage in short selling strategies simultaneously for both speculation and
hedging. Hedge funds are among the
most active short sellers, and often use short positions in select stocks or
sectors to hedge their long positions in other stocks.
Short sellers are often portrayed as cynical, hardened
individuals who are bent on making profits by driving the companies that are
their “short” targets to failure and bankruptcy. The reality, however, is
that short sellers facilitate smooth
functioning of the markets by providing liquidity, and also act as a
restraining influence on investors who may be prone to chase overhyped
stocks, especially during periods of irrational
exuberance.
Short selling is
viewed by many investors as an inordinately dangerous strategy, since the long-term
trend of the equity market is generally upward and there is theoretically no
upper limit to how high a stock can rise. But under the right circumstances,
short selling can be a viable and profitable investment strategy for
experienced traders and investors who have an adequate degree of risk
tolerance and are familiar with the risks involved in shorting.
Example:
Let's say XYZ's current ask price is
53. You place an order to buy at a limit price of 50. If the price of the
security falls to 50, your order may be executed. If you had placed a limit
order to buy at 53 or above, your order would have been
"marketable" and executed right away.
In Class Exercise part I
Multiple Choices
1. A trading order
that immediately purchases stock at the prevailing price is called a:
a. stop-loss order
b. limit order.
c. market
order.
(DEFINITION of 'Stop-Loss Order': An order placed with a broker to
sell a security when it reaches a certain price. A stop-loss order
is designed to limit an investor’s loss on a position in a security. Although
most investors associate a stop-loss order only with a long position, it can
also be used for a short
position, in which case the security would be bought if
it trades above
a defined price. A stop-loss order takes the emotion out of trading decisions
and can be especially handy when one is on vacation or cannot watch his/her
position. Also known as a “stop order” or “stop-market order.”) video: http://www.investopedia.com/terms/s/stop-lossorder.asp )
2. A trading order that
immediately purchases stock or is completely cancelled is called a:
a. stop-loss order.
b. fill-or-kill
limit order.
c. market order.
d. open order.
(DEFINITION of 'Fill
Or Kill - FOK': A type of
time-in-force designation used in securities trading that instructs a brokerage to
execute a transaction immediately and completely or not at all. This type
of order is most likely to be used by active traders and
is usually for a large quantity of stock. The order must be filled in
its entirety or canceled (killed). The purpose of a fill or kill order is to
ensure that a position is entered at a desired price.)
(Definition of ‘Open Order’: A type of order to buy or sell a
security that remains in effect until it is either canceled by the customer,
until it is executed or until it expires. Open orders commonly occur when
investors place restrictions on their buy and sell transactions. A lack of
liquidity in the market or for a particular security can also cause an order
to remain open. )
3. A trading
order that is canceled unless executed within a designated time period is
called a
a. stop-loss order.
b. limit order.
c. market order.
d. fill
or kill order.
4. Limit
orders:
a. specify a certain price at which a market order takes
effect.
b. specify a
particular price to be met or bettered.
c. are executed at the best price available.
d. are orders entered for a particular day.
5. A
market order is an instruction to:
a) immediately buy a
security at the current bid price.
b) buy if the market price at least reaches the specified
price target.
c) sell at or above a specified price target.
d) none of these.
Part
III: IPO, SEO, Primary Market and Secondary Market
What is an IPO | by Wall Street Survivor (video)
What is an IPO? | CNBC Explains (video)
A lesson from Facebook -- avoid IPOs - MoneyWeek
Investment Tutorials
IPO market’s drastic 2022
slowdown: What it means for banks (CNBC, video)
Only
22% of new public companies became profitable in 2021 as the IPO market
stalls (CNBC, video)
Porsche’s $84 billion IPO valuation is double
Ferrari’s market cap (CNBC, video)
For class discussion:
1. What is
IPO? SEO? Who are the major participants?
2. What is the primary market?
What is the secondary market? Who are the major participants in these markets?
3. Shall a company go public?
What is your opinion?
4. Is investing in an IPO a
good idea in 2022? In 2023?
IPO Calendar
This Week (http://www.marketwatch.com/tools/ipo-calendar)


In Class Exercise part II
Multiple Choices
1. The market for equities is predominantly a:
a. primary market.
b. market dominated
by individual investors.
c. secondary market.
d. market dominated
by foreign investors.
2. Primary markets:
a. involve the organized
trading of outstanding securities on exchanges.
b. involve the
organized trading of outstanding securities in the over-the-counter market.
c. involve the
organized trading of outstanding securities on exchanges and over-the-counter
markets.
d. are where new issues (IPOs) are sold by corporations
to raise new capital.
Part IV: NASDAQ
vs. NYSE
Top 7 Differences Traders Should
Know
What is the difference between NYSE and NASDAQ? (video)
NYSE vs NASDAQ - who has more "mega cap"
listings? (video)
Dec 10, 2018 6:47 AM -05:00, Ben
Lobel, Markets Writer
https://www.dailyfx.com/nas-100/NASDAQ-vs-NYSE.html
NASDAQ and the New York Stock
Exchange (NYSE) are the two largest stock exchanges in the world, providing a
platform for trading securities. But while they share similarities in their
considerable size and purpose, they are very different markets.
Understanding the differences
between Nasdaq and NYSE can shed light on how stock market trading works.
NYSE and NASDAQ are the biggest
stock exchanges in the world
WHAT ARE THE DIFFERENCES BETWEEN
NASDAQ AND NYSE?
The main difference between
Nasdaq and NYSE is their markets. Nasdaq
is a dealer’s market, with participants trading through a dealer rather than
directly with each other, while NYSE is an auction market, which enables
individuals to transact between each other on an auction basis.
Other differences include the
location of the transactions, how traffic is controlled, and the types of
companies listed – all of which are explored in more depth in the sections
below.
The formats that Nasdaq and NYSE
take – dealer’s market and auction market respectively – represent a
fundamental difference between the way they operate. An auction market, as run by NYSE, is a system based on buyers and
sellers entering competitive bids at the same time. The price at which a
stock is traded reflects the highest price that a buyer is willing to pay,
and the lowest price a seller is willing to accept. Matching bids and offers
are then paired together with the orders executed by the ‘specialist’ (see
‘Traffic Control’ below).
However,
a dealer’s market, as run by Nasdaq, is a type of market where multiple
dealers post prices at which they will buy or sell a specific stock. In a
dealer’s market, a dealer is designated as a market maker – a member firm or
market participant such as a brokerage company or bank – that actively buys
and sells stocks on behalf of traders. Market makers can enable the process
of matching up buyers and sellers to be a lot quicker, maintaining liquidity
and ensuring an efficient trading process.
Location of Transactions
While both institutions are based
in New York City, the location of transactions for trading on Nasdaq and on
the NYSE are very different. NYSE
retains a physical trading floor, although many of the transactions occur at
its data center in Mawah, New Jersey.
However, as an electronic
exchange, Nasdaq does not have a physical trading floor and operates through
direct trading between investors and the market makers. While Nasdaq trading originally took place over a computer bulletin
board system, now automated trading systems offer the benefit of daily
trading volumes and full reports on trades.
Traffic Control
Traffic controllers, in essence,
connect buyers and sellers, but their role differs between Nasdaq and NYSE.
At each exchange, they are responsible for dealing with traffic problems and
ensuring their markets run effectively. However, Nasdaq’s traffic controller, known as the ‘market maker’, actively
buys and sells stocks on behalf of traders, while the NYSE’s traffic
controller, known as the ‘specialist’, facilitates the market for buyers and
sellers through setting opening prices for stocks, accepting limit orders,
and moderating interest for particular stocks.
The two roles are, on paper,
different in that Nasdaq’s market maker effectively creates a market, while
NYSE’s specialist simply facilitates it. However, both roles have the same
goal of enabling a smooth and orderly market for clients.
It is worth noting that
approximately 40% of the volume traded
on the Nasdaq is done through an electronic communications network (ECN),
which is an automatic system for directly matching buyers and sellers. On the
NYSE, only 7% of the volume is done via an ECN, but that could change with
evolution towards a hybrid system of humans and machines.
Types of Companies Listed
When it comes to the listings on
Nasdaq and NYSE, the NYSE trades
stocks for around 2,800 companies, while Nasdaq has more than 3,300 listings.
The NASDAQ-100 features 100 of
the largest publicly-traded businesses, based on market capitalization, but Nasdaq’s wider exchange features many
small and micro-capitalization stocks also.
Listing Requirements
Listing requirements differ
between Nasdaq and NYSE. Nasdaq
listing requirements mean that companies must have at least 1,250,000 shares
available for the public to trade, while companies listing on NYSE must have
issued a minimum of 1,100,000 to at least 400 shareholders. Other differences
include fees; for companies looking to list on the NYSE the entry fee goes up
to $500,000, while for Nasdaq, the entry fee ranges from $50,000 to $75,000,
with a yearly fee of around $27,000.
Additionally,
there is a minimum share price of $4 for NYSE-listed companies and the market
value of the company’s public shares must be at least $40 million. For a
listing on Nasdaq, companies must have a minimum of three dealers for its
stocks.
Perception of Stocks
The general perception of the
stocks on Nasdaq and NYSE is that the more volatile trades are to be found on
Nasdaq. This is because long-established,
stable companies are more often found on the NYSE, with examples ranging
from Coca Cola to Citigroup, IBM and Walmart. The Nasdaq, on the other hand, has more of a reputation for listing
fast-growth tech businesses with potentially more scope for dramatic price
movement. Stocks to be found on Nasdaq include Facebook, Apple, Google
and Amazon.
Private vs Public
The ownership structure of each
exchange used to be different to how it is today. Formerly, Nasdaq was listed
as a publicly-traded corporation, while the NYSE was private. However, in
March 2006, the NYSE went public, making its shares available to traders on
an exchange. Traders can bet on Nasdaq and NYSE through the Nasdaq and NYSE
platforms respectively.
HOW TRADERS CAN USE THE
DIFFERENCES BETWEEN NASDAQ AND NYSE TO THEIR ADVANTAGE
In summary, when choosing which
stock markets to go for as a trader, you might consider the following:
- Volatility: If
you’re looking for stocks with the potential for rapid price movements,
you may find more opportunities on Nasdaq. On the other hand, NYSE
offers shares that are generally more established and stable.
- Nature of trading: If you want to trade through floor brokers, you will have that option with NYSE, while Nasdaq offers electronic trading. Products offered by both can be traded via third-parties, ECNs, and derivatives.
Indices
·
NASDAQ
indices include the NASDAQ Composite, NASDAQ-100, and NASDAQ Biotechnology.
· Indices on the NYSE include the Dow Jones Industrial Average and NYSE Composite.
·
Other indices, like the S&P 500 and Russell 1000, include stocks listed on both
exchanges.


https://www.diffen.com/difference/NASDAQ_vs_NYSE
Experience Wall Street Stock Trading In The 1980s
(optional)
Homework
( DUE with first midterm exam)
1)
What are the
differences between market order and limit order?
2)
What is short selling
stock? How to short sell a stock?
3)
Check three stocks
listed above in the IPO table.
·
Follow these stocks
and report their performances one month after the IPO.
·
Summarize your
findings.
4)
What are the major
differences between NYSE and NASDAQ?
Robinhood will give retail investors
access to IPO shares https://www.cnbc.com/2021/05/20/robinhood-will-give-retail-investors-access-to-ipo-shares-a-longstanding-wall-street-dominion.html
PUBLISHED
THU, MAY 20 2021 11:44 AM EDTUPDATED THU, MAY 20 20211:34 PM EDT Maggie
Fitzgerald
Robinhood said it is
giving retail investors access to IPO shares. Retail traders typically don’t
have a vehicle to buy into newly listed companies until those shares begin
trading on an exchange. Robinhood will
not be an underwriter for companies
hitting the public markets but the stock trading company will get an
allocation of shares by partnering with investment banks.
It is unclear if
Robinhood clients will be able to invest in Robinhood’s pending market debut.
IPO
shares have historically been set aside for Wall Street’s institutional
investors or high-net worth individuals. Retail traders typically don’t have
a vehicle to buy into newly listed companies until those shares begin trading
on an exchange, which is often after the share price has surged.
“We’re starting to roll out IPO Access, a new product that will give you the
opportunity to buy shares of companies at their IPO price, before trading on
public exchanges. With IPO Access, you can now participate in upcoming IPOs
with no account minimums,” Robinhood said in a blog post Thursday.
Robinhood will not be
an underwriter for companies hitting the public markets but will get an
allocation of shares by partnering with investment banks. This move is
Robinhood’s latest to antagonize Wall Street. IPO stock pops on the first day averaged 36% in 2020, according
to Dealogic, demonstrating individual investor thirst for some of these
popular names that is not priced into IPO pricing. These are gains the little
guy is missing out on.
The traditional IPO
process has been criticized in recent years as being broken, with investment
banks allotting the shares to big clients who reap the instant first-day
gains. Going public by way of direct listing has combated some of these
criticisms.
Using
IPO Access, Robinhood clients will be able to request to buy shares at their
initial listing price range. When the final price is set, clients will be able to go through with
the purchase, change or cancel.
“We currently anticipate that up to 1.0% of
the shares of Class A common stock offered hereby will, at our request, be
offered to retail investors through Robinhood Financial, LLC, as a selling
group member, via its online brokerage platform,” Figs said in its S1 filing
document.
“This is the first initial
public offering to be included on the Robinhood platform and there may be
risks associated with the use of the Robinhood platform that we cannot
foresee, including risks related to the technology and operation of the
platform, and the publicity and the use of social media by users of the
platform that we cannot control,” the company added.
The IPO date isn’t
set, but companies typically go public one to months after their S1
prospectus is filed with the SEC.
It is unclear if
Robinhood clients will be able to invest in Robinhood’s pending IPO. The
stock trading app is expected to go public in the first half of 2021 and has
filed confidentially with the SEC.
IPO Access will be
rolled out to all clients over the next few weeks.
Robinhood’s
IPO product comes on the heels of record levels of new, younger traders
entering the stock market during the pandemic.
That surge has continued into 2021, marked by frenzied trading around
so-called meme stocks like GameStop.
Online finance
start-up SoFi made a move similar to Robinhood’s in March; however, Sofi will
be an underwriter for its offered IPOs.
https://robinhood.com/us/en/support/articles/ipo-access/
For discussion:
·
What advantage to
buy pre-IPO shares?
·
What risks are
associated with it?
IPO Market Faces Worst Year in Two Decades.
‘Really Hard Pill to Swallow.’
Inflation, rising
interest rates and Russia’s invasion of Ukraine sent shock waves through the
stock market, putting a freeze on the IPO pipeline
By Corrie Driebusch
Aug. 22, 2022 11:19 am ET
https://www.wsj.com/articles/ipo-market-faces-worst-year-in-two-decades-startups-11661181427
The IPO market is on pace for its worst year in decades, leaving
fledgling companies with few options but to burn through cash while they wait
for the stock market to calm.
Late last year,
hundreds of companies were in the final stages of preparing to go public,
encouraged by the best 18 months ever for U.S. initial public offerings. Then a combination of
factors—sky-high inflation, rising interest rates and Russia’s invasion of
Ukraine—sent shock waves through the stock market.
The IPO pipeline froze. So far this year, traditional IPOs have
raised only $5.1 billion all told, Dealogic
data show. Typically at this point in the year, traditional IPOs have raised around
$33 billion, according to Dealogic data
that goes back
The last time levels were this low was 2009, when the U.S. was
recovering from the depths of the financial crisis and the IPO market
reopened near the end of the year.
IPO advisers say they don’t expect 2022 to follow that pattern,
meaning it could end up being the worst year for raising money in IPOs since
Dealogic, a research firm, started tracking it in 1995.
Fintech firm Klarna Bank AB was a highly anticipated 2022 IPO,
but instead of making a splashy debut, the Sweden-based company laid off
hundreds of workers to cut costs and was forced to seek funding in private
markets. Klarna, which specializes in
buy-now-pay-later services, managed to raise $800 million this summer—but
only after cutting its valuation by 85% to $6.7 billion.
That valuation is
still three times the level Klarna was valued three years ago, a Klarna
spokeswoman said.

StockX, an online
marketplace that sells sneakers, streetwear and other items, had planned to
go public as early as the second half of 2021, people familiar with the
matter told The Wall Street Journal last year. But StockX has yet to file IPO
paperwork. In June, the company laid off 8% of its workforce. The company
declined to comment.
Fewer companies going
public is typically viewed as bad news for the economy and investors.
An IPO, especially when a
company is younger with more room to grow, can allow more small investors to
benefit from future gains. Publicly traded firms must register with regulators and provide
more transparency around their finances. Big-name IPOs are typically the
kinds of high-growth companies that helped the stock market rise for a decade
after the financial crisis.
Bankers and lawyers
who work on IPOs said companies that decide to brave a fall or early winter
stock-market debut this year may need to halve their valuations after two
years of roaring markets where private investors plowed cash into
money-losing companies at sky-high valuations.
Top IPO lawyers say
they are “pencils down” for almost all their expected deals this year, and
that some companies looking to 2023 IPOs are pushing off hiring bankers.
Denny Fish, a
portfolio manager at Janus Henderson Investors, typically buys shares of
growth companies in their IPOs. He said he doesn’t plan to participate in any
IPOs until 2023 at the earliest. “It might feel a little better because the
market has bounced in July, but there’s still so much uncertainty,” Mr. Fish
said. “There’s just not a market for companies coming public right now.”
As of Friday, the
tech-heavy Nasdaq Composite was down 19% in 2022. That’s up from its mid-June
trough, when the index was trading off more than 30% for the year.
Notable
cryptocurrency startups, food-delivery companies and financial-technology
firms are among the companies that had planned 2022 IPOs. As time passes and
their cash reserves diminish, companies may need to tighten their belts as
financing gets tougher.
Some, such as
rapid-delivery startup Gopuff, are cutting costs by laying off workers.
Grocery-delivery company Instacart Inc. and payments company Stripe Inc. have
slashed their private valuations. Others have had to raise new money at steep
discounts to prior financing rounds.
Many fund managers
agree with Mr. Fish. Those who bought stock in the blockbuster IPOs in 2020
and 2021, including trading platform Robinhood Markets Inc., HOOD 2.93%▲
electric-vehicle maker Rivian Automotive Inc. and restaurant-software
provider Toast Inc., TOST 3.92%▲ are saddled with big losses.
Even though the IPO market isn’t healthy right now, many
companies still have a burning desire to go public, bankers say. Some need
the cash. Others are running against a ticking clock for restricted stock
units issued to employees through vesting plans. And some are eyeing
acquisitions but need stock or money to complete offers.
“I don’t think a
lot of companies that are private right now expected they’d be private by
now,” said Barrett Daniels, U.S. IPO co-leader at accounting firm Deloitte
LLP.
He said companies
that need money, especially founder-led firms, may struggle with the lower
valuations their companies might now command. “It’s a really, really hard
pill to swallow. Going backwards is hard to compute,” he said.
There are a handful
of companies determined to go public in 2022, people familiar with the matter
said, including Intel Corp.’s INTC 0.96%▲ self-driving car unit
Mobileye, Instacart, and American International Group AIG 2.56%▲
spinoff Corebridge Financial.
Other offerings,
including SoftBank Group Corp.’s Arm, a chip-design specialist, following its
failed sale to Nvidia Corp., are expected within the first few months of
2023, people familiar with the matter say.
There are many
reasons for the IPO drought. Late last year, fears of inflation and
subsequent Federal Reserve rate increases spooked investors who put money
into companies that promised big growth but have little or no current
profits. High-growth companies sold off and inflation fears accelerated, with
many analysts warning of a coming recession, driving shares of profitable
companies lower, too. The economy contracted at an annualized rate in two
consecutive quarters, a common definition of a recession, and volatility
climbed.
Meanwhile, IPO advisers
and investors agree the IPO playbook is changing: They say the first companies to go
public after the markets calm down should be profitable, fairly large, and
“must own” names—companies that are well-known and leaders in their specific
industry.
Many private
companies are taking note. Thanks in part to cost-cutting, Instacart, for
example, was profitable in the second quarter of this year under generally
accepted accounting principles, according to a person familiar with the
matter. Revenue for Instacart during the three months ended in June climbed
39% from the year-earlier period to $621 million, investors told The Wall
Street Journal, the highest quarterly revenue in Instacart’s history.
Though some
companies including Klarna were forced to face a sharp valuation cut because
they needed to raise more money, many others aren’t hurting for cash yet,
because they raised a lot in 2021 before the market turned. Last year, U.S.
venture-backed companies raised nearly $330 billion, almost double the previous
record raised in 2020, according to research company PitchBook.
Although the stock
market is bouncing back and some secondary stock offerings have performed
well, bankers fear what a poor showing by a new issue could do to the IPO
market.

In May, Bausch + Lomb Corp.
went public when virtually no one else was doing so, and investors were
largely uninterested. The eye-care company priced its stock at $18 a share,
far below its expectations. It commanded a valuation of about $6.3 billion,
less than half of what the company had been hoping to reach just months
earlier, people familiar with the
matter said. A company spokeswoman declined to comment. Now the stock trades
around $15.50 a share.
American Stock Exchange (AMEX)
By JAMES CHEN Updated
October 13, 2020, Reviewed by GORDON SCOTT
https://www.investopedia.com/terms/a/amex.asp
Quick Guide To The AMEX: American Stock Exchange [Episode 182]
What Is the American Stock Exchange (AMEX)?
The American Stock Exchange (AMEX) was once the third-largest
stock exchange in the United States, as measured by trading volume. The
exchange, at its height, handled about 10% of all securities traded in the
U.S.
Today, the AMEX is known as the NYSE American. In 2008, NYSE
Euronext acquired the AMEX. In the subsequent years, it also became known as
NYSE Amex Equities and NYSE MKT.
KEY TAKEAWAYS
·
The American Stock
Exchange (AMEX) was once the third-largest stock exchange in the U.S.
·
NYSE Euronext acquired
the AMEX in 2008 and today it is known as the NYSE American.
·
The majority of trading on the NYSE
American is in small cap stocks.
·
The NYSE American uses market makers to
ensure liquidity and an orderly marketplace for its listed securities.
Understanding the American Stock Exchange (AMEX)
The AMEX developed a reputation
over time as an exchange that introduced and traded new products and asset
classes. For example, it launched its options market in 1975. Options are a
type of derivative security. They are contracts that grant the holder the
right to buy or sell an asset at a set price on or before a certain date,
without the obligation to do so. When the AMEX launched its options market,
it also distributed educational materials to help educate investors as to the
potential benefits and risks.
The AMEX used to be a larger competitor of the New York Stock
Exchange (NYSE), but over time the Nasdaq filled that role.
In 1993, the AMEX introduced the first exchange traded fund
(ETF).
The ETF, now a popular investment, is a type of security that tracks an index
or a basket of assets. They are much like mutual funds but differ in that
they trade like stocks on an exchange.
Over time, the AMEX gained the reputation of listing companies
that could not meet the strict requirements of the NYSE. Today, a good
portion of trading on the NYSE American is in small cap stocks. It operates
as a fully electronic exchange.
History of the American Stock Exchange (AMEX)
The AMEX dates back to the
late 18th century when the American trading market was still developing. At
that time, without a formalized exchange, stockbrokers would meet in
coffeehouses and on the street to trade securities. For this reason, the AMEX
became known at one time as the New York Curb Exchange.
The traders who originally
met in the streets of New York became known as curbstone brokers. They
specialized in trading stocks of emerging companies. At the time, many of
these emerging businesses were in industries such as railroads, oil, and
textiles, while those industries were still getting off the ground.
In the 19th century, this
type of curbside trading was informal and quite disorganized. In 1908, the
New York Curb Market Agency was established in order to bring rules and
regulations to trading practices.
In 1929, the New York Curb
Market became the New York Curb Exchange. It had a formalized trading floor
and a set of rules and regulations. In the 1950s, more and more emerging
businesses began trading their stocks on the New York Curb Exchange. The
value of companies listed on the exchange almost doubled between 1950 and
1960, going from $12 billion to $23 billion during that time. The New York
Curb Exchange changed its name to the American Stock Exchange in 1953.
Special Considerations
Over the years, the NYSE American has become an attractive
listing place for younger, entrepreneurial companies, some of whom are in the
early stages of their growth and certainly not as well-known as blue chip
companies. Compared to the NYSE and Nasdaq, the NYSE American trades at much
smaller volumes.
Because of these factors, there
could be concerns that investors would not be able to quickly buy and sell
some securities in the market. To
ensure market liquidity—which is the ease at which a security can be converted to cash
without impacting its market price—the NYSE American offers electronic designated market makers.
Market makers are individuals or firms that are available to
buy and sell a particular security as needed throughout the trading session.
These designated market makers have quoting obligations for specific NYSE
American-listed companies. In return for making a market for a security,
market makers earn money through the bid-ask spread and from fees and
commissions. So, despite the fact that the NYSE American is a smaller-volume
exchange specializing in listing smaller companies, its use of market makers
enables it to maintain liquidity and an orderly market.
Chapter 4: Future value, Present Value, and
Interest Rate
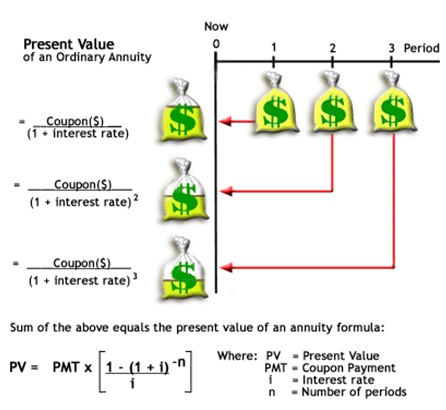
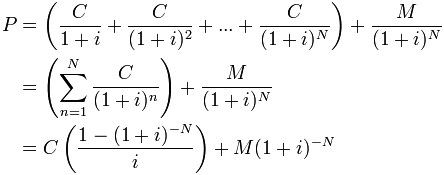
Example1: A 5 year, 5%
coupon bond, currently provides an annual return of 3%. Calculate the price
of the bond.
Example 2: Your cousin is
entering medical school next fall and asks you for financial help. He needs
$65,000 each year for the first two years. After that, he is in residency for
two years and will be able to pay you back $10,000 each year. Then he
graduates and becomes a fully qualified doctor, and will be able to pay you $40,000
each year. He promises to pay you $40,000 for 5 years after he graduates. Are
you taking a financial loss or gain by helping him out? Assume that the
interest rate is 5% and that there is no risk.
Homework
(just write down the PV equations – Due with the first mid term exam): Solution
FYI
1. The Thailand Co.
is considering the purchase of some new equipment. The quote consists of a
quarterly payment of $4,740 for 10 years at 6.5 percent interest. What is the
purchase price of the equipment? ($138,617.88)
2. The condominium
at the beach that you want to buy costs $249,500. You plan to make a cash
down payment of 20 percent and finance the balance over 10 years at 6.75
percent. What will be the amount of your monthly mortgage payment? ($2,291.89)
3. Today, you are
purchasing a 15-year, 8 percent annuity at a cost of $70,000. The annuity
will pay annual payments. What is the amount of each payment? ($8,178.07)
4. Shannon wants to
have $10,000 in an investment account three years from now. The account will
pay 0.4 percent interest per month. If Shannon saves money every month,
starting one month from now, how much will she have to save each month? ($258.81)
5. Trevor's Tires is
offering a set of 4 premium tires on sale for $450. The credit terms are 24
months at $20 per month. What is the interest rate on this offer? (6.27
percent)
Summary of math and excel equations
Math Equations
FV = PV *(1+r)^n
PV = FV / ((1+r)^n)
N = ln(FV/PV) / ln(1+r)
Rate = (FV/PV)1/n -1
Annuity: N
= ln(FV/C*r+1)/(ln(1+r))
Or N = ln(1/(1-(PV/C)*r)))/
(ln(1+r))
EAR = (1+APR/m)^m-1
APR = (1+EAR)^(1/m)*m
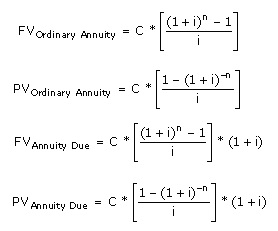
First Mid Term Exam
– close book, close notes, 9/20, in
class
Study Guide (Truel and
False, multiple choice questions)
1.
What are the six parts of the financial markets
2.
What are the five core principals of finance
3.
Why do we need stock exchanges?
4.
What is high frequency trading? pros and cons? What is spoofing?
5.
What is flash crash? How does it make investors so worried? How
can HFT trigger flash crash?
6.
What is NFT? What is metaverse? What is blockchain?
7.
What is bitcoin?
What is Dogecoin? In your view, could bitcoin become a major global
currency?
8.
Could cryptocurrency put banks out of business?
9.
What is CBDC?
10.
What could happen if we increase money
supply? What about decrease money supply? What
is QE?
11.
What is M0? MB? M1? M2? M3?
12.
Why M2 is >> M0? Why M2>>M1?
13.
What is money multiplier?
14.
What is money velocity?
15.
“In a fractional reserve banking system, banks create money when
they make loans.
16. Bank reserves
have a multiplier effect on the money supply.” This sentence is right or
wrong? Please provide your rational
17. Imagine that
you deposited $1,000 in Bank A. Imagine that the fractional banking system is
fully functioning. After five cycles, what is the amount that has been
deposited and what is the total amount that has been lent out?
18. As an investor,
besides market order, what other types of orders can use choose from? Show
definitions and examples.
19. What is short
sell? Do you think that short Apple stock is a good idea? Why or why not?
What about short GameStop? Short Tesla?
20. What is IPO?
Why shall you buy stocks pre-IPO shares?
21. Compare primary
market vs. secondary market.
22. Time value of
money questions – show math equations only. No need of excel or calculator.
23. In your view,
what might trigger the next financial crisis? Why?
24. Compare NYSE
with NASDAQ.
25. What is AMEX?
26. What is QE?
27. Order type:
limit order, market order, short sell, stop loss
28. What is money
market?
Chapter 6 Bond Market
1. Cash flow of bonds

The above graph shows the cash flow of
a five year 5% coupon bond.
http://finra-markets.morningstar.com/BondCenter/Default.jsp
For example: a 3 year bond 10% coupon rate, draw its cash flow.
How Bonds Work (video)
2. Risk of Bonds
Class discussion: Is bond market risky?
Bond risk (video)
Bond risk –
credit risk (video)
Bond risk –
interest rate risk (video)
Bond risk – how
to reduce your risk (video)
3. Choices of investment in bonds
FINRA – Bond market information
http://finra-markets.morningstar.com/BondCenter/Default.jsp
Treasury Bond Auction and Market information
http://www.treasurydirect.gov/
Treasury Bond
Corporate Bond
Municipal Bond
International Bond
Bond Mutual Fund
TIPs
Class
discussion Topic I: TIPS
·
As a college student, which type of bonds shall
you buy? Why?
·
Looking forward, inflation might be a threat to
the economy. How can you hedge the inflation risk with bonds?
Treasury
Inflation Protected Securities (TIPS)
Brian O'Connell, reviewed By Benjamin Curry, May 24, 2022
https://www.forbes.com/advisor/investing/treasury-inflation-protected-securities-tips/
Treasury
Inflation Protected Securities (TIPS) are bonds issued by the U.S. government
that offer protection against inflation, in addition to modest interest
payments.
“For investors who
prioritize preserving the purchasing power of their cash, TIPS can help
mitigate the impact of unexpectedly high inflation,” says
Wes Crill, head of investment strategists at Dimensional Fund Advisors in Austin,
Texas.
How Do TIPS
Work?
TIPS are fixed
income securities that work similarly to other treasury bonds. When you buy
TIPS, you’re purchasing debt issued by the U.S.
government. You get regular interest payments on the par value of the
securities, and you get your principal back when the TIPS reach maturity.
What’s special is that TIPS include a special mechanism that
provides inflation protection. Each
year, the U.S. Treasury adjusts the par value of TIPS based on the Consumer
Price Index (CPI), a measure of inflation.
This TIPS
feature helps preserve the purchasing power of your investment. The value of
ordinary bonds, which typically feature fixed par values, may be eroded over
time by gains in inflation.
“Indexing the bond’s value to inflation helps
protect investors from an erosion in purchasing power,”
says Crill. Regardless of how much prices change over the term of your TIPS
investment, you maintain the purchasing power of the cash you invested—plus interest payments.
What’s more, interest payments are also adjusted for inflation
each year. While the interest rate remains constant over the duration of your
TIPS, the interest payment you receive every six months is based on your TIPS’ current par value, meaning they effectively increase with
CPI inflation.
Note that deflation will
reduce the par value of TIPS. It’s a very rare
phenomenon, but the value and interest payments of your TIPS could be
adjusted downward to reflect negative CPI rates. That said, you never receive
less than the original par value of the TIPS upon maturity.
TIPS and Taxes
As with most investments, TIPS
earnings are subject to taxes, at least on the federal level. Earnings are generally exempt from state
and local taxes. However, you have to be careful with TIPS because their
earnings encompass their interest payments and any inflation adjustments that
increase their par value.
“In any year when the
principal value of a TIPS bond increases due to the inflation adjustment,
that gain is considered reportable income for the year, even though the
investor won’t receive the inflation-adjusted
principal until the security matures,” says
Robert Johnson, professor of finance at Heider College of Business at
Creighton University.
If you don’t plan for this in advance,
this may create a small unexpected tax burden, as you won’t
have received the updated par value back yet but are still expected to pay
income taxes on it.
In the event that deflation occurs, reducing the par value of
TIPS, you may be able to use it to offset other income gains. You generally
will only be able to do this if the adjustment exceeds the amount of TIPS
interest you earned that year. Speak with a tax professional to determine how
TIPS may affect your taxes.
Advantages of TIPS
For inflation-conscious investors, TIPS have some big
advantages.
Easy Inflation
Insurance
TIPS can provide
an easy way to engineer an inflation hedge in your portfolio. “This is particularly important for
more conservative or income-focused investors,” like
those in retirement often are, says Matt Dmytryszyn, director of investments
at Telemus, an investment advisory firm in Southfield, Mich.
In high-inflation environments, TIPS performance may greatly
exceed that of traditional government bonds, whose fixed interest payments
effectively become smaller over time.
Backed by the
Full Faith and Credit of Uncle Sam
While many investments may outperform inflation over time, TIPS
are the only one guaranteed to do this that also have all of the benefits of
standard Treasury bonds.
“They’re supported by the full faith and
credit of the U.S. government and are traded in a deep and very liquid
market,” says Frederick Miller, founder of Sensible
Financial Planning and Management, LLC, in Waltham, Mass.
In other words, it’s highly unlikely the
U.S. government will fail to pay you back—that hasn’t happened yet in U.S. history—and,
should you need to sell your TIPS
before their term ends, you should be able to do so relatively easily. This
makes TIPS great low-risk investments.
Disadvantages of TIPS
TIPS aren’t without their disadvantages.
Here are a few of the risks you might encounter if you invest in TIPS.
Poor performance
during deflation or low inflation.
While TIPS have an
edge over traditional bonds when inflation runs hot, they perform poorly when
deflation strikes or there is low inflations. That’s
because deflation or low inflation drags down their par value, shrinking
interest payments. In these conditions, TIPS fail to keep up with market
interest rates.
Unpredictable cash flow.
Because their payments are dependent on inflation, it’s
hard to estimate in advance what your income might be. This may not be a
huge deal if payments end up being more than expected, but during periods of
lower inflation or deflation, you could end up with less money coming in than
you need.
Anticipatory
taxes.
Because you must
pay income taxes on any increases to par value, you could end up owing “phantom taxes” on money you haven’t actually earned until your TIPS mature. You can combat this by holding your TIPS in tax-advantaged
retirement accounts.
Liquidity.
In general, it’s pretty easy to cash out or resell your U.S. Treasuries
before their maturity date. TIPS don’t trade as much
as other bonds in secondary markets, which may make it harder to sell yours
quickly. During periods of unstable
inflation, you also may end up selling your TIPS at a loss, especially if
their par value has been adjusted to lower than what you paid.
CPI may not
match your personal inflation rate.
TIPS are tied to CPI, and if your spending habits don’t completely align with the averages used to measure CPI,
inflation adjustments may not compensate you for your spending patterns. “The CPI is a basket of goods and the composition of each
of our baskets of goods will vary in some way from the composition CPI
basket,” says Dmytryszyn. TIPS may not keep up with
your personal rate of inflation.
How to Buy TIPS
You can buy TIPS
through your online brokerage account or directly from the U.S. Treasury at
TreasuryDirect.
If you choose to buy TIPS on the secondary market, be sure to
compare how much the current inflation-adjusted par value differs from the
original par value. Remember: You are only guaranteed to receive payment up
to the original face value of a TIPS. If its price is above the issue price,
you could lose money if deflation drags the par value to less than you paid.
That means you’ll probably only want to buy TIPS on a secondary market if
the current par value is less than the issued par value. Otherwise, your
safest bet may be purchasing TIPS directly from the Treasury.
You can also buy
shares of mutual funds and exchange-traded funds (ETFs) that contain
diversified mixes of TIPS. While buying into a TIPS fund may make certain aspects of TIPS
ownership easier, such as allowing you to reinvest earnings or buy odd-dollar
amounts of shares, keep in mind you’ll be paying
expense ratio fees, which can negatively impact your returns.
Should You Buy
TIPS?
If you’re a safety-minded investor who wants some
government-backed protection against inflation, TIPS can make good sense.
“TIPS matter to Main Street investors because they can help you
protect your buying power from rising inflation,”
says Tom Preston, who spent 30 years as a Wall Street trader and is a market
strategist for Tastytrade, a Chicago-based digital finance and investment
marketplace. “When inflation increases the price of
things you need to buy, the extra return from a TIPS can offset that.”
Before buying your TIPS, though, be sure to compare current bond
yields to expected inflation rates. Because they adjust for inflation, TIPS
interest rates tend to be much smaller than non-TIPS bonds. For instance, if bonds are yielding 3%,
inflation is only 2%, and TIPS interest is 0.5%, you would only expect to
earn the equivalent of 2.5% on your TIPS each year. This could make it an
inferior choice to the non-TIPS Treasury. Conversely, if non-TIPS bonds were
only yielding 2%, TIPS would give you an extra half a percent over
traditional bonds.
According to Raymond James, the average breakeven point has been
around 2.5% since the mid-1990s, meaning a non-TIPS bond must yield at least
that much to hypothetically outperform a TIPS.
Class discussion
Topics II: Junk Bond
·
You can invest in junk bonds. Shall you? Or shall
you not?
·
In a low interest rate economy, is it wise to
invest in high yield bond?
Definition: A high yield bond – also known as a junk bond – is a debt security issued by companies or private equity concerns,
where the debt has lower than investment grade ratings. It is a major
component – along with leveraged loans – of the leveraged finance market.(www.highyieldbond.com)
How to trade high-yield bond ETFs in this market
environment (optional, video)
Everything You
Need to Know About Junk BondsEverything You Need to Know About Junk Bonds
By THE INVESTOPEDIA TEAM
Updated May 17, 2022 Reviewed by CIERRA MURRY
https://www.investopedia.com/articles/02/052202.asp
The term "junk bond" can evoke memories of investment
scams such as those perpetrated by Ivan Boesky and Michael Milken, the junk-bond
kings of the 1980s. But if you own a bond fund today, some of this so-called
junk may have already found its way into your portfolio. And that's not
necessarily a bad thing.
Here's what you need to know about junk bonds.
Like any bond, a junk bond
is an investment in debt. A company or a government raises a sum of money by
issuing IOUs stating the amount it is borrowing (the principal), the date it
will return your money (maturity date), and the interest rate (coupon) it
will pay you on the borrowed money. The interest rate is the profit the
investor will make for lending the money.
KEY TAKEAWAYS
·
Junk bonds have a lower credit
rating than investment-grade bonds, and therefore have to offer higher
interest rates to attract investors.
·
Junk bonds are generally rated
BB[+] or lower by Standard & Poor's and Ba[1] or lower by Moody's.
·
The rating indicates the
likelihood that the bond issuer will default on the debt.
·
A high-yield bond fund is one
option for an investor interested in junk bonds but wary of picking them
individually.
Before it is
issued, every bond is rated by Standard & Poor's or Moody's, the major
rating agencies that are tasked with determining the financial ability of the
issuer to repay the debt it is taking on. The ratings range from AAA (the
best) to D (the company is in default).
The two agencies
have slightly different labeling conventions. AAA from Standard & Poor's,
for example, is Aaa from Moody's.
Broadly speaking, all bonds can be placed in one of two
categories:
Investment-grade
bonds are issued by low-risk to medium-risk lenders. A bond rating on
investment-grade debt can range from AAA to BBB. These highly-rated bonds pay
relatively low interest because their issuers don't have to pay more.
Investors looking for an absolutely sound place to put their money will buy
them.
Junk bonds are
riskier. They will be rated BB or lower by Standard & Poor's and Ba or
lower by Moody's. These lower-rated bonds pay a higher yield to investors.
Their buyers are getting a bigger reward for taking a greater risk.
Think of a bond rating as the report card for a company's credit
rating. Blue-chip firms with solid financials and steady income will get a
high rating for their bonds. Riskier companies and government bodies with
rocky financial histories will get a lower rating.
The chart below shows the bond-rating scales from the two major
rating agencies.

Historically, average yields on junk bonds have been 4% to 6%
above those for comparable U.S. Treasuries. U.S. bonds are generally
considered the standard for investment-grade bonds because the nation has
never defaulted on a debt.
Bond investors
break down junk bonds into two broad categories:
Fallen angels
are bonds that were once rated investment grade but have since been reduced
to junk-bond status because concerns have emerged about the financial health
of the issuers.
Rising stars are
the opposite. The companies that issue these bonds are showing financial
improvement. Their bonds are still junk, but they've been upgraded to a
higher level of junk and, if all goes well, they could be on their way to
investment quality.
Who Buys Junk
Bonds?
The obvious
caveat is that junk bonds are a high-risk investment. There's a risk that the
issuer will file for bankruptcy and you'll never get your money back.
There is a
market for junk bonds, but it is overwhelmingly dominated by institutional
investors who can hire analysts with knowledge of specialized credit.
This does not mean that junk-bond investing is strictly for the
wealthy.
The High-Yield
Bond Fund
For individual
investors who are interested in junk bonds, investing in a high-yield bond
fund can make sense.
You're dabbling
in a higher-risk investment, but you're relying on the skills of professional
money managers to make the picks.
High-yield bond funds also lower the overall risk to the
investor by diversifying their portfolios across asset types. The Vanguard
High-Yield Corporate Fund Investor Shares (VWEHX), for example, keeps 4.5% of
its money in U.S. bonds and 3% in cash while spreading the rest among bonds
rated from Baa3 to C. The Fidelity Capital and Income Fund (FAGIX) keeps
nearly 20% of its money in stocks.
One important note: You need to know how long you can commit
your cash before you decide to buy a junk bond fund. Many do not allow
investors to cash out for at least one or two years.
Also, there is a point at which the rewards of junk bonds don't
justify the risks. You can determine
this by looking at the yield spread between junk bonds and U.S. Treasuries.
The yield on junk is historically 4% to 6% above U.S. Treasuries. If you see
the yield spread shrinking below 4%, it's probably not worth the added risk.
to invest in junk bonds.
One more thing to look for is the default rate on junk bonds.
This can be tracked on Moody's website.
One final warning: Junk bonds follow boom and bust cycles, just
like stocks. In the early 1990s, many bond funds earned upwards of 30% annual
returns. A flood of defaults can cause these funds to produce stunning
negative returns.

https://fred.stlouisfed.org/series/BAMLH0A0HYM2EY
Units: Percent, Not
Seasonally Adjusted
Frequency: Daily, Close
FYI only https://fred.stlouisfed.org/series/BAMLH0A0HYM2EY
This data
represents the effective yield of the ICE BofA US High Yield Index, which
tracks the performance of US dollar denominated below investment grade rated
corporate debt publicly issued in the US domestic market. To qualify for inclusion in the index, securities must have a
below investment grade rating (based on an average of Moody's, S&P, and
Fitch) and an investment grade rated country of risk (based on an average of
Moody's, S&P, and Fitch foreign currency long term sovereign debt
ratings). Each security must have greater than 1 year of remaining maturity,
a fixed coupon schedule, and a minimum amount outstanding of $100 million.
ICE BofA Explains the Construction Methodology of this series
as:
Index
constituents are capitalization-weighted based on their current amount
outstanding. With the exception of U.S.
mortgage pass-throughs and U.S. structured products (ABS, CMBS and CMOs),
accrued interest is calculated assuming next-day settlement. Accrued interest
for U.S. mortgage pass-through and U.S. structured products is calculated
assuming same-day settlement. Cash flows from bond payments that are received
during the month are retained in the index until the end of the month and
then are removed as part of the rebalancing. Cash does not earn any
reinvestment income while it is held in the Index. The Index is rebalanced on
the last calendar day of the month, based on information available up to and
including the third business day before the last business day of the month.
Issues that meet the qualifying criteria are included in the Index for the
following month. Issues that no longer meet the criteria during the course of
the month remain in the Index until the next month-end rebalancing at which
point they are removed from the Index.
The index data
referenced herein is the property of ICE Data Indices, LLC, its affiliates,
("ICE") and/or its Third
Party Suppliers and has been licensed for use by the Federal Reserve Bank of
St. Louis. ICE, its affiliates and Third Party Suppliers accept no liability
in connection with its use.
Copyright, 2017, ICE Benchmark Administration. Reprinted with
permission.
Suggested Citation:
Ice Data Indices, LLC, ICE BofA US High Yield Index Effective
Yield [BAMLH0A0HYM2EY], retrieved from FRED, Federal Reserve Bank of St.
Louis; https://fred.stlouisfed.org/series/BAMLH0A0HYM2EY, September 21, 2022.
Part III: International
Bond
For discussion:
Should you invest in foreign bonds?
Rising Italy bond yields
to test an ECB set to pull rate hike trigger again
By
Dhara Ranasinghe, Tommy Wilkes and Yoruk Bahceli
LONDON, Sept 2 (Reuters) -
Rising borrowing costs in highly-indebted Italy are again testing the
European Central Bank's resolve to contain bond market strain.
Just
days before the ECB is tipped to
deliver a second big interest rate hike to curb record-high inflation,
worries about a more aggressive move have unnerved investors.
Italy's 10-year bond yield
on Thursday topped 4% for the first time since mid-June, when a sharp move
above that level pushed the closely-watched spread to German debt to around
250 bps and prompted the ECB to hold an emergency meeting to discuss how to
contain bond stress as it withdraws stimulus.

Alert to the dangers of
tightening policy against a backdrop of sharp rises in borrowing costs, the
ECB unveiled its Transmission Protection Instrument (TPI) in July. It is a
new bond purchase scheme to help more indebted euro zone states and prevent a
divergence of borrowing costs from benchmark issuer Germany it sees as
happening through no fault of their own.
"Everyone in the market
knows that 4% is tricky for debt sustainability in Italy and the growth
outlook has deteriorated," said
Pictet Wealth Management fixed income strategist Laureline Renaud-Chatelain.
Yet,
analysts suspect the new tool was unlikely to be used soon - especially as a
snap Italian election looms on Sept. 25.
"The yield level is
going to be a problem. But I don't think the ECB will activate the new tool
before an election," Renaud-Chatelain said.
Renewed Italian political instability
has contributed to the bond sell-off, while the recent yield surge is in line
with peers. Italian and German 10-year yields rose around 70 bps each in
August as fears about higher inflation and rates took hold.
The
risk premium over Germany, at around 235 bps, has widened but is below recent
peaks, supported perhaps by the ECB skewing reinvestments from maturing bonds
it bought for its pandemic purchase scheme at Italy.
"The
spread remains orderly and more than the level it is the behaviour of the
spread (and more generally the periphery) that the ECB would be concerned
about," said Peter Schaffrik, global macro strategist at RBC Capital
Markets.
PAIN
THRESHOLD?
Still, markets were expected
to keep pushing yields higher to test just where the ECB's tolerance level
for pain in Italian bond markets lies.
In the past, analysts have
viewed the 250-300 bps area in the spread as a danger zone for the ECB and
some analysts expect the spread to reach this area in coming months.

UBS,
for instance, reckons the spread could test 300 bps.
Italian
borrowing costs meanwhile climbed to new multi-year highs at a Tuesday
auction.
"No one knows when the ECB
will start intervening and they obviously won't tell us,"
said Mike Riddell, senior fixed income portfolio manager at Allianz Global
Investors.
"My
assumption since the announcements of potential support for the periphery and
namely Italy, is that markets will test (the ECB) given the trajectory for
economic growth and rates."
Battered by soaring energy
prices, many economists expect the euro zone economy to slip into a recession
- a challenging backdrop for the ECB as inflation nears double digits.
On
the plus side, Italy's election noise so far hasn't alarmed investors.
The
Italian rightist alliance's ambitious spending plans will respect European
Union budget rules and not blow a hole in Italy's finances, according to
Giorgia Meloni, who heads the Brothers of Italy party topping the polls. read
more
"The worrying thing for
the market was that you'd have Italy's yields rising and a considerably worse
growth outlook after (former Prime Minister Mario) Draghi left,"
said Mizuho rates strategist Peter McCallum. "It now seems like politics
isn't going to be so much as a shock as some people have been fearing."
Home Work chapter 6 (due with the second mid
term exam):
1.
Draw cash
flow graph of a bond with 5 years left to maturity 5% coupon rate
(hint: cash flows include coupon per year plus principal at maturity)
2.
Find
Wal-Mart bond in FINRA website. Pick one of the three bonds and answer the
following questions. ( http://finra-markets.morningstar.com/BondCenter/Default.jsp,
and search for Wal-Mart bond)
3.
Compare
municipal bond, TIPS, corporate bond and Treasury bond in terms of issuers,
pro and cons (risk).
4.
Do you
recommend TIPS to your grandparents? Why or why not? Please refer to both
articles on TIPS posted in this chapter.
5.
As a bond investor,
do you plan to invest in junk bond? Why or why not?
6. In “Rising
Italy bond yields to test an ECB set to pull rate hike trigger again”, it states that “Italy's 10-year
bond yield on Thursday topped 4% for the first time since mid-June, when a
sharp move above that level pushed the closely-watched spread to German debt
to around 250 bps and prompted the ECB to hold an emergency meeting to
discuss how to contain bond stress as it withdraws stimulus”. Why does a 4%
yield on the Italy’s 10 year bond imply a serious economic problem to the
ECB? Do you have any suggestions to the ECB in terms of how to fix this
problem?
FYI: Italy's
debt-to-GDP ratio is the second-highest in the euro zone (CNBC, youtube)
7. According to “Investors
are piling into high yield bonds. What to know before adding ‘junk’ to your portfolio” and “Junk Bonds Stage a Comeback as Investors Regain Risk
Appetite”, do you think that junk bonds are a good investment
right now? Why or why not?
Optional: go to https://www.treasurydirect.gov/indiv/products/prod_tips_glance.htm
and learn about how to purchase TIPS on TreasruyDirect
Protection for
Inflation, With Some Leaks
A TIPS fund
can shield investors from inflation to some extent, but so can other choices,
like real estate, dividend-paying stocks and commodities.
Credit...Ben
Konkol, By Tim Gray, Jan. 14, 2022
https://www.nytimes.com/2022/01/14/business/mutual-funds/inflation-tips-fund-etf.html
Judged by
their name alone, Treasury Inflation-Protected Securities would seem a cure
for one of today’s main investor anxieties: inflation.
Alas, that
name doesn’t tell all you need to know.
A mutual fund
or exchange-traded fund that invests in TIPS can help prevent rising prices
from eroding the value of your investment portfolio. And inflation is a worry
today: It’s running at an annual rate of 7 percent, a level not seen since
1982. That’s when “E.T.” landed in movie theaters and Michael Jackson’s
“Thriller” thrummed on radios.
But TIPS funds
and E.T.F.s aren’t the best inflation fighters for every investor, and TIPS,
a kind of bond issued by the U.S. Treasury, have complexities that belie
their plain-as-boiled-potatoes label.
People assume
“just because inflation goes up, you’ll do well” with TIPS, said Lynn K. Opp,
a financial adviser with Raymond James in Walnut Creek, Calif. But other
factors, like rising interest rates, can sap TIPS’s returns, she said.
Plus, TIPS are expensive when compared with
standard Treasuries in that they pay less interest, Ms. Opp said. In the
first week of January, a five-year TIPS was yielding minus 1.7 percent, while
a five-year Treasury was yielding 1.4 percent. In effect, TIPS investors were
paying the Treasury to hold their money.
In 2020, net
new flows of about $22 billion gushed into them, according to Morningstar. In
just the first 10 months of 2021, those flows nearly tripled, to $61 billion.
Performance
may have been the draw: The average TIPS fund tracked by Morningstar returned
5.5 percent in 2021, compared with a loss of 1.5 percent for the Bloomberg
Barclays Aggregate Bond Index, a well-known bond index.
To understand
TIPS funds or E.T.F.s, it helps to understand the underlying
inflation-protected securities.
The U.S. Treasury adjusts the principal of a TIPS
twice a year based on the most recent reading of the Consumer Price Index, a
government measure of inflation. When
the C.P.I. climbs, the principal ratchets up. And when the index falls —
because prices are falling — it ratchets down.
“The interest
payments can change,” said Gargi Chaudhuri, head of iShares investment strategy,
Americas, for BlackRock, because those payments are based on principal that
can change with inflation.
“If you look
back a decade, inflation expectations sat above where inflation rolled in
year after year,” said Steve A. Rodosky, a co-manager of PIMCO’s Real Return
Fund. “So people would’ve been better off owning nominal Treasuries.”
(“Nominal” is professionals’ term for noninflation-protected bonds.)
Perhaps TIPS’s
most confusing quality is the nature of their inflation protection.
It might seem that a TIPS fund would work like
hiking pants that zip off into shorts: right for whatever (inflationary)
conditions arise. But what sets TIPS apart is the protection they afford
against unexpected inflation, said Roger Aliaga-Diaz, chief economist for
Vanguard.
Market prices
for all assets adjust, to some extent, to reflect anticipated inflation.
Prices for standard bonds, for example, fall to compensate for the fact that
inflation has purloined part of their original yields. Prices for TIPS fall,
too, though the crucial difference is that their inflation adjustments help
compensate for that. (Bond prices and yields move in opposite directions.)
Whether you opt for a TIPS fund in your portfolio
will probably turn on your age and expectations about inflation.
Retirees and people approaching retirement might
choose one because its value should be less volatile than that of other
assets that can help buffer inflation, like stocks and commodities, said Mr.
Aliaga-Diaz. Vanguard’s Target Retirement 2015 Fund, a so-called target-date
fund, allocates 16 percent of its asset value to TIPS.
Jennifer
Ellison, a financial adviser in Redwood City, Calif., said her firm, Cerity
Partners, currently recommends that clients keep 15 percent to 20 percent of
the bond portion of their portfolios in TIPS funds. “But we have been as low
as 10 percent at times,” she said.
A young person might not want any allocation to a
TIPS fund, preferring stock funds as inflation insurance instead.
“Over the longer term, there’s been no
better way to protect oneself from inflation than to have an allocation to
stocks, because corporate earnings tend to grow at a rate that outpaces
inflation, and stocks have appreciated at a rate that well outpaces inflation,”
said Ben Johnson, director of global E.T.F. research for Morningstar.
Even for retirees, a less volatile sort of stock
fund, like one that invests in dividend payers, might blunt inflation better
than a TIPS fund,
Mr. Johnson said.
“Among our
favorites is the Vanguard Dividend Appreciation E.T.F.,” he said. “It owns
stocks that have grown their dividends for at least 10 years running. That’s
a way to dial down a bit of risk while maintaining some equity exposure.”
Another stock
option is Fidelity’s Stocks for Inflation E.T.F., which holds shares of
companies in industries that tend to outperform during inflationary times.
If you go for a TIPS fund, pick one with low costs, Mr. Johnson
said. Costs always matter in investing, but they’re especially important here
because all these funds, in the main, do the same thing: They buy a single
sort of Treasury security.
“In the TIPS
market itself, it’s exceedingly difficult to add value,” he said. Portfolio
managers are thus often allowed to add in a slug of other sorts of bonds, as well
as derivative securities. “But you do add risk by doing that.”
Among the cheaper TIPS offerings are the iShares
0-5 Year TIPS Bond E.T.F., the Vanguard Short-Term Inflation-Protected
Securities E.T.F. and the Schwab U.S. TIPS E.T.F. All three have expense
ratios of 0.05 percent or less.
Inflation
expectations present a harder puzzle for investors than your expected
retirement date. In theory, if you think inflation will exceed the market’s
expectations, a TIPS fund would be a good bet.
Investment pros make this assessment by checking
the break-even inflation rate — the difference between the yields on TIPS and
nominal Treasuries.
“It’s the rate of inflation you need to
average for TIPS to outperform nominal Treasuries over the period for which
you’re investing,” said Kathy Jones, chief fixed income strategist at the
Schwab Center for Financial Research. In
the first week of January, that rate was about 3 percent for five-year
Treasuries versus five-year TIPS.
People who think inflation will exceed that level
for the next five years might want a TIPS fund. (They also
might want to ask themselves why their inflation intuition is better than the
market’s.)
Another
vexation is how TIPS funds state their yields.
The U.S. Securities and Exchange Commission
mandates a standard formula for computing yields — the 30-day yield. That
formula doesn’t work well for TIPS offerings because the regular principal
adjustments to the underlying securities can distort its result.
Some fund
companies calculate the 30-day yield including the principal adjustments;
some don’t.
State Street
Global Advisors, which sponsors the SPDR Portfolio TIPS E.T.F., is one that
doesn’t.
“In our view,
it’s more conservative to not include the inflation adjustment,” said Matthew
Bartolini, head of SPDR Americas research for State Street. “Including it can
lead to a misleading statistic — it’s likely to overstate the eventual yield
of the fund.”
Perhaps the crucial fact to know about TIPS funds
is the most basic one: They’re bond offerings, buffeted by the same
macrofactors that buffet other bonds.
“If interest rates go up, the price is going to go
down, pretty much irrespective of what happens to inflation,” said Ms.
Jones of the Schwab Center.
She cautioned,
too, that “there’s no guaranteed way to beat inflation.”
A TIPS fund
might help. So might an appropriate stock fund. “Having some allocation to
things like real-estate investment trusts and precious metals makes sense, too,
but that’s not necessarily going to beat inflation, either,” she said.
Junk Bonds Stage a
Comeback as Investors Regain Risk Appetite
Borrowing by
the riskiest companies was higher this week than in all of July, but some
warn that the window may not be open for long.
By Joe
Rennison Aug. 19, 2022
https://www.nytimes.com/2022/08/19/business/junk-bonds.html
As the Federal
Reserve raised interest rates, trying to cool the economy by increasing
borrowing costs, companies that are considered risky have found it harder to
raise debt. But firms with low credit
ratings, whose debt is often referred to as “junk,” are now taking advantage
of a window of opportunity to borrow more cash.
Junk-rated companies, which tend to pay higher
rates, have sold $4.1 billion in bonds in the United States this week,
according to Refinitiv. Already, issuance of junk bonds has reached the
highest weekly amount since early June, just before investor confidence
cratered, the stock market reached its nadir and lenders backed away from
junk bonds, which are also known as high-yield debt.
A batch of
better-than-expected corporate earnings reports and positive economic data
has recently lifted stock markets, eased volatility and softened some
investors’ forecasts for the Fed’s rate-raising campaign. The junk bond
market has also begun to thaw: This week’s issuance topped the total for all
of July.
Yet bankers and investors warn that the time for
these riskier borrowers to raise fresh funds may be short. Companies with
debt and payments to lenders soon coming due have jumped at the chance to
refinance.
“Depending on
your view of the overall economy, this might be a really good opportunity to
tap the market,” said John Gregory, the head of leveraged syndicate at Wells
Fargo, who works with companies to sell high-yield bonds to investors.
The embattled cruise operator Royal Caribbean
raised $1.25 billion on Monday, paying a hefty interest rate of 11.63 percent.
The
company will use the cash in part to pay back investors that lent it $650
million in 2012, which comes due in November. When it borrowed that money,
before the pandemic ground the cruise industry to a halt, the company paid an
interest rate of 5.25 percent.
The recent
rise in issuance has been aided by four consecutive weeks of cash flowing
into funds that buy U.S. high-yield bonds, the longest streak in nearly a
year.
“The fear of
the market going lower turned into a fear of missing out,” said John McClain,
a portfolio manager at Brandywine Global Investment Management.
However, the market has remained closed to the
very riskiest issuers. Credit ratings for junk issuers range from BB to CCC,
the lowest rung on the scale. (The safest, “investment grade”
borrowers are rated BBB up to AAA.) There
has only been one CCC-rated deal since the end of April, a $400 million bond
from packaging manufacturer Intertape Polymer in June.
On Thursday, S&P
Global Ratings said that it expected 3.5 percent of junk issuers to default
on their debt in the 12 months through June 2023, more than double
the 1.4 percent rate in the year through June 2022. Roughly $90 billion, or 6
percent of the junk bond market, remains in distress — defined as
trading at a yield above Treasuries, or “spread,” of more than 10 percentage
points — according to ICE Data Services.
Both
high-yield bonds and the stock market ended the week somewhat lower than
where they started, as a rally that has lifted company valuations and debt
prices over the past two months paused.
Investors are
split on how aggressive the Federal Reserve will be as it raises interest
rates in an attempt to cool the economy by enough to tame inflation but not
so much to trigger a severe downturn. Market moves will be driven by
investors’ assumptions about “whether we get to a soft landing or whether we
see a deeper recession,” said Mr. McClain.
Investors
are piling into high-yield bonds. What to know before adding ‘junk’ to your
portfolio
PUBLISHED FRI,
AUG 12 20222:15 PM EDT, Kate Dore, CFP®
https://www.cnbc.com/2022/08/12/investors-are-piling-into-junk-bonds-what-to-know-before-buying.html
KEY POINTS
·
With a recent influx of money pouring into high-yield bonds,
financial experts urge caution before piling in.
·
High-yield bonds typically have greater default risk than
investment-grade bonds because issuers may be less likely to cover interest
payments and loans by the maturity date.
After a rocky
start to 2022, U.S. high-yield bond funds received an estimated $6.8 billion
in net money in July, according to data from Morningstar Direct.
A DAY AGO
While yields have recently dipped to 7.29% as of
Aug. 10, interest is still higher than the 4.42% received in early January,
according to the ICE Bank of America U.S. High-Yield Index.

However, junk bonds typically have greater default
risk than their investment-grade counterparts because issuers may be less
likely to cover interest payments and loans by the maturity date.
“It’s a shiny
metal on the ground, but all shiny metals are not gold,” said certified
financial planner Charles Sachs, chief investment officer at Kaufman Rossin
Wealth in Miami.
While some say default risk is built into junk
bonds’ higher yields, Sach warns these assets may act more like stocks on the
downside.
If an investor feels strongly about buying
high-yield bonds, he may suggest a smaller allocation — 3% to 5%, for example.
“Don’t think of it as a major food group within your portfolio,” he added.
Neuberger: We’re closer to the end of peak uncertainty, leading investors to get
back into the high-yield market
Since March, the
Federal Reserve has taken aggressive action to fight inflation, including the
second consecutive 0.75 percentage point interest rate hike in July. And
these rate hikes may continue with annual inflation still at 8.5%.
At the margin, rising interest rates may make it
more difficult for some bond issuers to cover their debt, especially those
with maturing bonds that need to refinance, said Matthew Gelfand, a CFP
and executive director of Tricolor Capital Advisors in Bethesda, Maryland.
“I think that
investors and lenders will demand somewhat higher rates as a result,” he
said, noting that rising interest rates may continue for a while.
Coupon rate ‘spread’ is slightly smaller than
usual
When assessing high-yield bonds, advisors may
compare the “spread” in coupon rates between a junk bond and a less risky asset,
such as U.S. Treasurys. Generally, the wider the spread, the more attractive
high-yield bonds become.
With high-yield
bonds paying 7.29% as of Aug. 10, an investor may receive $72.90 per year on
a $1,000 face value bond, whereas the 7-year Treasury, offering about 2.86%,
provides $28.60 annually for the same $1,000 bond.
U.S. 7-year
Treasury yield year-to-date

In this example, the yield spread is roughly 4.43
percentage points, offering a so-called income premium of $44.30, which is
$72.90 from the high-yield bond minus $28.60 from the Treasury.
Over the past 40 years, the average spread between
these assets has been about 4.8 percentage points, according to Gelfand,
making the slightly narrower spread less attractive.
However, “there are a lot of moving parts in the
high-yield bond market,” he added.
FYI: I bond
I
Bond: What It Is, How It Works, Where to Buy
By ADAM HAYES Updated September
18, 2022, Reviewed by ROGER WOHLNER, Fact checked by SUZANNE KVILHAUG
https://www.investopedia.com/terms/s/seriesibond.asp
What Is a Series
I Bond?
A series I bond is a non-marketable,
interest-bearing U.S. government savings bond that earns a combined fixed
interest rate and variable inflation rate (adjusted semiannually). Series I bonds are meant to give
investors a return plus protection from inflation.
Most Series I
bonds are issued electronically, but it is possible to purchase paper
certificates with a minimum of $50 using your income tax refund, according to
Treasury Direct.
KEY TAKEAWAYS
·
A series I bond is a non-marketable, interest-bearing U.S.
government savings bond.
·
Series I bonds give investors a return plus inflation protection
on their purchasing power and are considered a low-risk investment.
·
The bonds cannot be bought or sold in the secondary markets.
·
Series I bonds earn a fixed interest rate for the life of the
bond and a variable inflation rate that is adjusted each May and November.
·
These bonds have a 20-year initial maturity with a 10-year
extended period for a total of 30 years.
How Do I Bonds
Work?
I bonds are issued at a fixed interest rate for up
to 30 years, plus a variable inflation rate that is adjusted each May and
November. This gives the bondholder some protection from the effects of
inflation.
Understanding Series
I Bonds
Series I bonds are non-marketable bonds that are
part of the U.S. Treasury savings bond program designed to offer low-risk
investments. Their non-marketable feature means they cannot be bought or
sold in the secondary markets. The two types of interest that a Series I bond
earns are an interest rate that is fixed for the life of the bond and an
inflation rate that is adjusted each May and November based on changes in the
non-seasonally adjusted consumer price index for all urban consumers (CPI-U).
The fixed-rate component of the Series I bond is
determined by the Secretary of the Treasury and is announced every six months
on the first business day in May and the first business day in November. That fixed rate
is then applied to all Series I bonds issued during the next six months is
compounded semiannually and does not change throughout the life of the bond.
Like the fixed
interest rate, the inflation rate is
announced twice a year in May and November and is determined by changes to
the Consumer Price Index (CPI), which is used to gauge inflation in the U.S.
economy. The change in the inflation rate is applied to the bond every
six months from the bond's issue date.
Where Can I Buy Series I
Savings Bonds?
U.S. savings bonds, including Series I bonds, can
only be purchased online from the U.S. Treasury, using the TreasuryDirect website. You
can also use your federal tax refund to purchase Series I bonds.
Credit Suisse in market spotlight despite moves to
calm concerns (FYI)
By Oliver Hirt and
Michael Shields
https://www.reuters.com/business/finance/credit-suisse-fall-around-10-early-trading-2022-10-03/
Summary
·
Credit Suisse caught in market turbulence ahead of revamp
·
Shares fell as much as 11.5% before recouping losses
·
Bank's euro-denominated bonds reach record lows
·
Swiss bank says its capital, liquidity are strong
ZURICH, Oct 3
(Reuters) - Credit Suisse Group AG (CSGN.S) saw its shares slide by as much
as 11.5% and its bonds hit record lows on Monday before clawing back some of
the losses amid concerns about the lender’s ability to restructure its
business without asking for more money.
The situation
prompted Swiss regulator FINMA and the Bank of England in London, where the
lender has a major hub, to monitor what was happening and work closely
together, one source familiar with the matter said.
Some analysts
and industry sources said the bank had enough capital and cash to deal with
any crises. One analyst said investors feared the bank's ability to execute
on a turnaround strategy, which it is due to reveal on Oct. 27.
Broader market
malaise is also likely adding to investor worries, they said. Global financial
markets have been particularly fragile of late, where rapidly rising interest
rates, policy inconsistencies, recession fears and the war in Ukraine have
unnerved investors.
"The key
issue is the viability of the bank following its upcoming strategic review,"
wrote ABN AMRO analyst Joost Beaumont, who added that adverse market
conditions have raised the "execution risk of any strategic
review."
The Bank of
England, FINMA and the Swiss finance ministry declined to comment.
Analysts at Citi
said that widening credit spreads could exacerbate market fears and damage
counterparty confidence, as well as drive funding costs higher.
"In the
long-term the further the share price falls the more dilutive any capital
raise becomes (and vice versa), which constrains the magnitude of any
investment banking restructuring that CS can undertake," the analysts
said.
Credit Suisse, one of the largest in Europe and
one of Switzerland's global systemically important banks, has had to raise
capital, halt share buybacks, cut its dividend and revamp management after
losing more than $5 billion from the collapse of investment firm Archegos in
March 2021, when it also had to suspend client funds linked to failed
financier Greensill.
In July, Credit Suisse
announced its second strategy review in a year and replaced its chief
executive, bringing in restructuring expert Ulrich Koerner to scale back
investment banking and cut more than $1 billion in costs. read more
The bank is considering measures to scale back its
investment bank into a "capital-light, advisory-led" business, and
is evaluating strategic options for the securitised products business, Credit
Suisse has said.
Citing people
familiar with the situation, Reuters reported last month that Credit Suisse
was sounding out investors for fresh cash as it attempts its overhaul. read
more
Credit Suisse
shares fell as much as 11.5% before coming off early lows to end down just
1%. Its international bonds also showed the strain, with euro-denominated
bonds dropping to record lows before clawing back some losses in the
afternoon.
Spreads on Credit Suisse's U.S. dollar bonds were
quoted on Monday morning about 40 to 90 basis points wider across their
outstanding bonds. Their bonds maturing 2027 were about 365 bps over Treasuries vs
290 bps bid on Friday while the Credit Suisse 6.537% bond maturing August
2033 was bid at 460 bps over Treasuries vs 420 bps on Friday, one syndicate
banker said.
"It is
pretty ugly for CS bonds," said the banker.
Credit Suisse credit default swaps soared higher
on Monday, adding 105 basis points from Friday's close to trade at 355
bps, their highest level in at least
more than two decades. The bank's CDS, which measure the cost to insure its
bonds, stood at 57 bps at the start of the year.
Bank executives
spent the weekend reassuring large clients, counterparties and investors
about its liquidity and capital, the Financial Times reported on Sunday. read
more
That followed
Chief Executive Koerner’s telling staff last week that the bank, whose market
capitalisation dropped to a record low of 9.73 billion Swiss francs ($9.85
billion) on Monday, has solid capital and liquidity.
Some investors said they were not panicking.
"They’ll be recapitalised by the public
markets if the environment is good in a month or two, or they’ll be
backstopped by the Swiss government if the environment is bad," said
Thomas Hayes, chairman and managing member of New York-based Great Hill
Capital.
LIQUIDITY
'HEALTHY'
JPMorgan
analysts said in a research note on Monday that, based on its financials at
the end of the second quarter, they view Credit Suisse's capital and
liquidity as "healthy".
Given the bank has indicated a near-term intention
to keep its CET1 capital ratio at 13% to 14%, the second-quarter end ratio is
well within that range and the liquidity coverage ratio is well above
requirements, the analysts added.
Credit Suisse
had total assets of 727 billion Swiss francs ($735.68 billion) at the end of the
second quarter, of which 159 billion francs was cash and due from banks,
while 101 billion francs was trading assets, it noted.
Still, investors
are questioning how much capital the bank may need to raise to fund the cost
of a restructuring, analysts at Jefferies wrote in a note to clients on
Monday. Also, the bank is now potentially a forced seller of assets, they
said.
Deutsche Bank
analysts in August estimated a capital shortfall of at least 4 billion
francs.
Credit Suisse seeks to reassure investors of
financial strength amid rising concerns
Chapter
7 Rating, Term structure
Part I: Credit
Rating Agency
Chapter 7 Rating Agency, Interest rate
risk, yield curve (PPT)
The
Big Short - Standard and Poors scene --- This is how they
worked
1. Conflict of
interest?
2. Who is doing the
right thing, the lady representing the rating agency, or the Investment
Banker?
Three Major Rating Agencies
University: Bond
rating (video)
1. Who are they?
2. Are they private firms or government agencies?
3. How do they rank?
4. Do we need rating agencies and critiques.
|
Category |
Definition |
|
AAA |
An
obligation rated 'AAA' has the highest rating assigned by Standard &
Poor's. The obligor's capacity to meet its financial commitment on the
obligation is extremely strong. |
|
AA |
An
obligation rated 'AA' differs from the highest-rated obligations only to a
small degree. The obligor's capacity to meet its financial commitment on
the obligation is very strong. |
|
A |
An
obligation rated 'A' is somewhat more susceptible to the adverse effects of
changes in circumstances and economic conditions than obligations in
higher-rated categories. However, the obligor's capacity to meet its
financial commitment on the obligation is still strong. |
|
BBB |
An
obligation rated 'BBB' exhibits adequate protection parameters. However,
adverse economic conditions or changing circumstances are more likely to
lead to a weakened capacity of the obligor to meet its financial commitment
on the obligation. |
|
Obligations
rated 'BB', 'B', 'CCC', 'CC', and 'C' are regarded as having significant
speculative characteristics. 'BB' indicates the least degree of speculation
and 'C' the highest. While such obligations will likely have some quality
and protective characteristics, these may be outweighed by large
uncertainties or major exposures to adverse conditions. |
|
Sovereign Credit Rating
By JAMES CHEN,
Reviewed by GORDON SCOTT on August 26, 2020
https://www.investopedia.com/terms/s/sovereign-credit-rating.asp
What Is a Sovereign Credit Rating?
A sovereign credit rating is an independent
assessment of the creditworthiness of a country or sovereign entity.
Sovereign credit ratings can give investors insights into the level of risk
associated with investing in the debt of a particular country, including any
political risk.
At the request
of the country, a credit rating agency will evaluate its economic and
political environment to assign it a rating. Obtaining a good sovereign
credit rating is usually essential for developing countries that want access
to funding in international bond markets.
KEY TAKEAWAYS
· A sovereign credit rating is an independent assessment of the creditworthiness of a country or sovereign entity.
· Investors use sovereign credit ratings as a way to assess the riskiness of a particular country's bonds.
· Standard & Poor's gives a BBB- or higher rating to countries it considers investment grade, and grades of BB+ or lower are deemed to be speculative or "junk" grade.
· Moody’s considers a Baa3 or higher rating to be of investment grade, and a rating of Ba1 and below is speculative.
Understanding Sovereign Credit Ratings
In addition to
issuing bonds in external debt markets, another common motivation for
countries to obtain a sovereign credit rating is to attract foreign direct
investment (FDI). Many countries seek ratings from the largest and most prominent
credit rating agencies to encourage investor confidence. Standard & Poor's, Moody's, and Fitch Ratings are the three most
influential agencies. Other well-known credit rating agencies include
China Chengxin International Credit Rating Company, Dagong Global Credit
Rating, DBRS, and Japan Credit Rating Agency (JCR). Subdivisions of countries
sometimes issue their own sovereign bonds, which also require ratings.
However, many agencies exclude smaller areas, such as a country's regions,
provinces, or municipalities.
Investors use sovereign credit ratings as a way to
assess the riskiness of a particular country's bonds.
Sovereign credit risk, which is reflected in
sovereign credit ratings, represents the likelihood that a government might
be unable—or unwilling—to meet its debt obligations in the future. Several key factors come into play in
deciding how risky it might be to invest in a particular country or region. They include its debt service ratio,
growth in its domestic money supply, its import ratio, and the variance of
its export revenue.
Many countries
faced growing sovereign credit risk after the 2008 financial crisis, stirring
global discussions about having to bail out entire nations. At the same time,
some countries accused the credit rating agencies of being too quick to
downgrade their debt. The agencies were also criticized for following an
"issuer pays" model, in which nations pay the agencies to rate
them. These potential conflicts of interest would not occur if investors paid
for the ratings.
Examples of
Sovereign Credit Ratings
Standard &
Poor's gives a BBB- or higher rating to countries it considers investment
grade, and grades of BB+ or lower are deemed to be speculative or
"junk" grade. S&P gave Argentina a CCC- grade in 2019, while Chile
maintained an A+ rating. Fitch has a similar system.
Moody’s
considers a Baa3 or higher rating to be of investment grade, and a rating of
Ba1 and below is speculative. Greece received a B1 rating from Moody's in
2019, while Italy had a rating of Baa3. In addition to their letter-grade
ratings, all three of these agencies also provide a one-word assessment of
each country's current economic outlook: positive, negative, or stable.
Sovereign Credit Ratings in the Eurozone
The European
debt crisis reduced the credit ratings of many European nations and led to
the Greek debt default. Many sovereign nations in Europe gave up their
national currencies in favor of the single European currency, the euro. Their sovereign debts are no longer
denominated in national currencies. The
eurozone countries cannot have their national central banks "print
money" to avoid defaults. While the euro produced increased trade
between member states, it also raised the probability that members will
default and reduced many sovereign credit ratings.
Sovereigns Rating (http://countryeconomy.com/ratings/)


Class discussion Topics
· How
much do you trust those rating agencies?
· Are
those rating agencies private or public firms?
· What
factors should be considered when a rating agency is evaluating a debt?
How credit agencies work(video)
Rating Conflicts (video) https://www.youtube.com/watch?v=-C5JW4I3nfU
Part II: Z Scores
calculating Z
scores is as follows:
Z = α + ![]()
where a is a
constant, Ri the ratios, βi the relative weighting applied to ratio Ri
and n the number of ratios used.
The Altman Z-Score Formula (https://www.investopedia.com/terms/z/zscore.asp)
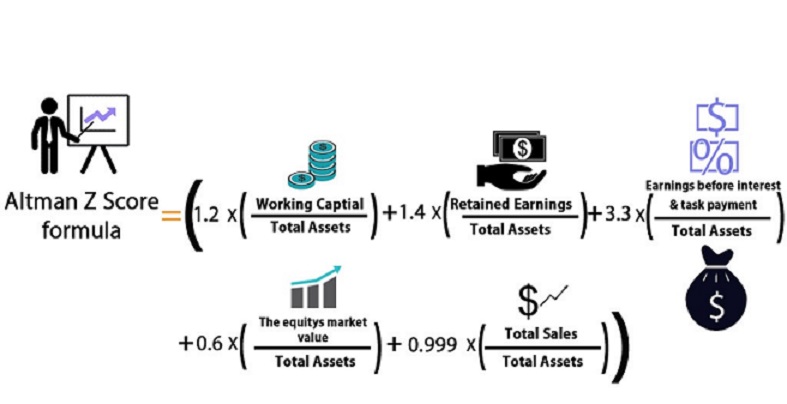
The Altman Z-score is the
output of a credit-strength test that helps gauge the likelihood of
bankruptcy for a publicly traded manufacturing company. The Z-score is based
on five key financial ratios that
can be found and calculated from a company's annual 10-K report.
The calculation used to determine the Altman Z-score is as follows:
where: Zeta(ζ)=The Altman Z-score
A=Working capital/total assets
B=Retained earnings/total assets
C=Earnings before interest and taxes (EBIT)/totalassets
D=Market value of equity/book value of total liabilities
E=Sales/total assets
Typically, a score
below 1.8 indicates that a company is likely heading for or is under the
weight of bankruptcy. Conversely, companies that score above 3 are less
likely to experience bankruptcy.
The zones of discrimination were as such:
When Altman Z-Score <= 1.8, it is in Distress Zones.
When Altman Z-Score >= 3, it is in
Safe Zones.
When Altman Z-Score is between 1.8 and 3, it is in Grey Zones.

https://www.gurufocus.com/term/zscore/DAL/Altman-Z-Score/Delta-Air-Lines-Inc
For class discussion: Which of
the above airlines are in danger based on its z score? But do you think so?
*********
Let’s try to get AAL’s z score (FYI)****************** Delta Air Lines Altman
Z-Score Calculation
Altman Z-Score model is an accurate forecaster of failure up
to two years prior to distress. It can be considered the assessment of the
distress of industrial corporations.
Delta Air Lines's Altman Z-Score for today is calculated with
this formula:
·
Z=1.2 *X1 + 1.4*X2 + 3.3*X3 + 0.6*X4 + 1.0*X5
·
= 1.2*-0.1205 + 1.4*-0.0047 + 3.3*0.028 + 0.6*0.2756 + 1.0*0.5587
·
= 0.67
Trailing Twelve Months (TTM) ended in Jun. 2022:
·
Total Assets was $74,805
Mil.
·
Total Current Assets was
$17,313 Mil.
·
Total Current Liabilities
was $26,324 Mil.
·
Retained Earnings was $-353
Mil.
·
Pre-Tax Income was 1033 +
-1200 + -395 + 1532 = $970 Mil.
·
Interest Expense was -269 +
-274 + -265 + -314 = $-1,122 Mil.
·
Revenue was 13824 + 9348 +
9470 + 9154 = $41,796 Mil.
·
Market Cap (Today) was
$19,569 Mil.
Total Liabilities was $70,994 Mil.
·
X1 = Working
Capital / Total Assets = (Total
Current Assets - Total Current Liabilities) /
Total Assets = (17313 - 26324) / 74805 = -0.1205
·
X2 = Retained
Earnings/ Total Assets = -353 /
74805 = -0.0047
·
X3 = Earnings
Before Interest and Taxes / Total
Assets = (Pre-Tax Income - Interest Expense) / Total Assets = (970 - -1122) /
74805 = 0.028
·
X4 = Market Value
Equity / Book Value of Total
Liabilities = Market Cap / Total Liabilities = 19569.360 /
70994 = 0.2756
·
X5 = Revenue /
Total Assets = 41796 / 74805 = 0.5587
The zones of discrimination were as such:
·
Distress Zones - 1.81 <
Grey Zones < 2.99 - Safe Zones
·
Delta Air Lines has a Altman
Z-Score of 0.67 indicating it is in Distress Zones.
·
Study by Altman found that
companies that are in Distress Zone have more than 80% of chances of
bankruptcy in two years.
Delta Air Lines (NYSE:DAL) Altman Z-Score Explanation
·
X1: The Working Capital/Total Assets
(WC/TA) ratio is a measure of the net liquid assets of the firm relative to
the total capitalization. Working capital is defined as the difference
between current assets and current liabilities. Ordinarily, a firm
experiencing consistent operating losses will have shrinking current assets
in relation to total assets. Altman found this one proved to be the most
valuable liquidity ratio comparing with the current ratio and the quick
ratio. This is however the least significant of the five factors.
·
X2: Retained Earnings/Total
Assets: the RE/TA ratio measures the leverage of a firm. Retained earnings is
the account which reports the total amount of reinvested earnings and/or
losses of a firm over its entire life. Those firms with high RE, relative to
TA, have financed their assets through retention of profits and have not
utilized as much debt.
·
X3, Earnings Before Interest
and Taxes/Total Assets (EBIT/TA): This ratio is a measure of the true
productivity of the firm's assets, independent of any tax or leverage
factors. Since a firm's ultimate existence is based on the earning power of
its assets, this ratio appears to be particularly appropriate for studies
dealing with corporate failure. This ratio continually outperforms other
profitability measures, including cash flow.
·
X4, Market Value of Equity/Book
Value of Total Liabilities (MVE/TL): The measure shows how much the firm's
assets can decline in value (measured by market value of equity plus debt)
before the liabilities exceed the assets and the firm becomes insolvent.
·
X5, Revenue/Total Assets
(S/TA): The capital-turnover ratio is a standard financial ratio illustrating
the sales gene
Let’s see how the Z score
affects Delta’s bond rating: https://finra-markets.morningstar.com/BondCenter/Default.jsp

Homework of
chapter 7 part I: (Due with the second mid term exam)
1.
Why does Moody downgrade Ford’s bond to Junk bond? Do you support the
decisions of the other two rating agencies giving an investment grade bond
rating to Ford’s bond? Do you think that the repurchase plan helps Ford to
improve its credit rating? Please refer to the articles posted in this
session.
Ford announces buyback of up to $5 billion in debt
(CNBC, youtube)
Refer to the z score posted on gurufocus.com

2.
What is Z score? Refer to the Z scores of American airlines, Jet Blue
Airlines, and Delta Airlines. Do you
think that Delta airline is more likely to default than the other two
airlines based on z score? Why or why not?
Hint: search for z scores of the three airlines and compare for z
scores.
|
CCC |
An
obligation rated 'CCC' is currently vulnerable to nonpayment, and is
dependent upon favorable business, financial, and economic conditions for
the obligor to meet its financial commitment on the obligation. In the
event of adverse business, financial, or economic conditions, the obligor
is not likely to have the capacity to meet its financial commitment on the
obligation. |
America could be hit with a debt downgrade for the
first time since 2011
By Matt Egan,
Updated 12:43 PM ET, Fri October 1, 2021
https://www.cnn.com/2021/10/01/economy/credit-rating-debt-ceiling/index.html
New York, NY
(CNN) Fitch Ratings warned Friday that the
fight in Washington over raising the debt ceiling could force the firm to
downgrade America's AAA credit rating.
"The
failure of the latest efforts to suspend the U.S. federal government's debt
limit indicates that the current stand-off could be among the most protracted
since 2013," Fitch said.
Echoing what
S&P Global Ratings said Thursday, Fitch said it believes the debt limit
will be raised or suspended "in time to avert a default event."
However, Fitch
added that "if this were not done
in a timely manner, political brinksmanship and reduced financing flexibility
could increase the risk of a US sovereign default."
The Treasury Department has warned it will run out
of cash and exhaust extraordinary measures by October 18. At that point,
Treasury would no longer have 100% confidence it could pay America's bills.
Fitch suggested that getting near that date could
trigger a downgrade.
"We view
reaching the Treasury's X-date without the debt limit having been raised as
the principal tail risk to the US sovereign's willingness and capacity to
pay," Fitch said. "If this appeared likely we would review the US
sovereign rating, with probably negative implications."
Fitch reiterated that the United States would
likely get downgraded even if it kept paying bondholders, but delayed other
payments like Social Security and paychecks to federal workers.
"Prioritization
of debt payments, assuming this is an option, would lead to non-payment or
delayed payment of other obligations, which would likely undermine the U.S.'s
'AAA' status," Fitch said.
During the 2011 debt ceiling fight, S&P
downgraded the US credit rating for the first time ever, while Fitch and
Moody's kept a perfect AAA rating on the world's largest economy. Fitch has
had a negative outlook on the United States since July 2020.
"The debt
limit impasse reflects a lack of political consensus that has hampered the
U.S.'s ability to meet fiscal challenges for some time," Fitch said on
Friday.
Fitch said
amending the reconciliation bill to address the debt ceiling "appears
the most viable option for raising the debt ceiling, but the process would
take some time in the Senate."
Ford to repurchase up to $5 billion in junk bonds as it
restructures its balance sheet in hopes of restoring credit rating
PUBLISHED THU,
NOV 4 20218:30 AM EDTUPDATED THU, NOV 4 20211:47 PM EDT Michael Wayland
Ford is buying back much of the $8 billion in
bonds the company issued at the start the coronavirus pandemic at lofty
yields of between 8.5% and 9.625%, according to Ford Treasurer
Dave Webb. It’s also repurchasing some
older bonds at similarly high yields in hopes of upgrading its credit rating,
which lost its investment-grade status in March 2020.
Ford expects to
fund the buyback with cash on hand, which totaled about $31 billion to end
the third quarter. Webb said a $1
billion or more “green” bond could follow as part of a wider effort to
“aggressively restructure” its balance sheet under its Ford+ turnaround plan.
He said the company is looking to issue 10-year bonds that pay between 3.5%
and 4.5%.
“We think it’s the time to aggressively
restructure the balance sheet, lower our interest costs, and really clear the
decks for 2022 and beyond. That’s really what we’re looking to accomplish
here,” Webb told reporters during a call.
The repurchase
was announced as part of Ford’s new “sustainable financing framework,” which
the automaker is calling a first of its kind for the North American
automotive industry. It will focus on vehicle electrification and other
environmental and social areas such as clean manufacturing and community
revitalization.
It’s a shift for Ford, including its Ford
Credit financial subsidiary, as environmental, social and governance, or ESG,
investing becomes more popular and a consideration of investors.
The bond
repurchase and new framework are aimed at helping to finance the Ford+ plan,
including investing tens of billions of dollars into electric and autonomous
vehicle technologies.
Webb declined
to speculate on when the automaker expects to return to investment grade. He
said the company is “intense on getting there as quickly as we possibly can.”
“The actions
that we’re taking here on the balance sheet further support that effort and
intent. We think they, certainly, should be viewed as a credit positive,”
Webb said.
Is Ford's Junk Bond
Buyback Good News For Investors?
By
Rhian Hunt – Nov 8, 2021 at 8:16AM
https://www.fool.com/investing/2021/11/08/is-fords-junk-bond-buyback-good-news-for-investors/
KEY
POINTS
·
Ford added $8 billion of what it calls “COVID bonds” during 2020’s lockdown crisis.
·
The company was rated as “speculative,” cutting it off from institutional investment.
·
It is now buying back its high-yield “junk bonds” and issuing green
bonds in their place.
The
company is working to regain an investment grade rating and its benefits.
After
taking on billions in debt to weather the 2020 economic storms of COVID-19,
Ford (F 1.21%) announced on Nov. 4
that it's freeing itself from approximately $5 billion worth of junk bonds
through an upcoming buyback. The
bonds helped save Ford's bacon when the U.S. government enforced shutdowns
last year, but those bonds also pushed it below investment-grade rating.
Now, the company aims to win
back that rating -- a step potentially helpful in supporting its aggressive
electric vehicle (EV) expansion, and likely bullish for investors much sooner.
Let's take a closer look at what's happening.
Striking
off the junk bond shackles
Early last year, when the
coronavirus arrived on America's shores and lockdowns began crushing the
economy, Ford issued $8 billion in bonds, giving itself a substantial cash
reserve to survive the crisis. The bond issue served its purpose in this way,
but it also caused corporate credit rating agency Standard & Poor's
(S&P) to cut Ford's rating to BB+, a "speculative grade" rating
rather than "investment grade."
Moody's had already dropped
the automaker's rating below the "investment" threshold in
September 2020, citing declining new car sales simultaneous with a
multi-billion-dollar Ford restructuring.
Fitch Ratings, the third
agency, also downgraded the Blue Oval to BB+ in May,
specifically noting that the $8 billion bond issue "will leave the
company with higher leverage over the longer term, along with a substantial
maturity wall in 2023 when the first $3.5 billion [...] comes due." With
all three main rating agencies cutting Ford's rating to
"speculative" (or, colloquially, "junk"), obtaining
additional credit became more difficult and more expensive. Additionally,
large institutional investors such as mutual funds, insurance companies,
hedge funds, and so on, are typically barred from investing in junk rated
companies.
The
automotive giant already had a checkered rating history, spending seven years
with a junk rating between 2005 and 2012. Its latest move, however, is likely
a crucial step in putting the past behind it, adding strength to its Ford+
turnaround strategy and initiatives.
Ford,
which currently has $31 billion in cash available, is spending up to $5
billion of that repurchasing junk bonds with yields between 6.375% and 9.98%,
according to its press release. Speaking to reporters on Nov. 4, the Blue
Oval's treasurer David Webb said that "it's the time to aggressively
restructure the balance sheet, lower our interest costs, and really clear the
decks for 2022 and beyond," CNBC reports. Webb also stated the company
plans to issue 3.5% to 4.5% yield bonds with a 10-year maturity in place of
the retired junk bonds. This includes an initial $1 billion in
"green" bonds that will enable Ford Credit to give lower-credit car
buyers financing.
Feeding
into a bigger winning strategy
Crucially, escaping the
fetters of its junk bonds and associated junk rating will again open Ford up
to cash inflows from major institutional investors.
A return to investment-grade rating
will therefore likely help ordinary investors in at least two major bullish
ways. Most immediately, institutional money flowing back into Ford stock
should cause share value to rise, making existing shareholders' holdings more
valuable.
In
a big-picture sense, though, the move is even more positive for Fools with
the Blue Oval in their portfolios. Ford explicitly states that the initiative
will help it fund its massive expansion into electric vehicles, with $30
billion earmarked for EV production investment by 2030 and $7 billion going
into its six-mile-square "Blue Oval City" factory in Tennessee and
several battery-making facilities immediately.
Eschewing
the half-hearted approach of some traditional automakers to the electric
vehicle revolution, Ford aims to have a fifty-fifty split between EVs and
gasoline vehicles in its vehicle lineup by the end of the decade. In addition
to already producing some EVs, Ford says it now has more than 160,000
reservations for its Ford F-150 Lightning all-electric pickup truck. For comparison,
Tesla (TSLA -3.46%) delivered 101,312 vehicles in total in 2017, and 145,846
Model 3 vehicles (out of a total 245,240 EVs) in 2018.
Ford's
electrification push is arguably its most important current strategy, with
Tesla's more than $1 trillion valuation highlighting the immense potential of
EV sales. Ford is taking decisive large-scale action to be one of the leading
electric car stocks once the mass transition from gasoline autos to EVs
occurs.
Since
its return to investment grade will provide a powerful boost to this
electrification strategy (and, likely, share value), the answer to the
question "Is Ford's junk bond
buyback good news for investors?" appears to be a decisive
"Yes."
Ford announces buyback of up to $5 billion in debt
(CNBC, youtube)
Part
III: Yield curve (or Term structure)
·
What is yield curve?
Daily Treasury Yield Curve Rates
http://www.yieldcurve.com/MktYCgraph.htm

For discussion:
· Why do the rates change daily?
· Can the 30y yield < 3m T-Bill rate?
· So the yield curve is not that flatten anymore. So we do not need to
worry for recession anymore? Right?
· Why have the spreads between UK interest rates and US interest rates
widened?
·
Why do we need yield
curve?
·
What can yield curve
tell us?
Yield Curve http://finra-markets.morningstar.com/BondCenter/Default.jsp

· For class discussion: How do you describe the shape
of the current yield curve as of 10/11/2022?
· Why is the current yield curve not upward slopping?
· What can well tell from the current yield curve about the
future economy?
Humped Yield Curve
By
JAMES CHEN Updated July 27, 2021, Reviewed by GORDON SCOTT
What Is
a Humped Yield Curve?
A humped yield curve is a
relatively rare type of yield curve that results when the interest rates on
medium-term fixed income securities are higher than the rates of both long
and short-term instruments. Also,
if short-term interest rates are expected to rise and then fall, then a
humped yield curve will ensue. Humped
yield curves are also known as bell-shaped curves.
KEY
TAKEAWAYS
·
A humped yield curve occurs when
medium-term interest rates are higher than both short- and long-term rates.
·
A humped curve is uncommon, but may form as
the result of a negative butterfly, or a non-parallel shift in the yield
curve where long and short-term yields fall more than intermediate one.
·
Most often yield curves feature the lowest
rates in the short-term, steadily rising over time; while an inverted yield
curve describes the opposite. A humped curve is instead bell-shaped.
Humped
Yield Curves Explained
The yield curve, also known
as the term structure of interest rates, is a graph that plots the yields of
similar-quality bonds against their time to maturity, ranging from 3 months
to 30 years. The
yield curve, thus, enables investors to have a quick glance at the yields
offered by short-term, medium-term, and long-term bonds. The short end of the yield curve based on short-term interest rates
is determined by expectations for the Federal Reserve policy; it rises
when the Fed is expected to raise rates and falls when interest rates are
expected to be cut. The long end of the
yield curve is influenced by factors such as the outlook on inflation, investor
demand and supply, economic growth, institutional investors trading large
blocks of fixed-income securities, etc.
The
shape of the curve provides the analyst-investor with insights into the
future expectations for interest rates, as well as a possible increase or
decrease in macroeconomic activity. The shape of the yield curve can take on
various forms, one of which is a humped curve.
When
the yield on intermediate-term bonds is higher than the yield on both
short-term and long-term bonds, the shape of the curve becomes humped. A
humped yield curve at shorter maturities has a positive slope, and then a
negative slope as maturities lengthen, resulting in a bell-shaped curve. In
effect, a market with a humped yield
curve could see rates of bonds with maturities of one to 10 years trumping
those with maturities of less than one year or more than 10 years.
Humped
vs. Regular Yield Curves
As opposed to a regularly
shaped yield curve, in which investors receive a higher yield for purchasing
longer-term bonds, a humped yield curve does not compensate investors for the
risks of holding longer-term debt securities.
For
example, if the yield on a 7-year
Treasury note was higher than the yield on a 1-year Treasury bill and that of
a 20-year Treasury bond, investors would flock to the mid-term notes,
eventually driving up the price and driving down the rate. Since the
long-term bond has a rate that is not as competitive as the intermediate-term
bond, investors will shy away from a long-term investment. This will
eventually lead to a decrease in the value of the 20-year bond and an
increase in its yield.
Types
of Humps
The humped yield curve does
not happen very often, but it is an indication that some period of
uncertainty or volatility may be expected in the economy.
When the curve is bell-shaped, it
reflects investor uncertainty about specific economic policies or conditions,
or it may reflect a transition of the yield curve from a normal to inverted
curve or from an inverted to normal curve. Although a humped yield curve is
often an indicator of slowing economic growth, it should not be confused with
an inverted yield curve. An inverted yield curve occurs when short-term
rates are higher than long-term rates or, to put it another way, when
long-term rates fall below short-term rates. An inverted yield curve indicates that investors expect the economy
to slow or decline in the future, and this slower growth may lead to lower
inflation and lower interest rates for all maturities.
When
short-term and long-term interest rates decrease by a greater degree than
intermediate-term rates, a humped yield curve known as a negative butterfly
results. The connotation of a butterfly is given because the intermediate
maturity sector is likened to the body of the butterfly and the short
maturity and long maturity sectors are viewed as the wings of the butterfly.
Introduction to the yield curve (Khan academy)
What is the Yield Curve, and Why is it Flattening? (video)
Summary of Yield Curve Shapes and Explanations
Normal Yield Curve
When bond investors expect the economy to hum along at normal rates of growth
without significant changes in inflation rates or available capital, the
yield curve slopes gently upward. In the absence of economic disruptions,
investors who risk their money for longer periods expect to get a bigger
reward — in the form of higher interest — than those who risk their money for
shorter time periods. Thus, as maturities lengthen, interest rates get
progressively higher and the curve goes up.
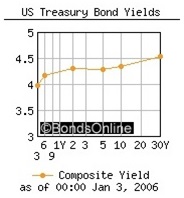
Steep Curve – Economy is improving
Typically the yield on 30-year Treasury bonds is three percentage points
above the yield on three-month Treasury bills. When it gets wider than that —
and the slope of the yield curve increases sharply — long-term bond holders
are sending a message that they think the economy will improve quickly in the
future.
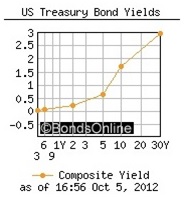
Inverted Curve – Recession is coming
At first glance an inverted yield curve seems like a paradox. Why would
long-term investors settle for lower yields while short-term investors take
so much less risk? The answer is that long-term investors will settle for
lower yields now if they think rates — and the economy — are going even lower
in the future. They're betting that this is their last chance to lock in
rates before the bottom falls out.
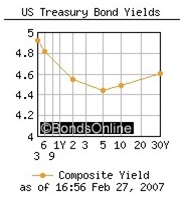
Flat or Humped Curve
To become inverted, the yield curve must pass through
a period where long-term yields are the same as short-term rates. When that
happens the shape will appear to be flat or, more commonly, a little raised
in the middle.
Unfortunately, not all flat or humped curves turn into fully
inverted curves. Otherwise we'd all get rich plunking our savings down on
30-year bonds the second we saw their yields start falling toward short-term
levels.
On the other hand, you shouldn't discount a flat or humped curve
just because it doesn't guarantee a coming recession. The odds are still
pretty good that economic slowdown and lower interest rates will follow a
period of flattening yields.
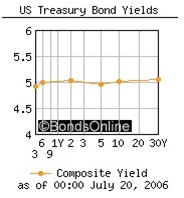
*****Special
topic I: Inverted Yield Curve could be
used to predict recession*****
How The Yield Curve Predicted Every Recession For The
Past 50 Years (video)
Animated yield curve 1965 – 2022 (video, FYI)
For discussion:
· What
is the shape the most recent yield curve?
· What
does it indicate or imply?
· Do
you believe it?
· What
can we do to prevent any possible losses in the future?
· ……
|
YieldCurve.com |
Yield Curve figures updated weekly since
October 2003 |
|||||
|
UK Gilt |
6 Month |
1 Year |
2 Year |
5 Year |
10 Year |
30 Year |
|
October 14, 2019 |
0.74 |
0.66 |
0.53 |
0.48 |
0.69 |
1.16 |
|
October 7, 2019 |
0.74 |
0.46 |
0.35 |
0.26 |
0.45 |
0.95 |
|
US Treasury |
3 Month |
6 Month |
2 Year |
5 Year |
10 Year |
30 Year |
|
October 14, 2019 |
1.69 |
1.68 |
1.60 |
1.56 |
1.73 |
2.20 |
|
October 7, 2019 |
1.70 |
1.65 |
1.41 |
1.35 |
1.53 |
2.01 |
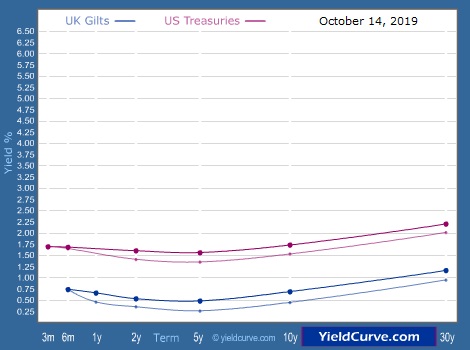
What Is An Inverted Yield Curve And How Does It Affect
The Stock Market? | NBC News Now (video)
Inverted Yield Curve
By WALDEN SIEW
https://www.investopedia.com/terms/i/invertedyieldcurve.asp
Fact checked by YARILET PEREZ on August 29,
2021, Reviewed by MICHAEL J BOYLE
What Is an Inverted Yield Curve?
An inverted yield curve represents a situation
in which long-term debt instruments
have lower yields than short-term debt instruments of the same credit
quality. An inverted yield curve is sometimes referred to as a negative yield curve.
KEY TAKEAWAYS
· An
inverted yield curve reflects a scenario in which short-term debt instruments
have higher yields than long-term instruments of the same credit risk
profile.
· Investor
preferences of liquidity and expectations of future interest rates shape the
yield curve.
· Typically,
long-term bonds have higher yields than short-term bonds, and the yield curve
slopes upward to the right.
· An inverted yield curve is a strong indicator
of an impending recession.
· Because
of the reliability of yield curve inversions as a leading indicator, they
tend to receive significant attention in the financial press.
Understanding Inverted Yield Curve
The yield curve graphically represents yields
on similar bonds across a variety of maturities. It is also known as the term structure of interest rates. A normal yield curve slopes upward,
reflecting the fact that short-term interest rates are usually lower than
long-term rates. That is a result of increased risk and liquidity premiums
for long-term investments.
When the yield curve inverts, short-term interest rates become
higher than long-term rates. This type of yield curve is the rarest of the
three main curve types and is considered to be a predictor of economic
recession. Because of the rarity of yield
curve inversions, they typically draw attention from all parts of the
financial world.
Historically, inversions of the yield curve have preceded recessions in the U.S.
Due to this historical correlation, the yield curve is often seen as a way to
predict the turning points of the business cycle. What an inverted yield curve really means is that most investors
believe that short-term interest rates are going to fall sharply at some
point in the future. As a practical matter, recessions usually cause interest
rates to fall. Inverted yield curves are almost always followed by
recessions.
An inverted Treasury yield curve is one of the
most reliable leading indicators of an impending recession.
Measuring Yield Curves
One of the most popular methods of measuring
the yield curve is to use the spread
between the yields of ten-year Treasuries and two-year Treasuries to
determine if the yield curve is inverted. The Federal Reserve maintains a
chart of this spread, and it is updated on most business days and is one of
their most popularly downloaded data series.
The 10-year to two-year Treasury spread is one of the most
reliable leading indicators of a recession within the following year. For as long as the Fed has published this
data back to 1976, it has accurately predicted every declared recession in
the U.S., and not given a single false positive signal. On Feb. 25, 2020, the spread dipped below zero, indicating an
inverted yield curve and signaling a possible economic recession in the U.S.
in 2020.
Maturity Considerations
Yields are typically
higher on fixed-income securities with longer maturity dates. Higher yields
on longer-term securities are a result of the maturity risk premium. All
other things being equal, the prices of bonds with longer maturities change
more for any given interest rate change. That makes long-term bonds riskier,
so investors usually have to be compensated for that risk with higher yields.
If an investor thinks
that yields are headed down, it is logical to buy bonds with longer
maturities. That way, the investor gets to keep today's higher interest
rates. The price goes up as more investors buy long-term bonds, which drives
yields down. When the yields for long-term bonds fall far enough, it produces
an inverted yield curve.
Economic Considerations
The shape of the yield curve changes with the
state of the economy. The normal or
upward sloping yield curve occurs when the economy is growing. Two
primary economic theories explain the shape of the yield curve; the pure
expectations theory and the liquidity preference theory.
In pure expectations theory, forward long-term
rates are thought to be an average of expected short-term rates over the same
total term of maturity. Liquidity preference theory points out that investors
will demand a premium on the yield they receive in return for tying up
liquidity in a longer-term bond. Together these theories explain the shape of
the yield curve as a function of investors’ current preferences and future
expectations and why, in normal times, the yield curve slopes upward to the
right.
During normal periods of economic growth, and
especially when the economy is being stimulated by low interest rates driven
by Fed monetary policy, the yield curve slopes upward both because investors
demand a premium yield for longer-term bonds and because they expect that at
some point in the future the Fed will have to raise short-term rates to avoid
an overheated economy and/or runaway inflation. In these circumstances, both
expectations and liquidity preference reinforce each other and both
contribute to an upward sloping yield curve.
When signals of an overheated economy start to appear or when
investors otherwise have reason to believe that a short-term rate hike by the
Fed is imminent, then these theories begin to work in the opposite directions
and the slope of the yield curve flattens and can even turn negative (and
inverted) if this effect is strong enough.
What
The Heck Is An Inverted Yield Curve? And Why Does It Predict A Recession?
Q.ai - Powering
a Personal Wealth MovementContributor, Sep 26, 2022,11:12am EDT
Key takeaways
·
A yield curve sheds light on what many people view as the
economy's current state and may be used to forecast changing business
dynamics, particularly a downturn.
·
Always be aware that the yield curve is an indicator, not a
forecast. Using the yield curve as the only point of data will not paint a
complete picture.
·
That said, an inverted yield curve has accurately predicted
the ten most recent recessions.
·
There has been so much emphasis on interest rates lately. The
truth, however, is far more complicated, with rates on individual bonds
frequently behaving very differently based on their maturity dates. This
article will explain a yield curve's importance and whether an inverted yield
curve means a recession is coming.
What is a yield curve?
A yield curve can be drawn for any type of bond,
from corporate bonds to municipal bonds. Let's go over the fundamentals of
yield curves, using the U.S. Treasury yield curve as an example.
Whenever
people buy Treasury securities, they effectively provide the government with
funds. Simply stated, this is a loan. In return, the Treasury pledges to
repay its investors after a certain amount of time (known as maturity) and
offers investors a predetermined rate of loan interest, known as the coupon.
While the
coupon on a U.S. Treasury bond doesn't fluctuate with time, the yield on the
bond will. This is because yield accounts for the continually fluctuating
values of Treasurys in the secondary market.
The yield to
maturity is the rate of return of all the cashflow earned from a bond,
including coupon and principal repayment. The yield to maturity is inversely
proportional to the bond price. If the bond price decreases, its yield to
maturity increases.
On an X/Y
graph, the horizontal X axis measures maturity. In the particular instance of
the U.S. Treasury yield curve, the X axis begins on the left with short-term
Treasury notes of maturities ranging from a few days up to a year, then moves
to Treasury notes with maturities ranging from one to 10 years, and settles
down on the right with bond maturities ranging from 20 to 30 years.
The current
yield for every maturity is on the vertical Y axis, with the lowest yield at
the bottom and higher yields at the top. A normal yield curve is upwards
sloping. This is because investors need to be paid more for investing their
money over a longer term. There is more risk in these investments, so the
yield has to be higher.
What does a yield curve tell
investors?
A yield curve sheds light on what many people
view as the economy's current state and may be used to forecast changing
business dynamics. The yield curve effectively represents the view of most
market players, so it provides a reasonably accurate picture of what is
happening within the economy.
If the market players are worried about
potential economic growth, short-term yields will rise as investors look to
invest in longer-term bonds. Additionally, short-term yields will rise if the
Federal Reserve increases interest rates, as the federal funds rate highly
impacts shorter maturity bonds.
During normal economic expansion, short-term yields
will be lower, and long-term yields will head higher. Seems simple
enough?
What happens when the yield
curve inverts?
An inverted
yield graph illustrates that long-term interest rates are less than
short-term lending rates. Instead of the rate increasing as you move the
maturity date further out, the yield actually decreases. Economists interpret
this as a warning sign for a recession in the economy.
We are
currently observing a major inversion of the yield curve with the 1-year
treasury now 50 bps above the 10-year treasury yield.
A true
inverted yield curve is not common. More
common is a flattening of the yield curve. This means there is uncertainty as
to which way the economy is headed, towards expansion or recession.
Does an inverted yield curve
mean there is a recession?
Does an
inverted yield curve indicate that a stock market drop and economic strife is
coming? Very honestly, there is merit to this idea. In fact, an
inverted yield curve has accurately predicted the ten most recent recessions.
With that
said, the yield curve doesn't cause downturns. Instead, it represents how
investors see the trajectory of the U.S. economy. If people believe a slump
is imminent, they will rush to buy long-term U.S. bonds.
When there are many buyers of long-term
treasuries in a short time, the yield drops. Since there is less demand for
shorter-term treasuries, the yield increases. The Federal Reserve also plays
a part here. Short-term bonds will increase their yields if they begin to
raise interest rates. This will naturally flatten the yield curve as the
yield on longer-term bonds stays the same.
Rising interest rates and
the yield curve
If long-term
interest rates drop past short-term interest rates, the yield curve inverts
and slides downwards. Long-term
investors invest in longer-term bonds because of the uncertainty and risk
surrounding the stock market in the near term. They would rather invest in a
long-term bond and lock in a yield than risk losing money investing in more
volatile stocks.
The shrinking yield spread between short- and
long-term lending rates is a flattened yield curve. Whenever this occurs, the
price of the bonds fluctuates accordingly. If the bond has a three-year
maturity, and the three-year yield falls, the bond's price will rise. The
bonds price changes to keep parity with changing rates and existing bonds in
the secondary market.
A flattened yield curve might indicate economic
weakening because interest rates and inflation will remain low for some time.
Investors anticipate modest growth in the economy, and bank lending slows.
When the yield
curve steepens, the difference between short-term and long-term bond interest
rates increases. This means that long-term bond yields are going up faster
than short-term bond rates, or short-term bond yields are declining while
long-term bond yields increase. As a result, long-term bond prices will fall
compared to short-term bond prices.
A steepening graph upward usually signals more economic
growth and inflationary expectations, which results in increased lending
rates. A 2-year note with a 1.5% yield and a 20-year note with a 3.5%
yield is one example of a steepening yield curve.
The bottom
line
The yield curve is an indicator, not a forecast. Using
the yield curve as the only point of data will not paint a complete picture.
You need to look at the economy as a whole, along with the trend of
inflation, the creation of new jobs, wage growth and what the Federal Reserve
says. Only then can you make educated guesses about the economy's future
direction.
As we said
above, the yield curve is a key economic indicator tied closely to
recessions, but it’s still only one piece of the puzzle. There are many
strategies and tactics available to investors looking for ways to beat the
market during times of high inflation, or even a recession. For instance,
Q.ai takes the guesswork out of investing.
Our artificial
intelligence scours the markets for the best investments for all manner of
risk tolerances and economic situations. Then, it bundles them up in handy
Investment Kits that make investing simple and – dare we say it – fun.
Best of all,
you can activate Portfolio Protection at any time to protect your gains and
reduce your losses, no matter what industry you invest in.
********* Special Topic 2: Steepening
Yield Curve ***************
What Is
a Steep Yield Curve? (https://www.thebalance.com/steepening-and-flattening-yield-curve-416920)
The gap between the yields
on short-term bonds and long-term bonds increases when the yield curve
steepens. The increase in this gap usually indicates that yields on long-term
bonds are rising faster than yields on short-term bonds, but sometimes it can
mean that short-term bond yields are falling even as longer-term yields are
rising.
For
example, assume that a two-year note was at 2% on Jan. 2, and the 10-year was
at 3%. On Feb. 1, the two-year note yields 2.1% while the 10-year yields
3.2%. The difference went from 1 percentage point to 1.10 percentage points,
leading to a steeper yield curve.
A steepening yield curve
typically indicates that investors expect rising inflation and stronger
economic growth.
Fed to Broadly Accept a Steepening Yield Curve:
Peterson’s Posen (youtube)
How the Fed’s Mission Impacts the Yield Curve (youtube)
Steepening Yield Curve (youtube)
For discussion:
Do you agree
with the Fed’s current QE monetary policy?
Treasury yield curve steepens to 4-year high as
investors bet on growth rebound
·
·
AuthorBrian
ScheidPolo Rocha Jan 13, 2021
·
·
The short-term outlook for
the U.S. economy may be dark, but bond investors see a bright future.
The U.S. Treasury yield
curve has steepened to levels not seen since 2016, signaling that investors
expect economic expansion and higher inflation in the coming years as coronavirus vaccines are distributed and incoming President Joe
Biden and a Democrat-controlled Congress are expected to pass another
substantial stimulus package.
The steepening curve is
likely a sign of economic recovery, said
Michael Crook, deputy chief investment officer at Mill Creek Capital. "It's very possible we're
on track for a period of above-trend economic growth unlike anything we've
seen in the last two decades, but it won't happen all at once."
The fly in the ointment could be the Federal Reserve, where regional
presidents have begun weighing the possibility of reducing the bank's $120
billion in monthly bond purchases if the economy sees a boom later this year.
Should the Fed stay on course, the yield curve would likely steepen further
as short-term rates remain pegged as growth and inflation accelerate.
Nominal Treasury yields have moved in "near lockstep" with
rates on Treasury Inflation-Protected Securities over the past week, an
indication that the climb's main driver was growth expectations, Crook said.
Inflation expectations
A steep yield curve — when
there is a large spread in interest rates between shorter-term Treasury bonds
to longer-term bonds — often precedes a period of economic expansion, as
investors bet that a central bank will be forced to raise rates in the future
to tamp down higher inflation. The opposite is true of
inverted yield curves, which suggest investors see the need for lower
interest rates to prop up slowing inflation.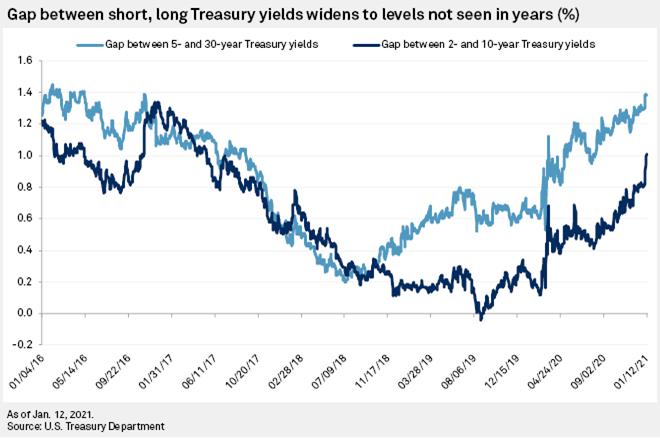
The U.S. Treasury 10-year yield settled at 1.15% on Jan. 12, up 19
basis points from Jan. 5, when Democrats won the races for Georgia's two
Senate seats and tilted the balance of Congress. The 10-year yield has risen
34 basis points in the roughly two months since the U.S. presidential
election and is now at its highest level since March 18, 2020, when the early
days of the coronavirus pandemic caused wild swings in bond markets.
Yields on 10-year Treasurys should reach 1.5% by the end of 2021 as
the rollout of the coronavirus vaccine, additional government stimulus and
overall economic recovery expectations push long bonds' yields up in the
first half of this year, Bruno Braizinha, a rates strategist with Bank of
America Securities, said in a Jan. 12 note.
The 30-year yield has surged 32 basis points since November's
Election Day, settling at 1.88% on Jan. 12, its highest close since Feb. 21.
Meanwhile, the gap between the five- and 30-year yields climbed to
138 basis points on Jan. 12, its highest point since November 2016. The gap
between the two- and 10-year yields closed at 101 points on Jan. 12, its
highest point since May 2017. Those gaps remained the same Jan. 12.
"The steepening signals
that inflation expectations are rising," agreed Mike O’Rourke, chief
market strategist at JonesTrading.
The 10-year breakeven rate, a measure of market inflation
expectations, settled at 2.06% on Jan. 11, its highest level since November
2018.
The rise in inflation
expectations, strategists said, will likely only reinforce the Fed's plan to
keep interest rates lower for longer and try to run inflation above 2% to
average out the years below that target threshold.
"The Fed states it won't
do much until it is confident inflation will run above 2% for a period of
time," O'Rourke said. "So for now, I don't expect them to take
any action."
The Fed's preferred inflation gauge, the core
personal consumption expenditures price index, rose by 1.4% in November 2020.
Patrick Leary, chief market strategist and senior trader at
Incapital, said that in addition to more stimulus, which would be funded
through borrowing, Treasury yields are also rising on optimism of a
coronavirus vaccine and the release of pent-up demand later this year as
social distancing mandates are eased or dropped entirely.
Fed far from a shift
Despite the recent rise, the 10-year yield remains at a historically
low level. A 1.15% yield would be unlikely to impair growth nor impact Fed
policy, Leary said.
"I don't think it is necessarily about a level that the Fed
would consider shifting its bond purchases but more about the reason yields
are rising, and what effect that rise is having on financial conditions and
more specifically the stock market," Leary said. "If the stock market hangs in there, I
don't expect the Fed to change from their current pace of bond
purchases."
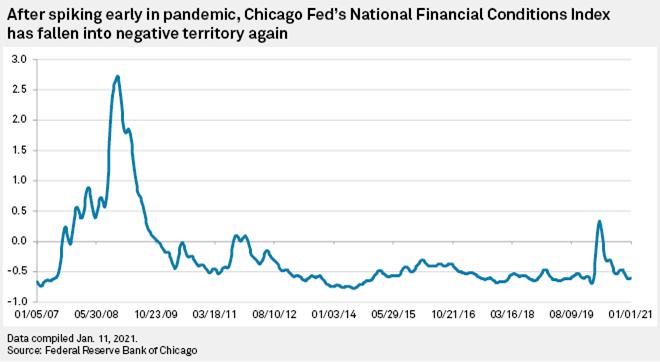
Financial conditions appear to be roughly the same as they were in
mid-February, with the Chicago Fed's
National Financial Conditions Index clocking in at -0.62. The weekly index
measures risk, credit and leverage conditions in money markets, debt and equity
markets and shadow banking systems. A negative value indicates that financial
conditions are looser — borrowing and spending are easier — than
average, while a positive value indicates tighter-than-average conditions.
The index has fallen from a recent spike to 0.33 in early April, largely due
to the Fed's accommodative monetary policies.
The Fed, in order to keep the economic recovery on track, needs to
keep financial conditions loose, said Gennadiy Goldberg, senior U.S. rates
strategist with TD Securities. An increase in real rates would signal
tightening conditions and could draw a reaction from the Fed.
"There isn't an exact rubric on where the Fed would step into
the market, but we think they would step in to prevent rates from rising
excessively," he said. "If they rise too dramatically in a short
span of time and if that increase is driven by expectations that the Fed
would be less supportive to the US economy, we think the Fed would signal
their displeasure and push back."
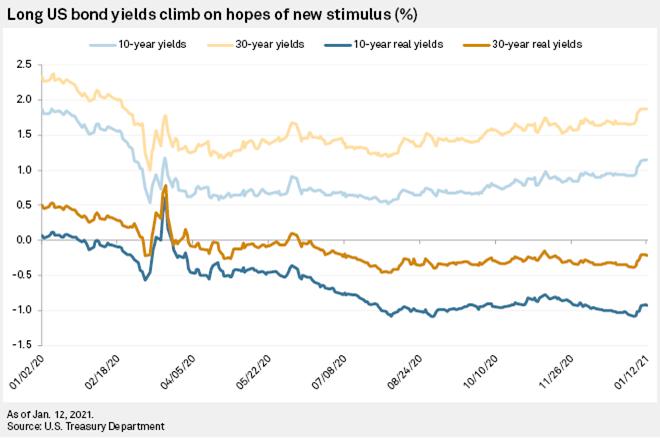
The 10-year real yield, which is adjusted for expected inflation,
settled at -0.93% on Jan. 12, up 15 basis points in a week.
But Goldberg said it would like to take a 50-basis-point increase in
real 10-year rates over several months to prompt a rethink of the Fed's
policy stance.
"The Fed is keen to avoid repeating the Taper Tantrum of 2013,
which set the recovery back significantly by prematurely tightening financial
conditions," he said.
During a Jan. 8 presentation before the Council on Foreign Relations,
Richard Clarida, the Fed's vice chairman, said he was "not
concerned" about the 10-year yield's rise above 1%.
"The way that I look at the bond market and yields is: You have
to try to understand why yields are moving up," Clarida said. "And
if yields are moving up because people are more optimistic about growth,
about a vaccine, are more confident, that we'll be able to achieve our two
percent inflation objective, then that is not something that that that troubles
me in the context of the overall picture."
Optimism about 2021 growth
has also raised the prospects that the Fed could start to pull back the pace
of its bond purchase program earlier than expected. The Fed is buying $80
billion in Treasurys and $40 billion in mortgage-backed securities each
month.
Atlanta Fed President Raphael Bostic told Reuters on Jan. 4 that he
hopes the central bank could "start to recalibrate" the program if
the economy rebounds strongly later this year, a sentiment shared by a few
other regional Fed presidents.
For his part, Clarida said his outlook suggests the Fed should keep
the program as-is throughout the rest of the year. Fed Chairman Jerome Powell
will also have a chance to push back on talk of an early tapering during a
Jan. 14 appearance at Princeton University.
Crook with Mill Creek Capital said in spite of the potential spike in
demand in the second half of this year and the likelihood of more fiscal
stimulus from a Democratic Congress, unemployment remains well above full
employment giving the Fed "plenty of breathing room" to keep rates
near zero and its accommodative policy in place.
"I believe the mistakes of the last cycle loom large at the Fed,
and they will be very cautious about restricting policy before it is
absolutely necessary," Crook said.
Homework chapter 7 part II (due with the second mid-term exam):
1.
Based on “What The Heck Is An Inverted Yield Curve? And Why
Does It Predict A Recession?” and other articles posted in this chapter,
please answer the following questions.
· What does inverted yield curve usually indicate to the market? Why?
· What are the causes of the current inverted yield curve this
time?
· What does an upward yield
curve indicate? What can we learn from an steepening yield curve?
· How to tell that the yield curve is inverted? (Hint: check the spread
between 10 year Treasury bond yield and 2 year Treasury note yield)
2. "Inverting yield curves, rising
inflation, weakening housing data, and slumping surveys have all driven the
increase (in recession probability) in the US," wrote Credit Suisse
analysts in a research note on Tuesday, forecasting that the probability of
the United States being in recession 6 and 12 months ahead is approximately
25%.
· What is your prediction about the likelihood of a mild recession in
2023?
Based
on the rates on Treasury securities provided by the Fed, draw a yield curve
of any day in October 2022.
And
discuss: the shape of the yield curve, its implication on future economy.
4.
What is
the Steepen Yield Curve? Under what state of the economy will a steepen yield
curve occur? Can the steepen yield curve appear in the rest of 2022? What about 2023? Why or why not?
Explainer: U.S. yield curve inverts again:
What is it telling us?
By David Randall and Davide Barbuscia
https://www.reuters.com/markets/us/us-yield-curve-inverts-again-what-is-it-telling-us-2022-07-05/
NEW YORK, July 5 (Reuters) - A closely watched
part of the U.S. Treasury yield curve inverted again on Tuesday, as investors
continue to price in the chance that the Federal Reserve's aggressive move to
bring down inflation will push the economy into recession.
Yields
on two-year Treasuries briefly rose above those of 10-year Treasuries for the
third time this year, a phenomenon known as a yield curve inversion that has
in the past preceded U.S. recessions.
It comes amid a chorus of growth warnings on Wall
Street, as a Fed intent on bringing inflation down from more than 40-year
highs sets the course for aggressive monetary policy tightening that investors
fear will also hurt U.S. growth.
Here is a quick primer on what a steep, flat or
inverted yield curve means, how it has predicted recession, and what it might
be signaling now.
WHAT SHOULD THE CURVE LOOK LIKE?
The U.S. Treasury finances federal government budget
obligations by issuing various forms of debt. The $23 trillion Treasury
market includes bills that mature in one month to one year, two- to 10-year
notes, and 20- and 30-year bonds.
The
yield curve, which plots the return on all Treasury securities, typically
slopes upward as the payout increases with the duration. Yields move
inversely to prices.
A
steepening curve typically signals expectations for stronger economic
activity, higher inflation, and higher interest rates. A flattening curve can
mean investors expect near-term rate hikes and are pessimistic about economic
growth.
WHAT
DOES AN INVERTED CURVE MEAN?
Investors
watch parts of the yield curve as recession indicators, primarily the spread
between three-month Treasury bills and 10-year notes , and the two- to
10-year (2/10) segment .
On
Tuesday, yields on two-year Treasuries rose as high as 2.95%, while the
10-year stood at 2.94%. The two-year, five-year part of the curve also
inverted for the first time since February 2020.
The
inversions suggest that while investors expect higher short-term rates, they
may be growing nervous about the Fed’s ability to control inflation without
hurting growth, even though policymakers say they are confident in achieving
a so-called "soft landing" for the economy
The Fed has already raised rates by 150 basis points
this year, including a jumbo-sized, 75 basis point increase last month.
The two- to 10-year segment of the yield curve
inverted in late March for the first time since 2019 and again in June.
The
U.S. curve has inverted before each recession since 1955, with a recession
following between six and 24 months, according to a 2018 report by
researchers at the San Francisco Fed. It offered a false signal just once in
that time. That research focused on a slightly different part of the curve,
between one- and 10-year yields.
Anu Gaggar, Global Investment Strategist for Commonwealth
Financial Network, found that the 2/10 spread has inverted 28 times since
1900. In 22 of these instances, a
recession followed, she said in June.
For the last six recessions, a recession on average
began six to 36 months after the curve inverted, she said.
Before March, the last time the 2/10 part of the
curve inverted was in 2019. The following year, the United States entered a
recession, which was caused by the pandemic.
WHAT DOES THIS MEAN FOR THE REAL WORLD?
While rate increases can be a weapon against inflation,
they can also slow economic growth by raising borrowing costs for everything
from mortgages to car loans.
The yield curve also affects consumers and
business.
When short-term rates increase, U.S. banks raise
benchmark rates for a wide range of consumer and commercial loans, including
small business loans and credit cards, making borrowing more costly for
consumers. Mortgage rates also rise.
When the yield curve steepens, banks can borrow
at lower rates and lend at higher rates. When the curve is flatter their
margins are squeezed, which may deter lending.
Analysis: U.S. yield curve flashing more
warning signs of recession risks ahead
By Davide Barbuscia, 7/28/2022
NEW YORK, July 27 (Reuters) - The U.S. government bond market is
sending a fresh batch of signals that investors are increasingly convinced
the Federal Reserve's aggressive actions to tame inflation will result in
recession.
The shape of the yield curve, which plots the return
on all Treasury securities, is seen as an indicator of the future state of
health of the economy, as inversions of
the curve have been a reliable sign of looming recession.
While Fed Chair Jerome Powell on Wednesday said
that he does not see the economy currently in a recession, spreads between
different pairings of Treasury securities - and derivatives tied to them -
have in past weeks moved into or toward an "inversion" when the
shorter dated of the pair yields more than the longer one. These join another
widely followed yield spread relationship - between 2- and 10-year notes -
that has been in inversion for most of this month. read more
"Curves are flattening and some are negative.
They're ultimately all telling you the same thing," said Eric Theoret,
global macro strategist at Manulife Investment Management.
A
steepening curve typically reflects expectations of stronger economic
activity, higher inflation and interest rates. A flattening curve can signal
expectations of rate hikes in the near term and a weaker economic outlook.
The
Fed is aiming to achieve a so-called "soft landing" that does not
entail an outright contraction in U.S. economic output and the rise in
joblessness that typically accompanies that. But the moves in the bond market
over the past week show waning confidence in the Fed's ability to achieve so
benign an outcome.
Some of those moves reversed slightly on Wednesday,
with rates at the short end of the curve turning lower on expectations of the
Fed being less likely to continue with super-sized hikes.
On Wednesday the Fed raised its benchmark overnight
interest rate by 0.75% to a range of between 2.25% and 2.50% as it flagged
weakening economic data. Powell said on Wednesday that achieving a soft
landing for the economy was challenging.
The
curve is indicating that the Fed will have to start cutting rates after
hiking.
The
part of the U.S. Treasury yield curve that compares yields on two-year
Treasuries with yields on 10-year government bonds has been inverted for most
of the past month and is around the most negative its been since 2000 on a
closing price basis.
Powell, however, has in recent months said that
the short-end of the yield curve was a more reliable warning of an upcoming
recession.
"The first 18 months of the yield curve has
100% of the explanatory power of the yield curve, and it makes sense ... because
if it's inverted that means the Fed is going to cut which means the economy
is weak", he said in March.
Some
analysts pointed to another measure, the differential between what money
markets expect the three-month federal funds rate to be in 18 months and the
current three-month federal funds rate. That went briefly into negative
territory on Tuesday, said George Goncalves, head of U.S. Macro Strategy at
MUFG.
That
spread - measured through overnight indexed swap (OIS) rates, which reflect
traders' expectations on the federal funds rate - was about 230 basis points
in March.
"It's very similar to looking at the Treasury
curve, these are all curves that trade with tiny spreads with each other,"
said Subadra Rajappa head of U.S. rates strategy at Societe Generale.
Another
measurement of the curve, the 2-year forward rate for 3-month bills , is
around the flattest since June 2021.
Fed
economists have said that near-term forward yield spreads - namely the
differential between the three-month Treasury yield and what the market
expects that yield to be in 18 months - are more reliable predictors of a
recession than the differential between long-maturity Treasury yields and
their short-maturity counterparts.
That spread has not gone negative, though it has
narrowed significantly from over 250 basis points in March to about 70 basis
points this week, said MUFG's Goncalves.
Another part of the curve that compares the yield
on three-month Treasury bills and 10-year notes has flattened dramatically
over the past few weeks, from nearly 220 basis points in May to around 15
basis points this week although it steepened after Powell's remarks.
Separately, futures contracts tied to the Fed's
policy rate showed this week that benchmark U.S. interest rates will peak in
January 2023, earlier than the February reading they gave last week. read
more
"Inverting yield curves, rising inflation,
weakening housing data, and slumping surveys have all driven the increase (in
recession probability) in the US," wrote Credit Suisse analysts in a
research note on Tuesday, forecasting that the probability of the United
States being in recession 6 and 12 months ahead is approximately 25%.
"It
is likely recession probabilities rise further in the coming months if policy
rate hikes cause further curve inversion and cyclical data continue to
deteriorate," they added.
Benchmark bond yields are ‘bad news’ for investors as the Fed hikes
rates by 0.75%. What it means for your portfolio
PUBLISHED WED, SEP 21
20222:00 PM EDTUPDATED WED, SEP 21 20223:32 PM EDT, Kate Dore, CFP®
https://www.cnbc.com/2022/09/21/what-the-inverted-yield-curve-means-for-your-portfolio-.html
KEY POINTS
·
Ahead of news from the Federal Reserve on Wednesday,
the 2-year Treasury yield climbed to 4.006%, the highest level since October
2007, and the 10-year Treasury reached 3.561% after hitting an 11-year high
this week.
·
When shorter-term government bonds have higher
yields than long-term, which is known as yield curve inversions, it’s viewed
as a warning sign for a future recession.
·
“Higher bond yields are bad news for the stock
market and its investors,” said certified financial planner Paul Winter,
owner of Five Seasons Financial Planning.
·
Young woman analyzing bills while writing in
diary.
“Higher bond yields are bad news for the stock
market and its investors,” said certified financial
planner Paul Winter, owner of Five Seasons Financial Planning in Salt Lake
City.
Higher bond yields create more competition for funds
that may otherwise go into the stock market, Winter said, and
with higher Treasury yields used in the calculation to assess stocks,
analysts may reduce future expected cash flows.
What’s more, it may be less attractive for companies
to issue bonds for stock buybacks, a way for profitable companies to return
cash to shareholders, Winter said.
How Federal Reserve rate
hikes affect bond yields
Market interest rates and
bond prices typically move in opposite directions, which means higher rates
cause bond values to fall. There’s also an inverse relationship between bond
prices and yields, which rise as bond values drop.
Fed rate hikes have
somewhat contributed to higher bond yields, Winter said, with the impact
varying across the Treasury yield curve.
Markets will see higher 10-year treasury yields,
says Komal Sri-Kumar
“The farther you move out on the yield curve and the
more you go down in credit quality, the less Fed rate hikes affect interest
rates,” he said.
That’s a big reason for the inverted yield curve
this year, with 2-year yields rising more dramatically than 10-year or
30-year yields, he said.
Consider these smart moves
for your portfolio
It’s a good time to revisit your portfolio’s diversification
to see if changes are needed, such as realigning assets to match your risk
tolerance, said Jon Ulin, a CFP and CEO of Ulin & Co. Wealth Management in
Boca Raton, Florida.
On the bond
side, advisors watch so-called duration, measuring bonds’ sensitivity to
interest rate changes. Expressed in years, duration factors in the
coupon, time to maturity and yield paid through the term.
Above all, investors must
remain disciplined and patient, as always, but more specifically if they
believe rates will continue to rise.
While clients welcome higher bond yields, Ulin
suggests keeping durations short and minimizing exposure to long-term bonds
as rates climb. “Duration risk may take a bite out of your savings over the next year
regardless of the sector or credit quality,” he said.
Winter suggests tilting stock allocations toward
“value and quality,” typically trading for less than the asset is worth, over
growth stocks, that may be expected to provide above-average returns. Often,
value investors are seeking undervalued companies expected to appreciate over
time.
“Above all, investors must
remain disciplined and patient, as always, but more specifically if they
believe rates will continue to rise,” he added.
Chapter 5 Diversification – Part
I Diversification
Investing in the S&P 500 (video)
“Members of a Yale class
entering their prime giving years had decided to set up a private fund,
manage the money themselves, and give it to the University 25 years later.
The worrisome part for Yale was that it would have no control over the fund,
which was going to be invested in high-risk securities. What if all the money
was blown by these “amateurs"? And what if the
scheme siphoned off other potential donations?
Happily, everything turned out
for the best. Despite Yale’s initial efforts to
discourage the Class of 1954 from its plan, the class persisted. And last
October, its leaders announced that their original collective investment of
$380,000 had grown to $70 million, earning unalloyed gratitude from the
University and the right to name two new Science Hill buildings after their
class.” ----- What is your opinion? Apple is one of
the stocks in their portfolio. So shall you pick stocks individually or buy
S&P500?
Shall you
diversify or not? Let’s compare AAPL with S&P500.
Stock returns from 1995-2015 - Apple and
S&P 500
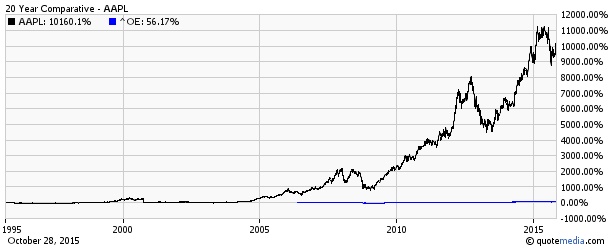
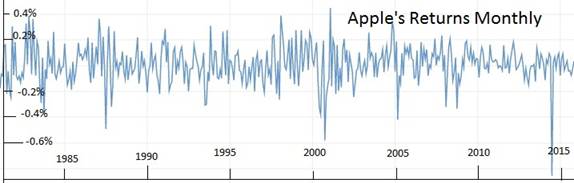
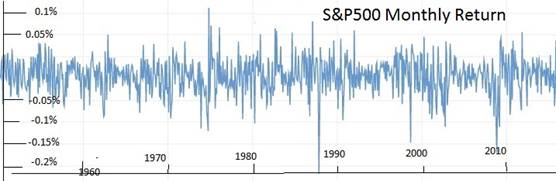
Regress
Apple’s Return on S&P500’s
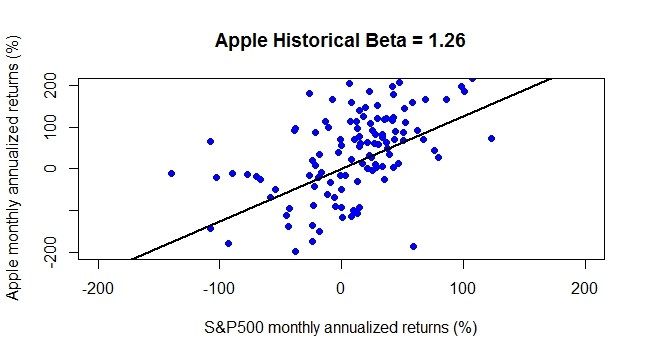
Apple and
S&P500’s Stand Deviation Comparison
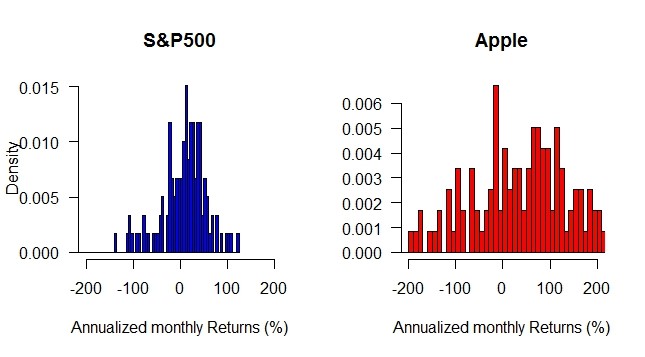
Questions for class discussion:
· Which one is better, the S&P500 or
Apple? In the past? About the future?
· Which one is riskier and which one’s
return is higher?
· Are you tempted to invest in APPLE or
SP500?
· How to find the next Apple?
· How much is the weight of Apple in
S&P500? For example, you have a total of $1,000 to invest in SP500, how
much you have invested in apple?
· How are the weights in the following
table calculated?
S&P
500 Companies by Weight
The S&P 500 component weights are listed from largest to
smallest. Data for each company in the list is updated after each trading
day. The S&P 500 index consists of most but not all of the largest
companies in the United States. The S&P market cap is 70 to 80% of the
total US stock market capitalization. It is a commonly used benchmark
for stock portfolio performance in America and abroad. Beating the performance of the S&P with less risk is the goal
of nearly every portfolio manager, hedge fund and private investor.

=========================================================================

https://www.slickcharts.com/sp500
For class discussion:
·
Based on the above information, what is your
conclusion?
·
When you invest in S&P500, how is the fund
allocated?

|
Ticker |
Company
Name |
6/30/2019 |
12/31/2018 |
12/31/2017 |
12/31/2016 |
12/31/2015 |
12/31/2014 |
|
MSFT |
Microsoft
Corp. |
4.20% |
3.73% |
2.89% |
2.51% |
2.48% |
2.10% |
|
AAPL |
Apple
Inc. |
3.54% |
3.38% |
3.81% |
3.21% |
3.28% |
3.55% |
|
AMZN |
Amazon.com
Inc. |
3.20% |
2.93% |
2.05% |
1.54% |
1.45% |
0.65% |
|
FB |
Facebook
Inc. |
1.90% |
1.50% |
1.85% |
1.40% |
1.33% |
0.72% |
|
BRK.B |
Berkshire
Hathaway Inc |
1.69% |
1.89% |
1.67% |
1.61% |
1.38% |
1.51% |
|
JNJ |
Johnson
& Johnson |
1.51% |
1.65% |
1.65% |
1.63% |
1.59% |
1.61% |
|
GOOG |
Alphabet
Inc. Class C |
1.36% |
1.52% |
1.39% |
1.19% |
1.26% |
0.85% |
|
GOOGL |
Alphabet
Inc. Class A |
1.33% |
1.49% |
1.38% |
1.22% |
1.27% |
0.84% |
|
XOM |
Exxon
Mobil Corp. |
1.33% |
1.37% |
1.55% |
1.94% |
1.81% |
2.16% |
|
JPM |
JPMorgan
Chase & Co. |
1.48% |
1.54% |
1.63% |
1.60% |
1.36% |
1.29% |
|
V |
Visa
Inc. |
1.23% |
1.10% |
0.91% |
0.76% |
0.84% |
0.56% |
|
PG |
Procter
& Gamble Co |
1.13% |
1.09% |
1.03% |
1.17% |
1.21% |
1.36% |
|
BAC |
Bank
of America Corp. |
1.05% |
1.07% |
1.26% |
1.16% |
0.98% |
1.04% |
|
VZ |
Verizon
Communications Inc |
0.97% |
1.11% |
0.95% |
1.13% |
1.05% |
1.07% |
|
INTC |
Intel
Corp. |
0.88% |
1.02% |
0.95% |
0.89% |
0.91% |
0.95% |
|
CSCO |
Cisco
Systems Inc |
0.96% |
0.93% |
0.83% |
0.79% |
0.77% |
0.78% |
|
UNH |
UnitedHealth
Group Inc |
0.95% |
1.14% |
0.94% |
0.79% |
0.63% |
0.53% |
|
PFE |
Pfizer
Inc. |
0.98% |
1.20% |
0.95% |
1.02% |
1.11% |
1.08% |
|
CVX |
Chevron
Corp. |
0.97% |
0.99% |
1.04% |
1.15% |
0.95% |
1.17% |
|
T |
AT&T
Inc. |
1.00% |
0.99% |
1.05% |
1.36% |
1.18% |
0.96% |
|
HD |
Home
Depot Inc |
0.94% |
0.92% |
0.97% |
0.85% |
0.94% |
0.76% |
|
MRK |
Merck
& Co Inc |
0.88% |
0.95% |
0.67% |
0.84% |
0.82% |
0.89% |
|
MA |
Mastercard
Inc. |
0.97% |
0.82% |
0.62% |
0.51% |
0.54% |
0.45% |
|
BA |
Boeing
Co. |
0.78% |
0.81% |
0.72% |
0.46% |
0.51% |
0.48% |
|
WFC |
Wells
Fargo & Co |
0.78% |
0.93% |
1.18% |
1.29% |
1.41% |
1.43% |
http://siblisresearch.com/data/weights-sp-500-companies/
What Is
the Weighting of the S&P 500? --- Understanding the Sectors and Market Caps
in the Index
BY TIM LEMKE
REVIEWED
BY DORETHA CLEMON on June 18, 2021
https://www.thebalance.com/what-is-the-sector-weighting-of-the-s-and-p-500-4579847
If
you’ve ever dipped so much as a toe into investing, you’ve probably heard
about the Standard & Poor’s 500 Index.
The S&P 500 is the most
common index used to track the performance of the U.S. stock market.
It is based on the stock prices of 500
of the largest companies that trade on the New York Stock Exchange or the
NASDAQ.
The
S&P 500 is often hailed as a representation of the entire U.S. stock
market and American business as a whole, but that is not entirely accurate.
While it does give you exposure to a broad swath of the economy, it is heavily weighted toward specific
market capitalizations, sectors, and industries, which is important to know
if you are seeking to build a diversified equity portfolio.
S&P 500 Market
Capitalizations
By
design, the S&P 500 includes only
large companies. Only the biggest companies with massive market
capitalizations ($9.8 billion or more) are included-think of large firms
such as Apple, Microsoft, Amazon.com, Facebook, and Alphabet, the parent
company of Google. One could argue that the S&P 500 is 100% weighted
toward large-cap firms, though many of the biggest firms would technically be
considered mega-cap.
It's
important for investors to know that while investing in the S&P 500 can
give great returns, they may be missing out on returns from medium-sized
and small companies. Those who are looking for exposure to smaller firms
should consider investments that track the S&P 400, consisting of the top mid-cap companies, or the Russell
2000, which features mostly smaller companies.
Those
who are looking for exposure to smaller firms should consider investments
that track the S&P 400, consisting of the top mid-cap companies, or the
Russell 2000, which features mostly smaller companies.
S&P
500 Sector and Industry Weighting
Any
attempt to diversify your stock portfolio should include some attempt at
diversification according to sector and industry. In fact, some investment
strategies suggest a perfect balance of sectors, because any sector can be
the best-performing group in any given year.
In
recent years, certain sectors and industries have performed better than
others, and that is now reflected in the makeup of the S&P 500. It also
means that many sectors won't be as represented in the index.
As
of December 22, 2020, the breakdown of sectors in the S&P 500
was as follows, according to State Street Advisors (the creator of the SPDR
S&P 500 ETF Trust, an exchange-traded fund that seeks to track the
performance of the S&P 500):
Information technology:
27.60%
Health care: 13.44%
Consumer discretionary:
12.70%
Communication services:
10.79%
Financials: 10.34%
Industrials:
8.47%
Consumer
staples: 6.55%
Utilities:
2.73%
Materials:
2.64%
Real
estate: 2.41%
Energy:
2.33%
As
you can see, the S&P is
heavily weighted toward tech, health care, and consumer discretionary stocks.
Meanwhile, there aren't as many
utilities, real estate companies, or firms involved in producing and selling
raw materials.
This weighting has changed
greatly over the years. Look back 25 years, and you’ll likely see far fewer
tech companies and more emphasis on consumer discretionary and communications
companies. Go back 50 years, and the mix will look even more different.
Why
It Matters
The weighting of the S&P
500 should be important to you, because the index is not always a representation
of the types of companies performing the best in any given year.
For example, while consumer discretionary may have been the top-performing
sector in 2015, it ranked third in 2017 and seventh in 2019. The
communications services sector was last in performance in 2017 but had ranked
second just one year earlier. The financials sector was dead last in 2007 and
2008, in the midst of the financial crisis, but it claimed the top spot in
2012 and performed third-best in 2019.4
Predicting which sectors
will perform best in any given year is very difficult, which is why
diversification is key.
How To Supplement the
S&P 500
Investing
in the S&P 500 through a low-cost index fund can provide a very strong
base for most stock portfolios. But to get broad diversification among market
caps and sectors, it may help to expand your reach.
Fortunately, there are
mutual funds and exchange-traded funds (ETFs) that provide exposure to
whatever you may be seeking. An investor who is looking to boost their
portfolio by purchasing small-cap stocks can buy shares of an index fund
designed to mirror the Russell 2000. If you want to invest more in financial
stocks, you can access funds comprising a wide range of banks and financial
services firms.
There are also mutual funds
and ETFs that offer broad exposure to the entire stock market, including all
market caps and sectors. Vanguard’s Total Stock Market ETF and the S&P
Total Stock Market ETF from iShares are two popular examples.
How to Calculate
the Weights of Stocks
The weights of your stocks can play a big role
in your investment strategy. Here's how to calculate them.
Calculating the weights of stocks you own can be
useful to your investment strategy. For example, if your investment goal is
to allocate no more than 15% of your portfolio to any single stock,
determining the weights of the stocks in your portfolio can tell you whether
or not you need to make any changes. Here's how to calculate the weights of
stocks, what this information means to you, and an example of how you can use
this.
Calculating the
weights of stocks
Basically, to determine the weights of each of your stocks,
you'll need two pieces of information. First, you'll need the cash values of each
of the individual stocks you want to find the weight of.
You'll also need your total portfolio value. If
you want to determine the weights of your stock portfolio, simply add up the
cash value of all of your stock positions. If you want to calculate the
weights of your stocks as a portion of your entire portfolio, take your
entire account's value – including stocks, bonds, cash, and any other
investments.
The calculation is simple enough. Simply divide
each of your stock position's cash value by your total portfolio value, and
then multiply by 100 to convert to a percentage.

What the weights
tell you
These weights tell you how dependent your portfolio's
performance is on each of your individual stocks. For example, your
portfolio's day-to-day fluctuations will depend much more on a stock that
makes up 20% of the total than one that only makes up 5%.
So, when your
heavily weighted stocks do well, your portfolio can go up quickly. For
example, if a stock with a 20% weight in a $50,000 portfolio doubles, it
would mean a $10,000 gain. On the other hand, if a stock only makes up 2% of
your portfolio, your gain would only be $1,000, even though the stock itself
was a home run.
Conversely,
heavily weighted stocks can drag your portfolio down during tough times,
while lower-weighted stocks will have a smaller effect.
Examining your
portfolio: An example
Let's say that you own the following stock investments: $2,000
of Microsoft, $3,000 of Wal-Mart, $2,500 of Wells
Fargo, and $4,000 of Johnson & Johnson. A quick
calculation shows that your total portfolio value is $11,500, and using the
formula mentioned earlier, you can calculate the weights of each of your four
stocks:
|
Stock |
Cash Value |
Weight |
|
Microsoft |
$2,000 |
17.4% |
|
Wal-Mart |
$3,000 |
26.1% |
|
Wells Fargo |
$2,500 |
21.7% |
|
Johnson & Johnson |
$4,000 |
34.8% |
In this example, Johnson & Johnson carries
twice the weight of Microsoft; therefore, a big move in J&J will have
double the effect on your overall portfolio than the same move in Microsoft
would.
Best stocks by year-to-date performance
10/17/2022
|
Symbol |
Company
Name |
Price
Performance (This Yr) |
|
OXY |
Occidental
Petroleum Corp. |
111.97% |
|
EQT |
EQT
Corp. |
86.84% |
|
MPC |
Marathon
Petroleum Corp. |
55.23% |
|
ENPH |
Enphase
Energy Inc. |
51.67% |
|
HES |
Hess
Corp. |
47.22% |
|
XOM |
Exxon
Mobil Corp. |
42.69% |
|
VLO |
Valero
Energy Corp. |
42.26% |
|
COP |
Conocophillips |
41.78% |
|
MRO |
Marathon
Oil Corp. |
37.52% |
|
CTRA |
Coterra
Energy Inc. |
37.47% |
|
MCK |
McKesson
Corp. |
36.73% |
|
DVN |
Devon
Energy Corp. |
36.50% |
https://www.nerdwallet.com/article/investing/best-performing-stocks
Worst stocks by year-to-date performance
10/17/2022

https://www.statmuse.com/money/ask/worst+performing+stocks+in+the+s%26p+500+in+2022
HW chapter 5 -1 (Due
with the second mid-term exam)
1
Calculate the monthly stock return and risk of Apple and SP500
in the past five years. And draw a conclusion regarding the tradeoff between
risk and return.
Steps:
From finance.yahoo.com, collect stock prices
of the above firms, in the past five years
Steps:
· Goto finance.yahoo.com, search for the companies
(Apple and S&P500, respectively)
· Click on “Historical prices” in the left
column on the top and choose monthly stock prices.
· Change the starting date and ending date to
“Oct 19th, 2017” and “Oct 19th, 2022”, respectively.
· Download it to Excel
· Delete all inputs, except “adj close” –
this is the closing price adjusted for dividend.
Evaluate the performance of each stock:
· Calculate the monthly stock returns.
· Calculate the average return
· Calculate standard deviation as a proxy for
risk
Please
use the following excel file as reference.
FYI Excel (or template) (From Oct 2017 – Sept 2022)
2. Calculate the most recent
weight of Apple in SP500. Also calculate the weight of GOOGLE,
Amazon, Netflix.
Hint: please use 30.079 trillion (30,079,000,000,000) as of October 17,
2022
for SP500 market cap. The website for this information is here:
https://www.slickcharts.com/sp500/marketcap
(Hint collect stock price, total shares outstanding. Market value = stock
price * shares outstanding.
Market value of each stock / 30.079 trillion = weight
of the stock in S&P500 index)
3.
Do you
agree with the author of “The S&P 500 is down over 20% this
year—here’s why it’s smart to keep investing anyway”. Do you think that it is a good opportunity
to invest in the stock market?
FYI: Invest
Now or Wait for the Stock Market to CRASH MORE (youtubve)
4.
Optional
question - Compare the above top 8 best and worst stocks in 2022 and give it a try to summarizes
about the similarities among stocks in each group, such as location, industry
sector, etc. if you can find any (optional)
What Apple’s Stock Split
Means for You
· By STEVEN RUSSOLILLO
WHAT IF APPLE NEVER SPLIT ITS STOCK? Apple has now split its stock
four times throughout its history. It previously conducted 2-for-1 splits on
three separate occasions: February 2005, June 2000 and June 1987. According
to some back-of-the-envelop math by S&P’s Howard Silverblatt,
if Apple never split its stock, you’d have eight shares for each original one
prior to the most recent split. So Friday’s $645.57 closing level would
translate to $5164.56 unadjusted for splits.
No Here are five things you need to know
about Apple’s stock split.
WHO DOES THE STOCK SPLIT IMPACT? Investors who
owned Apple shares as of June 2 qualify for the stock split, meaning they get
six additional shares for every share held. So if an investor held one Apple
share, that person would now hold a total of seven shares. Apple also
previously paid a dividend of $3.29, which now translates into a new
quarterly dividend of $0.47 per share.
WHY IS APPLE DOING THIS?
The iPhone and iPad maker says it is trying to attract a
wider audience. “We’re taking this action to make Apple stock more accessible
to a larger number of investors,” Apple CEO Tim Cook said in
April. But the comment also marked an about-face from two years earlier. At
Apple’s shareholder meeting in February 2012, Mr. Cook said he didn’t see the
point of splitting his company’s stock, noting such a move does “nothing” for
shareholders.
WILL APPLE GET ADDED TO THE DOW? It’s unclear
at the moment, although a smaller stock price certainly makes Apple a more
attractive candidate to get added to blue-chip Dow. Apple, the bigge,
your screens aren’t lying to you. Shares of Apple Inc. now trade under $100,
a development that hasn’t happened in years.
Apple’s unorthodox 7-for-1 stock split,
announced at the end of April, has finally arrived. The stock started trading
on a split-adjusted basis Monday morning, and recently rose 1% to $93.14.
In a stock split, a company increases the
number of shares outstanding while lowering the price accordingly. Splits
don’t change anything fundamentally about a company or its valuation, but
they tend to make a company’s stock more attractive to mom-and-pop investors.
Apple shares rallied 23% from late April, when the company announced the
split in conjunction with a strong quarterly report, through Friday.
A poll conducted by our colleagues
at MarketWatch found 50% of respondents said they would buy Apple
shares after the split. Some 31% said they already owned the stock and 19%
said they wouldn’t buy it. The survey received more than 20,000 responses.
st U.S. company by market capitalization,
has never been part of the historic 30-stock index, a factor that many
observers attributed to its high stock price. The Dow is a price-weighted
measure, meaning the bigger the stock price, the larger the sway for a
particular component. That is different from indexes such as the S&P 500,
which are weighted by market caps (each company’s stock price multiplied by
shares outstanding).
WILL APPLE KEEP RALLYING? Since the financial
crisis, companies that have split their stocks have struggled in the short
term and outperformed the broad market over a longer time horizon. Since
2010, 57 companies in the S&P 500 have split their shares. Those stocks
have averaged a 0.2% gain the day they started trading on a split-adjusted
basis, according to New York research firm Strategas Research
Partners. A month later, they have risen just 0.5%. But longer term, the
average gains are more pronounced. Since 2010, these stocks have averaged a
5.4% increase three months after a split and a 28% surge one year
later, Strategas says.
WHAT IF APPLE NEVER SPLIT ITS STOCK? Apple has
now split its stock four times throughout its history. It previously
conducted 2-for-1 splits on three separate occasions: February 2005, June
2000 and June 1987. According to some back-of-the-envelop math by
S&P’s Howard Silverblatt, if Apple never split its stock, you’d have
eight shares for each original one prior to the most recent split. So
Friday’s $645.57 closing level would translate to $5164.56 unadjusted for
splits.
For class discussion:
Why Apple needs to do so? Is that necessary? Why Google does not
follow Apple and make its stock price cheaper and affordable?
The S&P 500 is down over 20% this year—here’s why it’s smart
to keep investing anyway
Published Tue, Oct 4 20222:59 PM EDT, Ryan Ermey
This year is currently looking like one of the roughest ever for
the stock market.
Through the first nine
months of 2022, the S&P 500 index lost 23.9%. Only five full calendar
years have produced worse returns: three years from the Great Depression,
2008 and 1974.
But if market history paints a dire picture for what’s gone on
so far this year, it also offers a
silver lining for long-term investors. Bear markets like the current one
tend to be short, and investors who keep their cool tend to make out
alright.
That’s what Charles Rotblut, vice president at the American
Association of Individual Investors, pointed out in a recent tweet. “Not only is the current bear market well
within the typical range of past bears, those who stick w/ their allocations
get rewarded for doing so,” he wrote.
The data he’s referencing is from CFRA chief investment
strategist Sam Stovall, who analyzed 13
bear markets — defined as a decline of 20% or more from market peaks —
dating back to 1945.
The current bear falls
under what Stovall calls “garden variety” bear markets — those that feature a
stock market slide between 20% and 40%. The others he calls “mega-meltdown” bears, which saw drawdowns
of more than 40%.
The latter sort are especially tough for investors, lasting for
just short of two years on average, with an average decline of 51%.

The garden-variety
bear is somewhat less intimidating. The average drawdown during these periods
is 27%, and they tend to last for 13 months on average. And
importantly for investors, it took only 27 months for stocks to return to
their peaks after these down periods, on average. That compares with an
average recovery time of nearly five years for the harsher bears.
Two years may seem like a long time to stare down red numbers in
your portfolio, and five may seem like an eternity. But if you’re invested
for decades, a period of a few years is a blip.
More importantly,
you’d be wise to add to your portfolio during down markets, rather than
selling, says Rotblut.
“Have you ever looked at the chart and thought, ‘I wish I bought
that stock when it was down at this price?’ Then why aren’t you buying now?”
he says. “No one knows where the bottom is, but we do know stocks are on sale
right now.”
The bottom of the
market could be well into the future, and selling now before things get worse
could, in the long run, boost your returns. But it would most likely be a
mistake, experts say, for two reasons.
One: Even if you’re
right about the market going down further, selling now would require you to
peg the right time to get back in in order to turn a profit. “If you’re going to cash, what is your rule for
getting back into the market? What are you going to use as your marker? And
what happens if you don’t act then?” says Rotblut.
Timing the market is
extraordinarily difficult, and getting it wrong could cripple your returns. A $10,000 investment in a fund tracking the
S&P 500 at the end of 2006 would have grown to nearly $46,000 by the end
of 2021, according to Putnam Investments.
But subtract the 10 best days from that 15-year period, and the
total declines to about $21,000. “Time, not timing, is the best way to
capitalize on stock market gains,” Putnam researchers say.
The other reason: Although past returns are no guarantee of
future results, markets have historically rewarded investors for buying into
the market after it’s had the kind of slide investors have seen so far this
year.
As measured by the
Wilshire 5000 — a broad U.S. stock market index — the first nine months of
2022 rank among the worst 20 nine-month periods of the last half century,
according to data from Compound Capital Advisors.
In all but one of those instances, the index logged a positive
return in the one-year period following the nine-month decline, with an
average return of 12%. Over the next three years, the index was positive each
time, with an average gain of 41%.
Simply put in a tweet from Compound CEO Charlie Bilello: “Has selling AFTER large 9-month declines been a good strategy
for long-term investors in the past? No.”
Chapter 5 Part II – Mutual Funds and ETF
Want to improve your personal
finances? Start by taking this quiz to get an idea of your investment risk
tolerance – one of the fundamental issues to consider when planning your
investment strategy, either alone or in consultation with a financial services professional.
Discussion: Based on your risk tolerant score, which of the follow
shall you choose? Why?
Example: Optimally
diversified portfolio
1.
3. 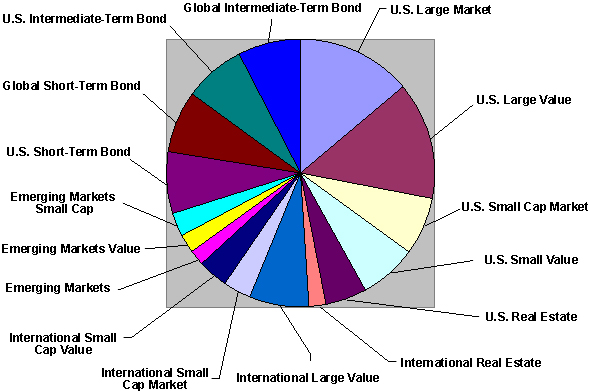
For class discussion:
1.
What is value stock? Example? What is a
Value Stock - Value Investing (youtube)
2. What is
small cap value? Example? Large cap?
Small Cap Stocks vs Large Cap Stocks - Which are Better
Investments
3. Shall
we consider bond for diversification purpose?
4. Shall we
include international stocks to establish a diversified portfolio?
5. What
benefits can be gained from diversification with bond and international
stocks?
How Diversification Works (youtube)
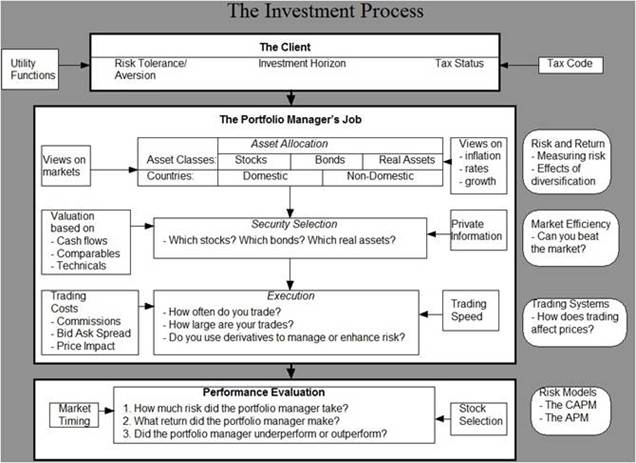
Mutual fund vs.
ETF
What
is ETF? (Video)
Mutual
Funds vs. ETFs - Which Is Right for You? (Video)
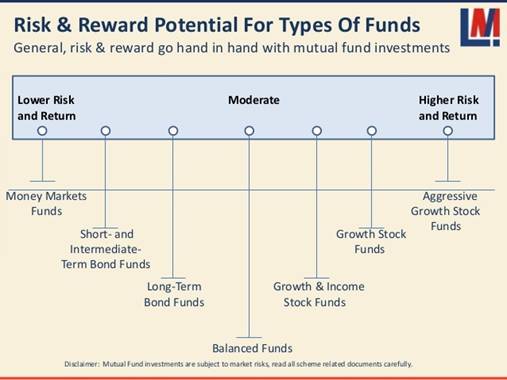
For discussion:
What one of the above funds
is the most favorite one to you? Why?
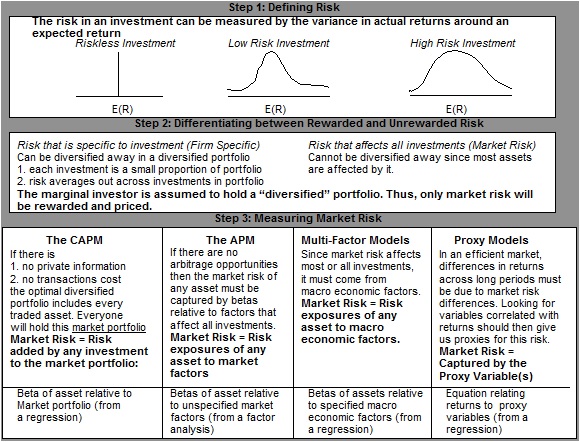
1. How
to tell the risk level based on standard deviation shown in step 1?
2. What
is the difference between rewarded risk and unrewarded risk? Example?
3. Write
down the CAPM model.
4. Among
the four models shown in step 3, which one is the best?
Exchange traded funds (ETFs) (Khan academy)
Ponzi schemes (Khan academy)
For class discussion:
What
is ETF?
What
is the pro and cons to invest in ETF?
Examples
of ETF?
Examples of ETF: Powershares (QQQ) – NASDAQ 100 Index (Large-cap
growth stocks)
Understanding QQQE:
Nasdaq-100 Equal Weighted Index Shares ETF (Video)
For class discussion:
When we compare QQQ with S&P500, which one is
better in terms of performance in the past ten years?
Which one is riskier? Why?
Average Volume: 36.1 million
SPY
vs. QQQ: Which ETF Wins in
2022?
Since the
bull-market friendly QQQ has beat SPY more often than not over the last 20
years, it should never be counted out.
By MarketBeat
Staff, September 6, 2022
https://www.entrepreneur.com/finance/spy-vs-qqq-which-etf-wins-in-2022/434753
Barring a
miraculous late year run, the major indices will finish in the red for the
first time since 2018. That means the ETFs that track them, will drag down
many investment account values after three years of double-digit gains.
Over the next four
months, two of the most popular ETFs, the SPDR S&P 500 ETF Trust
(NYSEARCA:SPY) and the Invesco QQQ Trust (NASDAQ:QQQ) will be battling it out
for the dubious honor of 2022 ‘winner’. Together the funds hold more than
$500 billion in investor assets.
Last year’s
race came down to the wire with SPY sticking its nose out for a 28.7% to
27.4% victory. It ended a four-year winning streak for QQQ including 2020’s
48.4% to 18.3% drubbing.
Despite their
potential to produce dramatically different returns, SPY and QQQ do have a
lot in common. Since 2000, the correlation of their annual returns is a
remarkably high 0.92. That makes sense considering more than three-fourths of
QQQ’s holdings are also in SPY—and the top holdings are very similar.
Yet there also
some subtle differences that can account for major performance disparities.
It is these differences that will
determine if SPY (down 17.4% year-to-date) holds its lead on QQQ (down 25.8%)
and notch its first back-to-back title since 2005-2006.
#1 Risk-On or Risk-Off?
If the economy
fends off recessionary pressures and inflation shows signs of cooling this
would likely be a welcomed development for equity investors. In turn, a less
hawkish Fed would be icing on the cake. This
could lead to improved consumer confidence and market sentiment. The opposite scenario of persistent
inflation, deep recession, and aggressive Fed policy could make things worse.
In the bullish case, stocks would return to “risk-on”
mode. The advantage would go to QQQ. Why? The Nasdaq-100 index tends to do
better when markets head higher. This reflects the higher risk nature of its
components and its 1.29 beta relative to the broad U.S. market. Under the
bearish scenario, the less risky S&P 500 tracked by the SPY would
probably outperform.
#2 Sector
Performance
We often hear
the Nasdaq called the ‘tech-heavy’
index and indeed it is. Almost
half of its weight is in the technology sector. In the S&P 500, technology
names account for around one-fourth of the benchmark.
In both cases technology is the largest sector
weighting, but it is the double weighting in QQQ that accounts
for much of its day-to-day return differences with SPY. Tech has been the worst performing sector so far this year and a big
reason why QQQ is lagging. More of the same would all but clinch a W for
SPY, while a fourth quarter tech rally is QQQ’s best hope for a dramatic
comeback win.
The energy
sector could also be a factor. By far the best performing economic group
year-to-date, even SPY’s 4% energy
weighting could contribute to outperformance. There are no energy names in QQQ.
Then there are financials. They are the third
largest sector in SPY at a 13% weighting but represent less than 1% of QQQ.
Strong bank earnings reports boosted by higher interest rates could really
help SPY distance itself from QQQ.
#3 Big Stock
Influencers
At the
individual stock level, SPY and QQQ appear to be close cousins when comparing
their respective top holdings. In fact, the top five are
identical—Apple, Microsoft, Amazon, Tesla, and Alphabet. What isn’t identical though is how much
the big five are weighted in each fund. They command more than 40% of the QQQ
portfolio. In SPY their combined weighting is a more diluted 22%.
This means
that the relative weighting of these lead horses can create some major return
differences. Apple is the prime
example. It has a 13.7% weight in QQQ and a 7.3% weight in SPY, a
difference of 6.4%. So, when Apple shares outperform the S&P 500, the
Nasdaq, and thereby QQQ, has a good chance to outperform.
The same goes
for stocks like Microsoft, Amazon, and Tesla which have significantly larger
weights in QQQ. Unfortunately for QQQ investors, all three have
underperformed SPY year-to-date offsetting Apple’s modest outperformance.
Putting weights aside, 62 of QQQ’s 102 holdings
are lagging SPY year-to-date. This in addition to the risk-off trade, tough
year for tech, and certain mega cap underperformers has made it virtually impossible
for QQQ to gain ground on SPY.
A summer run
did help QQQ briefly close the gap on SPY before Fed Chairman Powell’s
hawkish tone relinquished about half of its gains. Since the bull-market friendly QQQ has beat SPY more often than not
over the last 20 years, it should never be counted out. But a lot will have
to fall into place for the tech-dominated fund to win in 2022.
ETF Battles: QQQ Vs. SPY,
Who Wins?
https://seekingalpha.com/instablog/18416022-etfguide/5418872-etf-battles-qqq-vs-spy-who-wins
Mar. 10, 2020
7:38 PM ETInvesco QQQ ETF (QQQ), SPY
This is an
excerpt from the video titled, ETF Battles: QQQ vs. SPY with Ron DeLegge at
ETF guide.
During normal
markets, daily trading volume for QQQ averages around 75 million shares
while SPY averages 173 million shares.
During the
latest market correction, daily volume skyrocketed to record levels with QQQ
topping 149,247,100 shares traded in a single session while SPY booked
385,764,000 shares. (Both trading volume peaks occurred on Feb. 28, 2020)
Cost
The first
category for comparing QQQ vs. SPY is cost. Who wins? SPY charges annual
expenses of just 0.09% compared to 0.20% for QQQ. Put another way, QQQ is
more than double the cost of SPY! While SPY isn't necessarily the cheapest
S&P 500 ETF, compared to QQQ it's a bargain. Bid ask spreads are another
element of an ETF costs. And ETFs with tight bid ask spreads reduce the
frictional trading costs associated with buying and selling funds. In this
regard, QQQ and SPY are evenly matched with both funds having very narrow
bid ask spreads that hover around 0.01%.
Dividends
First, both funds
distribute dividends from their equity holdings every quarter. SPY has a
12-month trailing yield of 1.90% while QQQ is at 0.77%. Clearly, SPY wins
but there's more behind the reason why. SPY, unlike QQQ, contains
significant exposure to key dividend paying industry sectors like financials,
real estate, and utilities. On the other hand, QQQ is overweight technology
(63.91% of its portfolio is committed to this sector at the time of
publication) and the tech sector is a historically low dividend yielding
industry group. SPY beats QQQ by having a higher dividend. Also the fact
that SPY obtains its dividends across a far more diversified base of 11
industry groups compared to the technology heavy QQQ makes it a winner.
Diversification
Almost 65%
of QQQ's sector exposure is to technology companies, which isn't very
diversified at all and if you blindfolded me and asked me to guess what type
of ETF that QQQ is, I would immediately describe it as an industry sector
fund. In contrast, SPY beats QQQ on diversification because not only does
it have more stocks - 500 - but the stocks it owns are scattered across 11
different industry groups which include technology along with a whole
bunch of other important industry sectors like healthcare, materials, and
industrials.
Performance
Excluding
dividends, QQQ has gained around 20% over the past year while SPY has
gained around 7%. So QQQ wins the short-term performance race.
What about longer time frames? QQQ outperformed SPY over the past 10 and 15
year period too. But if we go back 20 years, SPY wins because it gained
around 197% not including dividends while QQQ gained just 101%. At the end of
the day, QQQ's lights out performance during the past 1, 10, and 15 years is
largely due to its concentrated portfolio in technology. SPY's less
concentrated exposure to tech during this time frame resulted in a lower
return. Nevertheless, over 20 years SPY did manage to outperform QQQ by a not so small 96%. This is a split
decision with QQQ winning the shorter term performance race while SPY wins
the longer-term race.
Final Winner
of ETF Battles
Who wins the
ETF battle between QQQ vs. SPY? The final winner of today's hard fought
battle between QQQ and SPY is...the SPDR S&P 500 ETF (SPY). It's got
lower cost, better diversification, a higher dividend yield, and better
long-term performance.
How to tell the performance of a
fund?
Alpha, often considered the
active return on an investment, gauges the performance of an investment
against a market index used as a benchmark, since they are often considered to represent the market’s movement as a whole. The
excess returns of a fund relative to the return of a
benchmark index is the fund's alpha.
Alpha is most often used for
mutual funds and other similar investment types. It is often represented as a single number (like 3 or -5), but
this refers to a percentage measuring how the portfolio or fund
performed compared to the benchmark index (i.e. 3% better or 5% worse).
Alpha is often used with beta,
which measures volatility or risk, and is also often referred to as “excess return” or “abnormal rate of return”. (Investorpedia)
Value or Growth Stocks: Which Is Better?
By MARK P. CUSSEN Updated March 18, 2022, Reviewed by MARGUERITA
CHENG, Fact checked by RYAN EICHLER
https://www.investopedia.com/articles/professionals/072415/value-or-growth-stocks-which-best.asp
Growth stocks are those companies that are considered to have
the potential to outperform the overall market over time because of their
future potential. Value stocks are classified as companies that are currently
trading below what they are really worth and will thus provide a superior
return. Which category is better? The
comparative historical performance of these two sub-sectors yields some
surprising results.
KEY TAKEAWAYS
·
Growth stocks are expected to
outperform the overall market over time because of their future potential.
·
Value stocks are thought to
trade below what they are really worth.
·
The question of whether a
growth or value stock strategy is better must be evaluated in the context of
the investor's time horizon and risk.
What is Value Investing?
Growth Stocks vs. Value Stocks
The concept of a growth stock versus one that is considered to
be undervalued generally comes from the fundamental stock analysis.
Growth
Growth stocks are considered by analysts to have the potential
to outperform either the overall markets or else a specific subsegment of
them for a period of time.
Growth stocks can be found in small-, mid-, and large-cap
sectors and can only retain this status until analysts feel that they have
achieved their potential. Growth companies are considered to have a good
chance for considerable expansion over the next few years, either because
they have a product or line of products that are expected to sell well or
because they appear to be run better than many of their competitors and are
thus predicted to gain an edge on them in their market.
Value
Value stocks are usually larger, more well-established companies
that are trading below the price that analysts feel the stock is worth,
depending upon the financial ratio or benchmark that it is being compared to.
For example, the book value of
a company’s stock may be $25 a share, based on the
number of shares outstanding divided by the company’s
capitalization. Therefore, if it is trading for $20 a share at the moment,
then many analysts would consider this to be a good value play.
Stocks can
become undervalued for many reasons. In some cases, public perception will push the price down, such
as if a major figure in the company is caught in a personal scandal or the
company is caught doing something unethical. But if the company’s financials are still relatively solid, then
value-seekers may see this as an ideal entry point, because they figure that
the public will soon forget about whatever happened and the price will rise
to where it should be.
Value stocks will typically trade at a discount to either the
price to earnings, book value, or cash flow ratios. Of course, neither outlook is always correct, and some stocks
can be classified as a blend of these two categories, where they are considered
to be undervalued but also have some potential above and beyond this. Morningstar Inc., therefore, classifies
all of the equities and equity funds that it ranks into either a growth,
value, or blended category.
Growth vs. Value: Performance
When it comes to comparing the historical performances of the
two respective sub-sectors of stocks, any
results that can be seen must be evaluated in terms of time horizon and the
amount of volatility, and thus risk that was endured in order to achieve them.
Value stocks are
at least theoretically considered to have a lower level of risk and
volatility associated with them because
they are usually found among larger,
more established companies. And
even if they don’t return to the target price that analysts
or the investor predict, they may still offer some capital growth, and these
stocks also often pay dividends as well.
Growth stocks,
meanwhile, will usually refrain from paying out dividends and will instead
reinvest retained earnings back into the company to expand. Growth stocks'
probability of loss for investors can also be greater, particularly if the
company is unable to keep up with growth expectations.
For example, a company with a highly touted new product may
indeed see its stock price plummet if the product is a dud or if it has some
design flaws that keep it from working properly. Growth stocks, in general,
possess the highest potential reward, as well as risk, for investors.
Studies
Although the above paragraph suggests that growth stocks would
post the best numbers over longer periods, the opposite has actually been
true. Many studies point to value
having outperformed growth style over long-term periods. However, looking at
more recent data, value did outperform for the first 10 years of the 2000s,
but growth has outperformed over the last 10 years. Take note that dividends
likely play a key role in helping value outperform over longer-periods.
Going back to 1926, value has had numerous periods of
outperformance relative to growth. Again, despite the long-term
outperformance, growth has reigned supreme over the last decade. With that,
the S&P 500 is made up of roughly 40% technology stocks.
What Percent of
the S&P 500 Is Growth vs. Value?
The S&P 500 is not broken down into growth and value stocks.
However, the two sectors that are often considered growth are technology and consumer discretionary, which make up 40%
of the index. Meanwhile, value sectors—financials,
industrials, energy, and consumer staples—make up
roughly 29% of the index.
What Is an Example of a Value Stock vs. Growth Stock?
·
An example of a value stock would be a bank, such as JPMorgan
Chase (JPM). While key growth is often found in the technology space, such as
Google (GOOG).
Are Growth or
Value Funds Better for the Long-Term?
·
Value has outperformed growth stocks over the longer-term,
however, growth has been outperforming for the last 10 years.
The Bottom Line
The decision to invest in growth vs. value stocks is ultimately
left to an individual investor’s preference, as well
as their personal risk tolerance, investment goals, and time horizon. It
should be noted that over shorter periods, the performance of either growth
or value will also depend in large part upon the point in the cycle that the
market happens to be in.
For example,
value stocks tend to outperform during bear markets and economic recessions,
while growth stocks tend to excel during bull markets or periods of economic
expansion. This factor should, therefore, be taken into account by shorter-term
investors or those seeking to time the markets.
HW chapter 5 -2 (Due with the second mid-term exam)
1.
Work on this investment
risk tolerance test and report your score. Make a
self-evaluation about yourself in terms of your risk tolerance level. Based
on your risk level, set up a investment strategy! Please provide a rationale.
2.
Compare ETF with mutual fund
3.
Compare QQQ with SPY
4.
What is Alpha? What is Beta? What is CAPM?
5.
What is Value stock? Example? What is Growth stock?
Example? Which is better: Growth stock vs. Value stock? Why?
FYI: How Value
Index ETFs Are Outperforming Their Growth Counterparts
(video)
Here are the 7 biggest investing mistakes you want to avoid,
according to financial experts
Here are the common mistakes
that the average investor makes with their money.
Updated Thu, Apr 7 2022,
Elizabeth Gravier
https://www.cnbc.com/select/biggest-investing-mistakes/
It’s no secret that the
pandemic brought a wave of new investors eager to give a shot at playing the
market.
In fact, a Charles Schwab
study found that 15% of all current
U.S. stock market investors got their start in 2020 — giving rise to what
Schwab calls the “Investor Generation.”
The pandemic prompted the perfect timing to begin investing:
stocks became cheaper to buy as the market dipped, savings account interest
rates got slashed in half and many young consumers were stranded at home with
nothing much else to do.
Plus, now that many brokerage firms now offer accounts with no
minimums and zero-commission trading, just about anyone can start investing,
even with a small amount of money.
To help guide this new
generation of investors, as well as their more experienced counterparts,
Select spoke with a handful of certified financial planners about what to
watch out for.
Here are the seven biggest
investing mistakes they say are the most common.
·
Constantly watching the markets
·
Chasing the trends
·
Following bad advice from social media
·
Not giving your investments time to grow
·
Investing money you’ll soon need
·
Having unclear investing goals
·
Delaying investing altogether
Mistake 1: Constantly watching the markets
Of all the mistakes we heard,
this one came up the most.
“I have told many clients to
turn off their TVs and stop watching the daily market news,” Danielle
Harrison, a Missouri-based CFP at Harrison Financial Planning, tells Select.
While it’s normal (and
generally advised) to keep an eye on what’s happening in the overall economy, it’s easy to get swept up in the
excitement or doom and gloom of it all. The markets are constantly moving and
trying to follow along in real-time can lead you to continuously checking or
changing your investments when you’re better off leaving them alone for the
long haul.
“You’re likely to perform
worse than if you just stuck with your original strategy in the first place,”
says Douglas Boneparth, a New York City-based CFP, president of Bone Fide
Wealth and co-author of The Millennial Money Fix. Viewing negative performance
without context can lead to rash decision making, while positive performance
can instill overconfidence, explains Joe Lum, a California-based CFP and
wealth advisor at Intersect Capital.
Lum agrees that it’s best for investors to avoid tracking their
performance (both good and bad) too frequently. While it’s easier than ever
to get instant information on your portfolio’s progress, it doesn’t mean it’s
necessary.
“If we were running a
marathon, it wouldn’t make sense to track our mileage in quarter-mile
increments,” Lum says. “The same can be said about long-term investing,
particularly in retirement accounts which traditionally have the longest time
horizon.”
Before investing, Boneparth suggests asking yourself, “Can I
hold these positions for a long period of time?”
“Investing should be boring,”
Harrison says. Her advice? Look at your investments on a quarterly basis,
which should be more than enough for most investors.
Mistake 2: Chasing the trends
Whether it be participating in
a frenzy over GameStop stock, which we all saw back in January, or investing
in the newest cryptocurrency, chasing the trends is a common mistake
investors make.
Lauryn Williams, a Texas-based
CFP and founder of Worth Winning, says she
sees investors follow the next hot stock not knowing why they are choosing a
particular investment other than the fact that “someone else says it is
awesome.”
“A lot investors make the
mistake of chasing trends or what’s cool because of FOMO,” Boneparth adds. He
recommends always doing your due diligence before putting your money in the
market. Or, as another option for a more hands-off approach, invest passively in the markets through
index funds and watch your portfolio grow over time. By using your brokerage account to buy diversified mutual and index
funds, you take on less risk than when you buy an individual company’s stock.
The best free stock trading
platforms
Select reviewed over 12 online
brokers that offer zero-commission trading and narrowed down the top six platforms for all sorts of
investors: TD Ameritrade; Ally
Invest; E*TRADE; Vanguard; Charles Schwab; and Fidelity.
These six offer the widest range of investment options,
user-friendly technology, quality customer support and educational resources.
You can read more about our methodology on selecting the best $0 commission
trading platforms below.
Mistake 3: Following bad advice from social media
“I cringe at the
misinformation out there surrounding investing and finances in general,
especially on social media,” Harrison says.
The overall guidance from
experts is simple: Don’t take
investment advice from those who don’t know your personal financial situation.
For example, you may feel pressured by someone on social media to start
investing in a certain company, but they aren’t clued in to what other
investment options you may have. You may be better off putting that money in
your employer-sponsored retirement account, especially if your company
matches contributions up to a certain percentage of your salary.
Make sure to do your own
research when investing and read up on the person giving financial advice on
TikTok or another social-media platform. Whether
you are just starting out or you’re a more seasoned investor, a good place to
begin is with FINRA’s free e-learning program for investors.
Mistake 4: Not giving your investments time to grow
When it comes to investing,
time is important. Ideally, you should hold investments for as long as you
can to maximize your returns. “Investing is something you do with the
expectation of reasonable returns over a long-term period,” Harrison says.
A big mistake Williams sees is investors bailing out on an
investment because they did not double their money in a certain period of
time, which is usually days or weeks.
“If you need your money to grow urgently, you probably don’t
have proper savings,” she says. “Quick growth comes with a lot of risk.” More about this
in Mistake No. 5 below.
Mistake 5: Investing money you’ll soon need
People jumping into the markets before building themselves a
strong financial foundation is the biggest mistake Boneparth sees
investors make.
Prior to investing, you should feel in control of how you spend
your money. A big part of that is building a cash reserve so you don’t need
to rely on your investments when you run into an emergency or want to make a
certain purchase.
“The stock market can be volatile, and you’d hate to lose the
money you were saving for something like a down payment on a home you were
wanting to purchase,” Harrison says.
A good way to know if you’re
ready to invest is understanding if you have a healthy amount of cash in a
savings account set aside for all your near-term goals. Harrison suggests
that money needed within a relatively short time period, such as within three
years, should not be invested in stocks.
Mistake 6: Having unclear investing goals
Once you have a separate
savings net set aside that you can fall back on, make sure you have clear
goals as you go into investing.
Harrison warns that investing
to make more money is rarely the goal. Instead, people should see money as a
tool for meeting their other goals. Making investing all about returns is a
common mistake she sees.
“You don’t have to chase high
returns that also correlate with higher risk, if you can adequately meet your
goals with less risky investments,” Harrison says.
Many investors use the S&P
500 as a benchmark for their investment performance, but Lum points out that
this index is often not a fair comparison against individuals’ actual
portfolios.
“While the S&P 500 serves
as an easy proxy for how ‘the market is doing,’ it is important to remember
that the design of your portfolio and performance should be aligned to meet
your goals — not an index that doesn’t know your financial situation, goals
or time horizon,” Lum says.
Mistake 7: Delaying investing altogether
Lastly, choosing to never invest at all is a costly mistake.
Keeping all your cash in a bank account means that money loses its purchasing
power due to the rising rate of inflation.
“Some people are so scared of
investing that they never even begin and lose out on the amazing compounding
effect that can happen over the long term,” Harrison says.
Index funds are more
popular than ever—here’s why they’re a smart investment (FYI only)
Published Thu, Sep 19 201911:40 AM EDT
Alicia Adamczyk@ALICIAADAMCZYK
U.S. stock index funds are more popular than
actively managed funds for the first time ever, according to investment research firm Morningstar. As of August 31, these index funds held
$4.27 trillion in assets, compared to $4.25 trillion in active funds.
Index funds were created by Jack Bogle almost 45 years ago as a way for everyday investors to
compete with the pros. They’re designed to be simple, all-in-one investments:
Rather than picking stocks you or your fund manager thinks will out-perform
the market, you own all of the stocks in a certain market index, like the
S&P 500 or the Dow Jones Industrial Average.
The thinking isn’t that you’ll beat the
market, but rather that you’ll keep up with it. And considering that
the stock market has
historically increased in value over time, that pays off for retirement investors.
Index funds have turned out to be a huge win
for retirement savers and other non-finance professionals for many reasons.
First, because you’re not paying someone to pick stocks for you anymore,
index funds tend to be less expensive for investors than actively managed
funds: The average expense ratio of passive funds was 0.15% in
2018, compared to 0.67% for active funds, Morningstar reported. The original index fund,the Vanguard 500, has an expense ratio of just 0.04%.
Index funds also typically make trades less
often than active funds, which leads to fewer fees and lower taxes.
Consistently buy an S&P 500 low-cost index
fund. I think it’s the thing that makes the most sense practically all of the
time.
Warren Buffett
CEO
OF BERKSHIRE HATHAWAY
“Costs really matter in investments,”
investing icon Warren Buffett told CNBC in 2017. “If returns are going to be seven or 8% and you’re paying 1%
for fees, that makes an enormous difference in how much money you’re going to
have in retirement.”
Second, index funds tend to perform better
over the long term than actively managed funds, making them ideal for people
investing for retirement. It’s incredibly hard for a person to pick stocks
that will beat the market and even harder to do so consistently over decades.
In fact, the majority of large-cap funds have
under-performed the S&P 500 for nine years running. “While a fund manager may outperform for a
year or two, the outperformance does not persist,” CNBC reported. “After 10
years, 85% of large-cap funds underperformed the S&P 500, and after 15
years, nearly 92% are trailing the index.” Large-cap funds are made up of the
publicly traded companies with the biggest market capitalizations.
Where active funds theoretically have a leg
up is during periods of market volatility. The theory is that the managers
will be able to shield their investors from some of the market’s deviations. But
that wasn’t the case in 2018, for example, when managers still
under-performed indexes, despite a rocky fourth quarter.
For the everyday investor looking to build
wealth long term, that all adds up to make low-cost index funds a go-to
investment.
“Consistently buy an S&P 500 low-cost index fund,” Buffett said. “I think it’s the thing that makes the most sense
practically all of the time.”
Index funds
are one of the easiest ways to invest — here’s how they work (FYI only)
Index
investing allows you to put money in the largest U.S. companies with low fees
and minimal risk.
Updated Thu,
Apr 7 2022, Elizabeth Gravier
Plenty of
people shy away from investing because of fear.
In fact, a
survey from Ally Invest found that 65% of adults say they find investing in
the stock market to be scary and/or intimidating. Whether it’s the concern
you’ll make a bad investment and lose money or a lack of access to quality
investing advice, at the end of the day that fear is holding you back from
really growing your net worth.
The good news
is there are many easy ways to invest; you don’t have to worry about picking
individual stocks, and hiring an expensive advisor isn’t always necessary.
One of the easiest ways to get started investing is through index funds.
How index
funds work
Index funds
are investment funds that follow a benchmark index, such as the S&P 500
or the Nasdaq 100.
When you put
money in an index fund, that cash is then used to invest in all the companies
that make up the particular index, which gives you a more diverse portfolio
than if you were buying individual stocks.
Let’s use the
S&P 500 as an example. The S&P 500 is one of the major indexes that
tracks the performance of the 500 largest companies in the U.S. Investing in
an S&P 500 fund (one of the most popular) means your investments are tied
to the performance of a wide range of companies.
Because the
goal of index funds is to mirror the same holdings of whatever index they
track, they are naturally diversified and thus hold a lower risk than
individual stock holdings. Market indexes tend to have a good track record,
too. Though the S&P 500 certainly fluctuates, it has historically
generated nearly a 10% average annual return over time for investors. (Just
remember that future returns are not guaranteed.)
Index
investing is a form of passive investing
Index
investors don’t need to actively manage the stocks and bonds investment as
closely since the fund is just copying a particular index. This is why index
funds are known as passive investing — and it’s what sets them apart from
mutual funds.
Mutual funds
are actively managed by fund managers who choose your investments. The goal
with mutual funds is to beat the market, while the goal with index funds is
simply to match the market’s performance. Since index funds don’t require
daily human management, they have lower management costs (called “expense
ratios”) than mutual funds. The money saved in fees by investing in an index
fund over a mutual fund can save you lots of money in the long term and in
turn help you make more money.
A common
strategy for many investors who have a long investment timeline is to
regularly invest money into an S&P 500 index fund (known as dollar-cost
averaging) and watch their money grow over time.
Get started index
investing with a brokerage account
Some of the
top index funds are those that track the S&P 500 and have low costs. For
example, Charles Schwab’s S&P 500 Index Fund (SWPPX) is a straightforward
option with no investment minimum. Its expense ratio is 0.02%, meaning every
$10,000 invested costs $2 annually. Passive, or index funds, generally have a
0.2% expense ratio, so this is notably low.
For an option
with no expense ratio, consider the Fidelity ZERO Large Cap Index (FNILX).
Though the fund doesn’t technically track the S&P 500, the Fidelity U.S.
Large Cap Index tracks large capitalization stocks, which the website says,
“are considered to be stocks of the largest 500 U.S. companies.”
To invest in
an index fund, you’ll need to open a brokerage account, a traditional IRA or
a Roth IRA (you can often choose to invest in index funds through your
employer’s 401(k) too). Once your account is open and funded, you can choose
from a number of different index funds, like an S&P 500 fund, a fund that
tracks government bonds or a fund that tracks international stocks.
Also, consider
using a robo-advisor like Wealthfront and Betterment (which Select rated
highly on our list of the best robo-advisors), which will invest in a handful
of index funds and ETFs based on your risk tolerance and investment timeline.
Robo-advisors will automatically rebalance your portfolio based on market
conditions and have much lower fees than traditional financial advisors.
Chapter 8 Stock Market
Part I: Stock Market
Popular Websites
Stock screening tools
Reuters stock screener to help select stocks
http://stockscreener.us.reuters.com/Stock/US/
FINVIZ.com
http://finviz.com/screener.ashx
WSJ stock screen
http://online.wsj.com/public/quotes/stock_screener.html
Simply the Web's Best
Financial Charts
How to pick stocks
Capital Asset Pricing Model (CAPM)Explained
https://www.youtube.com/watch?v=-fCYZjNA7Ps
Fama French 3 Factor Model Explained
http://www.youtube.com/watch?v=zWrO3snZjuA
Ranking stocks using PEG ratio
https://www.youtube.com/watch?v=vY10cNAGJdM
Class discussion topics and homework
(Are the following statements right or wrong? Why?, due with the second
mid-term exam)
1: My investment in company A is a sure thing.
2: I would never buy stocks now because the
market is doing terribly.
3: I just
hired a great new broker, and I am sure to beat the market.
4:
My investments are well diversified because I own a mutual fund that tracks the
S&P 500.
5: I made $1,000 in the stock market today.
6: GM’s
earning report is better than expected. But GM stock price went down instead
of going up after the earning news was released. How come?
7: Paypal’s price has gone up so much in the past
several months. I should invest in Paypal now.
Part II: Behavior
Finance
Behavior
Finance Introduction PPT
Vanguard
Behavior Finance Lecture PPT - FYI
Behavior
Finance Class Notes - FYI
Anchoring
•
Test
yourself first:
A stock
price jumps to $40 from $20 but it suddenly dropped back to $20. Shall you
buy the stock or not?
•
The
concept of anchoring draws on the tendency to attach or "anchor"
our thoughts to a reference point - even though it may have no logical
relevance to the decision at hand.
•
Avoiding Anchoring
–
Be
especially careful about which figures you use to evaluate a stock's
potential.
–
Don't base
decisions on benchmarks
–
Evaluate
each company from a variety of perspectives to derive the truest picture of
the investment landscape.
Mental Accounting
•
Test
yourself
–
Shall
you payoff your credit card debt or start saving for a vocation?
–
How do
you spend your tax refund?
•
Mental
Accounting refers to the tendency for people to separate their money into
separate accounts based on a variety of subjective criteria, like the source
of the money and intent for each account.
Example: People
have a special "money jar" set aside for a vacation while still
carrying credit card debt.
Confirmation Bias
•
Confirmation
bias: First impression can be hard to shake
–
people
selectively filter information that supports their opinion
–
People
ignore the rest opinions.
–
In
investing, people look for information that supports original idea
•
Generate
faulty decision making because of the bias
Example: investor finds all sorts of green flags about the
investment (such as growing cash flow or a low debt/equity ratio), while glossing
over financially disastrous red flags, such as loss of critical customers or
dwindling markets.
Gambler’s fallacy:
–
An
individual erroneously believes that the onset of a certain random event is
less likely to happen following an event or a series of events.
Example:
Consider a series of 20 coin flips that have all landed with the
"heads". A person might predict that the next coin flip is more
likely to land with the "tails“.
Slot machines: Every losing pull will
bring them that much closer to the jackpot. But that is wrong. All pulls are
independent.
•
Example:
–
You
liquidate a position after it has gone up in several days.
–
You hold
on to a stock that has fallen in several days because you view further
declines as "improbable".
•
Avoiding
Gambler's Fallacy
–
Investors
should base decisions on fundamental
or technical
analysis before determining what will happen.
It is irrational to buy a stock because you believe it is
likely to reverse.
Herding:
–
Example:
Dotcom herd
–
The
tendency for individuals to mimic the actions of a larger group.
•
Social
pressure of conformity is one of the causes.
–
This is because
most people are very sociable and have a natural desire to be accepted by a
group
•
The
second reason is the common rationale that a large group could not be wrong.
–
This is
especially prevalent when an individual has very little experience.
–
Overconfidence:
•
Confidence
implies realistically trusting in one's abilities
•
Overconfidence
implies an overly optimistic assessment of one's knowledge or control over a
situation.
Disposition
effect
–
which is
the tendency for investors to hold on to losing stocks for too long and sell
winning stocks too soon.
»
The most
logical course of action would be to hold on to winning stocks to further
gains and to sell losing stocks to prevent escalating losses.
»
investors
are willing to assume a higher level of risk in order to avoid the negative
utility of a prospective loss.
»
Unfortunately,
many of the losing stocks never recover, and the losses incurred continued to
mount .
Avoiding the Disposition Effect
•
When you have a choice of thinking of one large gain or a
number of smaller gains (such as finding $100 versus finding a $50 bill from
two places), thinking of the latter can maximize the amount of positive
utility.
•
When you have a choice of thinking of one large loss or a
number of smaller losses (losing $100 versus losing $50 twice), think of one
large loss would create less negative utility.
•
When you can think of one large gain with a smaller loss
or a situation where you net the two to create a smaller gain ($100 and -$55,
versus +$45), you would receive more positive utility from the smaller gain.
•
When you can think of one large loss with a smaller gain
or a smaller loss (-$100 and +$55, versus -$45), try to separate losses from
gains.
12 Cognitive Biases Explained - How to Think Better and
More Logically Removing Bias (video, FYI)
0:18 Anchoring Bias 1:22 Availability Bias 2:22 Bandwagon Effect 3:09 Choice Supportive Bias 3:50 Confirmation Bias 4:30 Ostrich Bias 5:20 Outcome Bias 6:12 Overconfidence 6:52 Placebo Effect 7:44 Survivorship Bias 8:32 Selective Perception 9:08 Blindspot Bias
Homework: (due with the second mid-term
exam)
· Explain with examples
of the following concepts: gambler’ fallacy, mental accounting, disposition
effect
Second Mid-term exam (close book, close notes, in class exam, 11/1/2022)
Second Mid Term Exam Study Guide
Total 53 T/F and multiple choice questions (two points each questions. 3
questions will not be graded)
1.
QQQ vs. SPY
2.
Municipal bond?
TIPS? Treasury bonds? Treasury bill? Series I bond?
3.
High yield bond?
Junk bond?
4.
Money market
fund?
5.
Yield curve: normal,
steep shaped, inverted, humped?
6.
Altman Z-score?
What is bond rating?
7.
What is Alpha?
What is Beta?
8.
What are risks
associated with bond market?
9.
Performance of
S&P500 stocks? Worst and the best.
10.Stock weight of the S&P500 stocks? Given S&P
total value and the stock’s market value.
11.Value stocks vs. growth stocks
12.What is anchoring (behavior finance)
13.Mental Accounting?
Herding? Confirmation Bias? (behavior
finance)
14.What is overconfidence (behavior finance)
15.What is disposition effect (behavior finance)
16.gambler’s fallacy? (behavior finance)
Chapter 9 Options
Class discussion
topics:
· Apple price will go up because of the holiday
shopping season. Tesla price could fall based on the recent news.
Anticipating big changes on stock prices of Apple and Tesla, how shall you
react?
· You just bought Tesla stocks. You
worried that Tesla price might fall. What can you do to ease your mind?
Options are derivative contracts that give the holder the
right, but not the obligation, to buy or sell the underlying instrument at a specified price on or before a
specified future date. Although the holder (also called the buyer) of the option is
not obligated to exercise the option, the option writer (known as the
seller) has an obligation to buy or sell the underlying instrument if the
option is exercised.
Depending on the strategy, option trading can provide a variety of benefits
including the security of limited risk and the advantage of leverage. Options can protect or enhance an
investor’s portfolio in rising, falling and neutral markets. Regardless
of the reasons for trading options or the strategy employed, it is important
to understand the factors that determine the value of an option. (www.investopedia.com)
Call options: Learn the basics of buying and selling
By James
Royal, 11/1/2021
https://www.bankrate.com/investing/what-are-call-options-learn-basics-buying-selling
Call options are a type of option that increases
in value when a stock rises. They’re the best-known kind of
option, and they allow the owner to lock in a price to buy a specific stock
by a specific date. Call options are appealing because they can appreciate
quickly on a small move up in the stock price. So that makes them a favorite
with traders who are looking for a big gain.
What is a call option?
A call option gives you the right, but not the
requirement, to purchase a stock at a specific price (known as the strike
price) by a specific date, at the option’s expiration. For this
right, the call buyer will pay an amount of money called a premium, which the
call seller will receive. Unlike stocks, which can live in perpetuity, an
option will cease to exist after expiration, ending up either worthless or
with some value.
The following components comprise the major traits
of an option:
Strike price: The price at which you can buy the underlying
stock
Premium: The price of the option, for either buyer or
seller
Expiration: When the option expires and is settled
One option is
called a contract, and each contract represents 100 shares of the underlying
stock. Exchanges
quote options prices in terms of the per-share price, not the total price you
must pay to own the contract. For example, an option may be quoted at $0.75
on the exchange. So to purchase one contract it will cost (100 shares * 1
contract * $0.75), or $75.
How a call option works
Call options
are “in the money” when the stock
price is above the strike price at expiration. The call owner can exercise
the option, putting up cash to buy the stock at the strike price. Or the
owner can simply sell the option at its fair market value to another buyer
before it expires.
A call owner profits when the premium paid is less
than the difference between the stock price and the strike price. For example,
imagine a trader bought a call for $0.50 with a strike price of $20, and the
stock is $23 at expiration. The option is worth $3 (the $23 stock price minus
the $20 strike price) and the trader has made a profit of $2.50 ($3 minus the
cost of $0.50).
If the stock
price is below the strike price at expiration, then the call is “out of the
money” and expires worthless. The call seller keeps any premium received for
the option.
Why buy a call option?
The biggest advantage of buying a call option is
that it magnifies the gains in a stock’s price. For a
relatively small upfront cost, you can enjoy a stock’s gains above the strike
price until the option expires. So if you’re buying a call, you usually
expect the stock to rise before expiration.
Call options vs. put options
The other
major kind of option is called a put
option, and its value increases as the stock price goes down. So traders
can wager on a stock’s decline by buying put options. In this sense, puts act
like the opposite of call options, though they have many similar risks and
rewards:
Like buying a
call option, buying a put option
allows you the opportunity to earn back many times your investment.
Like buying a
call option, the risk of buying a put option is that you could lose all your
investment if the put expires worthless.
Like selling a
call option, selling a put option earns a premium, but then the seller takes
on all the risks if the stock moves in an unfavorable direction.
Unlike selling
a call option, selling a put option exposes you to capped losses (since a
stock cannot fall below $0). Still, you could lose many times more money than
the premium received.
What Is a Put Option?
A put option (or “put”) is a contract giving the
option buyer the right, but not the obligation, to sell—or sell short—a
specified amount of an underlying security at a predetermined price within a
specified time frame. This predetermined price at which the
buyer of the put option can sell the underlying security is called the strike
price.
Put options
are traded on various underlying assets, including stocks, currencies, bonds,
commodities, futures, and indexes. A put option can be contrasted with a call
option, which gives the holder the right to buy the underlying security at a
specified price, either on or before the expiration date of the option
contract.
KEY TAKEAWAYS
· Put options give holders of the option the right, but not the obligation, to sell a specified amount of an underlying security at a specified price within a specified time frame.
· Put options are available on a wide range of assets, including stocks, indexes, commodities, and currencies.
· Put option prices are impacted by changes in the price of the underlying asset, the option strike price, time decay, interest rates, and volatility.
· Put options increase in value as the underlying asset falls in price, as volatility of the underlying asset price increases, and as interest rates decline.
· Put options lose value as the underlying asset increases in price, as volatility of the underlying asset price decreases, as interest rates rise, and as the time to expiration nears.
https://www.investopedia.com/terms/p/putoption.asp
The five basic components of option pricing include the following:
1. Underlying
Asset Price – The price of the underlying stock or index the option
is written on.
2. Asset
Volatility – Amount of uncertainty associated with the asset's
expected return. In general, the higher the volatility, the more expensive
the option will be. For example, if an asset's value is $100 today, and next
month the price is estimated to be either $125 or $75, then the amount of
uncertainty here is very high. Because of this, the option price will be high
as well. After all, the more volatile the security, the greater chance that
it will deliver large returns for the option holder. This uncertainty of
return is one of the main drivers of option prices.
3. Time
to Expiration – The amount of time left before the option expires.
The price of an option decreases as it approaches its expiration date. Why is
this? Well, as the expiration date approaches, the chances of the option
gaining in value become lower and lower because the underlying security has
less time in which to make a major up or down move.
4. Risk-Free
Rate – For a variety of reasons that are beyond the scope of this
report, the rate of return that may be earned without bearing any risk also
comes into play when pricing options. Normally this is assumed to be the rate
of interest earned by U.S. Treasury Bills.
5. Option
Strike Price – This is the price at which the option can be
exercised.
https://www.nasdaq.com/articles/the-5-factors-that-determine-options-prices-2019-11-08
Call
Options & Put Options Explained Simply In 8 Minutes
Basic
Options Calculator - Powered by IVolatility.com
https://www.optionseducation.org/toolsoptionquotes/optionscalculator (great
tool to calculate option prices)
https://www.cboe.com/education/tools/options-calculator/ (CBOE option calculator)
Call and Put price of AAPL on
Google Finance
Call and Put price of AAPL on Nasdaq
https://finance.yahoo.com/quote/AAPL/options?date=1674172800


Learn THIS before Trading Options - The GREEKS explained
for beginners & how options are priced (video, FYI)
·
o Home
Work
1. What is
call option?
2. What is put
option?
3. Between
call option holders and put option holders, who will benefit from the falling
of the stock price? Who is going to benefit from the rising of the stock
prices?
4. (optional) Between call option holders and put option
holders, who will benefit from the rising of interest rate? Who is going to
benefit from the falling of interest rate?
How and Why Interest Rates Affect Options
(FYI only)
By SHOBHIT
SETH Updated June 08, 2022, Reviewed by CHARLES POTTERS
Fact
checked by KIRSTEN ROHRS SCHMITT
Interest
rate changes impact the overall economy, stock market, bond market, and other
financial markets and can influence macroeconomic factors. A change in
interest rates also impacts option valuation, which is a complex task with
multiple factors, including the price of the underlying asset, exercise or
strike price, time to expiry, risk-free rate of return (interest rate),
volatility, and dividend yield. Barring the exercise price, all other factors
are unknown variables that can change until the time of an option's expiry.
Which
Interest Rate for Pricing Options?
It is
important to understand the right maturity interest rates to be used in
pricing options. Most option valuation models like Black-Scholes use
annualized interest rates.
It is
important to note that changes in interest rates are infrequent and in small
magnitudes (usually in increments of 0.25%, or 25 basis points only). Other
factors used in determining the option price (like the underlying asset
price, time to expiry, volatility, and dividend yield) change more frequently
and in larger magnitudes, which have a comparatively larger impact on option
prices than changes in interest rates.
KEY
TAKEAWAYS
·
Changes in interest rate directly affect
option pricing, whose calculation is made up of numerous complex factors.
·
For standard option pricing models like
Black-Scholes, the risk-free annualized Treasury interest rate is used.
·
When
interest rates increase, call options benefit while put option prices are
impacted negatively.
Interest Advantage in Call Options
Purchasing
100 shares of a stock trading at $100 will require $10,000, which, assuming a
trader borrows money for trading, will lead to interest payments on this
capital. Purchasing the call option at $12 in a lot of 100 contracts will
cost only $1,200. Yet the profit potential will remain the same as that with
a long stock position.
Effectively,
the differential of $8,800 will result in savings of outgoing interest
payment on this loaned amount. Alternatively, the saved capital of $8,800 can
be kept in an interest-bearing account and will result in interest income—a 5% interest will generate $440 in one year.
Thus,
an increase in interest rates will lead to either saving in outgoing interest
on the loaned amount or an increase in the receipt of interest income on the
savings account. Both will be positive for this call position + savings.
Effectively, a call option’s price increases to reflect this benefit from increased
interest rates.
Interest Disadvantage in Put Options
Theoretically,
shorting a stock with an aim to benefit from a price decline will bring in
cash to the short seller. Buying a put has a similar benefit from price
declines, but comes at a cost as the put option premium is to be paid. This
case has two different scenarios: cash received by shorting a stock can earn
interest for the trader, while cash spent in buying puts is interest payable
(assuming the trader is borrowing money to buy puts).
With an increase in interest rates,
shorting stock becomes more profitable than buying puts, as the former
generates income and the latter does the opposite. Thus, put option prices are impacted negatively by increasing interest rates.
The Rho Greek
Rho is a standard Greek that measures the
impact of a change in interest rates on an option price. It indicates the
amount by which the option price will change for every 1% change in interest
rates. Assume that a call option is currently
priced at $5 and has a rho value of 0.25. If the interest rates increase by
1%, then the call option price will increase by $0.25 (to $5.25) or by the
amount of its rho value. Similarly, the put option price will decrease by the
amount of its rho value.
Since
interest rate changes don’t happen that frequently,
and usually are in increments of 0.25%, rho is not considered a primary Greek
in that it does not have a major impact on option prices compared to other
factors (or Greeks like delta, gamma, vega, or theta).
How a Change in Interest Rates Affects Call
and Put Option Prices?
Taking
the example of a European-style in-the-money (ITM) call option on underlying
trading at $100, with an exercise price of $100, one year to expiry, a
volatility of 25%, and an interest rate of 5%, the call price using Black-Scholes
model comes to $12.3092 and call rho value comes to 0.5035. The price of a
put option with similar parameters comes to $7.4828 and put rho value is
-0.4482 (Case 1).
Rho
Calculation using Black-Scholes Model
Source:
Chicago Board Options Exchange (CBOE)

Now,
let’s increase the interest rate from 5% to 6%,
keeping other parameters the same.
Rho
Calculation using Black-Scholes Model

The
call price has increased to $12.7977 (a change of $0.4885) and put price has
gone down to $7.0610 (change of $-0.4218). The call price and put price has
changed by almost the same amount as the earlier computed call rho (0.5035)
and put rho (-0.4482) values computed earlier. (The fractional difference is
due to BS model calculation methodology, and is negligible.)
In
reality, interest rates usually change only in increments of 0.25%. To take a
realistic example, let’s change the interest rate
from 5% to 5.25% only. The other numbers are the same as in Case 1.
Rho
Calculation using Black-Scholes Model

The
call price has increased to $12.4309 and put price reduced to $7.3753 (a
small change of $0.1217 for call price and of -$0.1075 for put price).
As can
be observed, the changes in both call and put option prices are negligible
after a 0.25% interest rate change.
It is
possible that interest rates may change four times (4 * 0.25% = 1% increase)
in one year, i.e. until the expiry time. Still, the impact of such interest
rate changes may be negligible (only around $0.5 on an ITM call option price
of $12 and ITM put option price of $7). Over the course of the year, other
factors can vary with much higher magnitudes and can significantly impact the
option prices.
Similar
computations for out-of-the-money (OTM) and ITM options yield similar results
with only fractional changes observed in option prices after interest rate
changes.
Arbitrage
Opportunities
Is it
possible to benefit from arbitrage on expected rate changes? Usually, markets
are considered to be efficient and the prices of options contracts are
already assumed to be inclusive of any such expected changes.
Also, a change in interest rates usually
has an inverse impact on stock prices, which has a much larger impact on
option prices. Overall, due to the small proportional change in option price
due to interest rate changes, arbitrage benefits are difficult to capitalize
upon.
The
Bottom Line
Option
pricing is a complex process and continues to evolve, despite popular models like
Black-Scholes being used for decades. Multiple factors impact option
valuation, which can lead to very high variations in option prices over the
short term. Call option and put option
premiums are impacted inversely as interest rates change. However, the impact
on option prices is fractional; option pricing is more sensitive to changes
in other input parameters, such as underlying price, volatility, time to
expiry, and dividend yield.
Chapter 11 - 14:
Commercial Banking and Investment Banking
PPT2 Commercial banking II
(Balance sheet)
Wells Fargo’s Balance Sheet http://www.nasdaq.com/symbol/wfc/financials?query=balance-sheet
|
Period Ending: |
12/31/2021 |
12/31/2020 |
12/31/2019 |
12/31/2018 |
|
Current Assets |
||||
|
Cash and Cash Equivalents |
$910,870,000 |
$891,499,000 |
$808,756,000 |
$793,331,000 |
|
Short-Term Investments |
-- |
-- |
-- |
-- |
|
Net Receivables |
-- |
-- |
-- |
-- |
|
Inventory |
-- |
-- |
-- |
-- |
|
Other Current Assets |
-- |
-- |
-- |
-- |
|
Total Current Assets |
-- |
-- |
-- |
-- |
|
Long-Term Assets |
||||
|
Long-Term Investments |
$1,546,605,000 |
$1,500,003,000 |
$1,569,549,000 |
$1,525,758,000 |
|
Fixed Assets |
$8,571,000 |
$8,895,000 |
$9,309,000 |
$8,920,000 |
|
Goodwill |
$25,180,000 |
$26,392,000 |
$26,390,000 |
$26,418,000 |
|
Intangible Assets |
-- |
-- |
-- |
-- |
|
Other Assets |
$67,259,000 |
$87,337,000 |
$78,917,000 |
$81,293,000 |
|
Deferred Asset Charges |
-- |
-- |
-- |
-- |
|
Total Assets |
$1,948,068,000 |
$1,952,911,000 |
$1,927,555,000 |
$1,895,883,000 |
|
Current Liabilities |
||||
|
Accounts Payable |
$70,957,000 |
$74,360,000 |
$75,163,000 |
$69,317,000 |
|
Short-Term Debt / Current Portion of Long-Term
Debt |
$34,409,000 |
$58,999,000 |
$104,512,000 |
$105,787,000 |
|
Other Current Liabilities |
$1,482,479,000 |
$1,404,381,000 |
$1,322,626,000 |
$1,286,170,000 |
|
Total Current Liabilities |
-- |
-- |
-- |
-- |
|
Long-Term Debt |
$9,424,000 |
$16,509,000 |
$9,079,000 |
$8,499,000 |
|
Other Liabilities |
-- |
-- |
-- |
-- |
|
Deferred Liability Charges |
-- |
-- |
-- |
-- |
|
Misc. Stocks |
$2,504,000 |
$1,032,000 |
$838,000 |
$900,000 |
|
Minority Interest |
-- |
-- |
-- |
-- |
|
Total Liabilities |
$1,760,462,000 |
$1,768,231,000 |
$1,740,409,000 |
$1,699,717,000 |
|
Stock Holders Equity |
||||
|
Common Stocks |
$9,136,000 |
$9,136,000 |
$9,136,000 |
$9,136,000 |
|
Capital Surplus |
$180,322,000 |
$162,683,000 |
$166,697,000 |
$158,163,000 |
|
Retained Earnings |
-$79,757,000 |
-$67,791,000 |
-$68,831,000 |
-$47,194,000 |
|
Treasury Stock |
$60,196,000 |
$60,197,000 |
$61,049,000 |
$60,685,000 |
|
Other Equity |
-$2,348,000 |
-$681,000 |
-$2,454,000 |
-$7,838,000 |
|
Total Equity |
$187,606,000 |
$184,680,000 |
$187,146,000 |
$196,166,000 |
|
Total Liabilities & Equity |
$1,948,068,000 |
$1,952,911,000 |
$1,927,555,000 |
$1,895,883,000 |
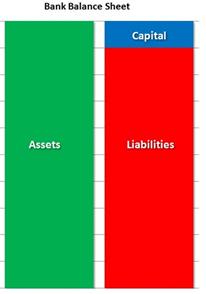
Topics
for class discussion
1. Anything wrong
of the above balance sheet of Wells Fargo? Where do the loans and deposits
go?
FRM: Bank Balance Sheet & Leverage Ratio (VIDEO)
2.
What is bank run? It is rare. Why?
Bank Run Explained | History of Bank Runs
(youtube)
3. How can you
tell that banks are getting bigger and bigger? Who need big banks?
What is too big to fail (Bloomberg
university) video
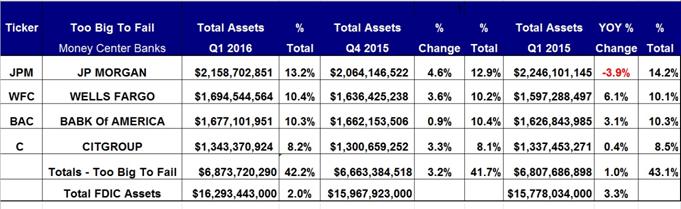
Benefits of Local
Banks vs. Big Banks
BY JUSTIN PRITCHARD
REVIEWED BY KHADIJA KHARTIT on
May 30, 2021
When you choose a bank, it’s
critical to find the products, services, and rates that meet your needs. As you evaluate
large national banks vs. local banks and credit unions, you may wonder if the
size of an institution matters. To some degree, it does, but big banks and small
banks can offer essential services like checking and savings accounts.
Here’s what to consider as you
compare banks:
Convenience
Choose a bank that’s easy to work
with on your terms. If you prefer to bank in-person, some institutions might
have a better presence than others in your area.
Cost
Fees are often lower at small
institutions, but that’s not always the case. Identify your banking needs and
compare fees for the services you need.
Services
Small institutions can have a
surprisingly large offering of products and services. But sometimes you need
the horsepower of a megabank.
Community
Banking with a local institution
helps to support your local economy, and it may make your banking experience
easier. But there are always pros and cons.
Let’s explore the differences
between big banks and local banks in more detail.
Megabanks Have a National Reach
Potential Convenience
Large national banks with
household names dominate large cities, and they even reach into smaller
markets. If you value in-person banking, a bank with branches nearby might be
a decent option. They can offer one-stop shopping, allowing you to get
multiple services from the same institution. For example, you might be able
to use one login for your checking and savings accounts, credit cards, and
loans.
Large banks that have a national
reach include Bank of America, Capital One, Chase Bank, Wells Fargo, and
many other large institutions.
Sometimes Frustrating
Big banks often have rigid systems and
processes, which makes
dealing with them difficult. If you need help from customer service, you may
be forced to call a national toll-free number, even though you know and trust
the local bankers. You may have to speak with relatively new hires or answer
multiple fraud department questions just to open an account. Contrast that
experience with a local bank, where the same person can handle everything for
you in one sitting.
Costs Vary
Free checking is increasingly
hard to find at megabanks. You can typically qualify for fee waivers by
keeping sufficient cash in your account or setting up direct deposit, but
genuinely free accounts are rare. You can occasionally find fee-free business
checking at national banks, while local banks charge modest fees.
Local Banks Engage in the
Community
Community banks and local credit
unions are an excellent option for most banking needs. Just because they’re
small doesn’t mean they can’t meet your needs. Some institutions limit their
offerings, others outsource services, and some provide everything you need
in-house.
Competitive Fees and Rates
Local banks are often a good bet
for free checking accounts—the account you probably need most. Some offer
standard free checking to everybody, while others waive fees if you just
agree to receive electronic statements. They also compete with attractive
rates on savings accounts and loans. Savings rates might still be higher at
online banks, but there’s nothing to prevent you from having multiple
accounts (online and local).
Local Knowledge
Because they’re
engaged in local matters, local banks may make transactions easier. That’s particularly true if you
need to borrow money. For example, megabanks might be unwilling to fund your
local business, investment property, or agriculture loan, but local banks are
accustomed to evaluating loans in your area.
Personal Service
For better or worse, local banks
typically provide more personal service than big banks. It’s not uncommon to work with
the same person over time. Bank staff can even learn about your needs and suggest bank
products that may be helpful. You develop relationships and know what to
expect and who to talk to when you have questions. At the same time, you lose the
anonymity that comes with being a big bank customer. If you live in a
particularly small town, you may prefer to keep a low profile.
Offerings Vary
While local banks and credit
unions can offer everything from checking accounts to merchant accounts to
wealth management, some institutions focus on basic consumer needs. If your
favorite local bank doesn’t handle business accounts and you start
freelancing, you’ll need to look elsewhere.
Community Involvement
Your banking needs to drive your
choice of banks, but you may feel a sense of satisfaction when working with a
local institution. Local banks and credit unions are part of the local
economy, and they often give back. You’re likely to see a local institution’s logo
at charity races and other events, signaling that they contributed money or
other resources to help make the event a reality.
Part II: Bank Failure
By JULIA KAGAN Updated November
17, 2021, Reviewed by SOMER ANDERSON, Fact checked by SUZANNE KVILHAUG
What Is Bank Failure?
A bank failure is the closing of
an insolvent bank by a federal or state regulator. The comptroller of the
currency has the power to close national banks; banking commissioners in the
respective states close state-chartered banks. Banks close when they are
unable to meet their obligations to depositors and others. When a bank fails,
the Federal Deposit Insurance Corporation (FDIC) covers the insured portion
of a depositor's balance, including money market accounts.
Understanding Bank
Failures
A bank fails when it can’t meet
its financial obligations to creditors and depositors. This could occur
because the bank in question has become insolvent, or because it no longer
has enough liquid assets to fulfill its payment obligations.
KEY TAKEAWAYS
· When a bank
fails, assuming the FDIC insures its deposits and finds a bank to take it
over, its customers will likely be able to continue using their accounts,
debit cards, and online banking tools.
· Bank failures
are often difficult to predict and the FDIC does not announce when a bank is
set to be sold or is going under.
· It may take
months or years to reclaim uninsured deposits from a failed bank.
· The most
common cause of bank failure occurs when the value of the bank’s assets falls
to below the market value of the bank’s liabilities, which are the bank's
obligations to creditors and depositors. This might happen because the bank
loses too much on its investments. It’s not always possible to predict when a
bank will fail.
What Happens When a
Bank Fails?
When a bank fails, it may try to
borrow money from other solvent banks in order to pay its depositors. If the
failing bank cannot pay its depositors, a bank panic might ensue in which
depositors run on the bank in an attempt to get their money back. This can
make the situation worse for the failing bank, by shrinking its liquid assets
as depositors withdraw cash from the bank. Since the creation of the FDIC,
the federal government has insured bank deposits up to $250,000 in the U.S.
When a bank fails, the FDIC takes
the reins and will either sell the failed bank to a more solvent bank or take
over the operation of the bank itself. Ideally, depositors who have money in
the failed bank will experience no change in their experience of using the
bank; they’ll still have access to their money and should be able to use
their debit cards and checks as normal. In the event that a failed bank is
sold to another bank, account holders automatically become customers of that
bank and may receive new checks and debit cards.
When necessary, the FDIC has
taken over failing banks in the U.S. in order to ensure that depositors
maintain access to their funds, and prevent a bank panic.
Examples of Bank Failures
During the 2007-2008 financial
crisis, the biggest bank failure in U.S. history occurred when Washington Mutual,
with $307 billion in assets, closed its doors. Another large bank failure had
occurred just a few months earlier when IndyMac was seized.
Special Considerations
The FDIC was created in 1933 by
the Banking Act (often referred to as the Glass-Steagall Act). In the years
immediately prior, which marked the beginning of the Great Depression,
one-third of American banks had failed. During the 1920s, before the Black
Tuesday crash of 1929, an average of about 70 banks had failed each year
nationwide. During the first 10 months of the Great Depression, 744 banks
failed, and during 1933 alone, about 4,000 American banks failed. By the time
the FDIC was created, American depositors had lost $140 billion due to bank
failures, and without federal deposit insurance protecting these deposits,
bank customers had no way of getting their money back.

https://www.fdic.gov/bank/historical/bank/
Why the U.S. banking system could be on the verge of another crisis
(youtube)
Homework (Due with final)
Question
1: Too big too fail. What is your opinion on this statement? Should we worry
about banks getting bigger and bigger? Why or why not?
Question 2: What are the pro and con for big
banks?
Question 3:
(optional) what is bank failure? Do you think that higher interest rates tend
to help banks to thrive or tend to destroy them? Why?
Part III: Governmental Regulations on
Banking Industry (FYI)
A Brief History of U.S. Banking
Regulation (FYI)
By MATTHEW
JOHNSTON
Reviewed by
MICHAEL J BOYLE on July 30, 2021
https://www.investopedia.com/articles/investing/011916/brief-history-us-banking-regulation.asp
As early as
1781, Alexander Hamilton recognized that “Most commercial nations have found
it necessary to institute banks, and they have proved to be the happiest
engines that ever were invented for advancing trade.” Since then, America has
developed into the largest economy in the world, with some of the biggest
financial markets in the world. But the path from then to now has been
influenced by a variety of different factors and an ever-changing regulatory
framework. The changing nature of that framework is best characterized by the
swinging of a pendulum, oscillating between the two opposing poles of greater
and lesser regulation. Forces, such as the desire for greater financial
stability, more economic freedom, or fear of the concentration of too much
power in too few hands, are what keep the pendulum swinging back and forth.
Early Attempts
at Regulation in Antebellum America
From the
establishment of the First Bank of the United States in 1791 to the National
Banking Act of 1863, banking regulation in America was an experimental mix of
federal and state legislation.1 2 The regulation was motivated, on the
one hand, by the need for increased centralized control to maintain stability
in finance and, by extension, the overall economy. While on the other hand,
it was motivated by the fear of too much control being concentrated in too
few hands.
Despite bringing
a relative degree of financial and economic stability, the First Bank of the
United States was opposed to being unconstitutional, with many fearing that
it relegated undue powers to the federal government. Consequently, its
charter was not renewed in 1811. With the government turning to state banks
to finance the War of 1812 and the significant over-expansion of credit that
followed, it became increasingly apparent that financial order needed to be
reinstated. In 1816, the Second Bank of the United States would receive a
charter, but it too would later succumb to political fears over the amount of
control it gave the federal government and was dissolved in 1836.
Not only at
the federal level, but also at the level of state banking, obtaining an
official legislative charter was highly political. Far from being granted on
the basis of proven competence in financial matters, successful acquisition
of a charter depended more on political affiliations, and bribing the
legislature was commonplace. By the time of the dissolution of the Second
Bank, there was a growing sense of a need to escape the politically corrupt
nature of legislative chartering. A new era of “free banking” emerged with a
number of states passing laws in 1837 that abolished the requirement to
obtain an officially legislated charter to operate a bank. By 1860, a
majority of states had issued such laws.
In this
environment of free banking, anyone could operate a bank on the condition,
among others, that all notes issued were back by proper security. While this
condition served to reinforce the credibility of note issuance, it did not
guarantee immediate redemption in specie (gold or silver), which would serve
to be a crucial point. The era of free banking suffered from financial instability
with several banking crises occurring, and it made for a disorderly currency
characterized by thousands of different banknotes circulating at varying
discount rates. It is this instability and disorder that would renew the call
for more regulation and central oversight in the 1860s.
Increasing
Regulation from the Civil War to the New Deal
The free
banking era, characterized as it was by a complete lack of federal control
and regulation, would come to an end with the National Banking Act of 1863 (and
its later revisions in 1864 and 1865), which aimed to replace the old state
banks with nationally chartered ones. The Office of the Comptroller of the
Currency (OCC) was created to issue these new bank charters as well as
oversee that national banks maintained the requirement to back all note
issuance with holdings of U.S. government securities.
While the new
national banking system helped return the country to a more uniform and
secure currency that it had not experienced since the years of the First and
Second Banks, it was ultimately at the expense of an elastic currency that
could expand and contract according to commercial and industrial needs. The
growing complexity of the U.S. economy highlighted the inadequacy of an
inelastic currency, which led to frequent financial panics occurring
throughout the rest of the nineteenth century.
With the
occurrence of the bank panic of 1907, it had become apparent that America’s
banking system was out of date. Further, a committee gathered in 1912 to
examine the control of the nation’s banking and financial system. It found
that the money and credit of the nation were becoming increasingly
concentrated in the hands of relatively few men. Consequently, under the
presidency of Woodrow Wilson, the Federal Reserve Act of 1913 was approved to
wrest control of the nation’s finances from banks while at the same time
creating a mechanism that would enable a more elastic currency and greater
supervision over the nation’s banking infrastructure.
Although the
newly established Federal Reserve helped to improve the nation’s payments
system and created a more flexible currency, it's a misunderstanding of the
financial crisis following the 1929 stock market crash served to roil the
nation in a severe economic crisis that would come to be known as the Great
Depression. The Depression would lead to even more banking regulation
instituted by President Franklin D. Roosevelt as part of the provisions under
the New Deal. The Glass-Steagall Act of 1933 created the Federal Deposit Insurance
Corporation (FDIC), which implemented regulation of deposit interest rates,
and separated commercial from investment banking. The Banking Act of 1935
served to strengthen and give the Federal Reserve more centralized power.
1980s
Deregulation and Post-Crisis Re-Regulation
The period
following the New Deal banking reforms up until around 1980 experienced a
relative degree of banking stability and economic expansion. Still, it has
been recognized that the regulation has also served to make American banks
far less innovative and competitive than they had previously been. The
heavily regulated commercial banks had been losing increasing market share to
less-regulated and innovative financial institutions. For this reason, a wave
of deregulation occurred throughout the last two decades of the twentieth
century.
In 1980,
Congress passed the Depository Institutions Deregulation and Monetary Control
Act, which served to deregulate financial institutions that accept deposits
while strengthening the Federal Reserve’s control over monetary policy.6 Restrictions on the opening of bank
branches in different states that had been in place since the McFadden Act of
1927 were removed under the Riegle-Neal Interstate Banking and Branching
Efficiency Act of 1994. Finally, the Gramm-Leach-Bliley Act of 1999 repealed
significant aspects of the Glass-Steagall Act as well as the Bank Holding Act
of 1956, both of which had served to sever investment banking and insurance
services from commercial banking.7 From 1999
onwards, a bank could now offer commercial banking, securities, and insurance
services under one roof.
All of this
deregulation helped to accelerate a trend towards increasing the complexity
of banking organizations as they moved to greater consolidation and conglomeration.
Financial institution mergers increased with the total number of banking
organizations consolidating to under 8000 in 2008 from a previous peak of
nearly 15,000 in the early 1980s.8 While banks
have gotten bigger, the conglomeration of different financial services under
one organization has also served to increase the complexity of those
services. Banks began offering new financial products like derivatives and
began packaging traditional financial assets like mortgages together through
a process of securitization.
At the same
time that these new financial innovations were being praised for their
ability to diversify risk, the sub-prime mortgage crisis of 2007 that
transformed into a global financial crisis and the need for the bailout of
U.S. banks that had become “too big to fail” has caused the government to
rethink the financial regulatory framework. In response to the crisis, the
Obama administration passed the Dodd-Frank Wall Street Reform and Consumer
Protection Act in 2010, aimed at many of the apparent weaknesses within the
U.S. financial system.9 It may take
some time to see how these new regulations affect the nature of banking
within the U.S.
The Bottom
Line
In antebellum
America, numerous attempts at increased centralized control and regulation of
the banking system were tried, but fears of concentrated power and political
corruption served to undermine such attempts. Nevertheless, as the banking
system grew, the need for ever-increasing regulation and centralized control,
led to the creation of a nationalized banking system during the Civil War,
the creation of the Federal Reserve in 1913, and the New Deal reforms under
Roosevelt.4 While the
increased regulation led to a period of financial stability, commercial banks
began losing business to more innovative financial institutions,
necessitating a call for deregulation. Once again, the deregulated banking
system evolved to exhibit even greater complexities and precipitated the most
severe economic crisis since the Great Depression. Dodd-Frank was the
response, but if history is any guide, the story is far from over, or
perhaps, the pendulum will continue to swing.
Why Are
Banks Regulated? (FYI)
January
30, 2017
By Julie L Stackhouse
This
post is the first in a series titled “Supervising Our
Nation’s Financial Institutions.”
Supervising Our Nation’s Financial Institutions The
series, written by Julie Stackhouse, executive vice president and
officer-in-charge of supervision at the St. Louis Federal Reserve, is
expected to appear at least once each month throughout 2017.
The
topic of financial deregulation is once again generating news stories. It
raises a foundational question: “Why is the U.S.
banking system so heavily regulated?”
Banking
regulation has existed in some form since the chartering of banks and its
goals have evolved over time. Today, banking regulation serves four main
purposes.
Financial
Stability
Instability
in the financial system can have material ripple effects into other parts of
the domestic and international financial sectors. Supervision that is focused
on financial stability (often called macro-prudential supervision) looks at
trends and analyzes the likelihood for financial contagion and the possible
impacts across firms that pose systemic risks.
Protection
of the Federal Deposit Insurance Fund
Since
Jan. 1, 1934, the Federal Deposit Insurance Corp. has insured the deposits
held in U.S. banks up to a defined amount (currently $250,000 per depositor
per bank). The federal government serves as a backstop to the insurance fund.
In
exchange for this insurance guarantee, banks pay an insurance premium and are
also subject to safety and soundness examinations by state and/or federal
regulators. Oversight of individual financial institutions by banking
regulators is called micro-prudential supervision.
While
the insurance fund protects depositors, it does not protect shareholders of
banks. When inappropriate risks are taken and prove unsuccessful, banks will
fail and be liquidated.
Consumer
Protection
Since
the creation of the Federal Trade Commission in 1914, the federal government
has had a formal obligation to protect consumers across industries. Since
that time, numerous laws and regulations have been crafted by various
agencies to protect bank customers and promote fair and equal access to
credit.
Banks
conduct financial transactions with consumers either directly (lending to
consumers and taking consumer deposits) or indirectly (through financial
technology on the front end, for example). Banking regulators enforce
consumer protection regulations by conducting comprehensive reviews of bank
lending and deposit operations and investigating consumer complaints.
Competition
A
competitive banking system is a healthy banking system. Banking regulators
actively monitor U.S. banking markets for competitiveness and can deny bank
mergers that would negatively affect the availability and pricing of banking
services.
Although
fewer than 40 banks account for more than 70 percent of all U.S. banking
assets, as shown in the table below, there are nearly 6,000 institutions of
all sizes operating in communities across the country.
US
BankSystem
While
all banks are regulated, not all regulations apply to every bank. We’ll discuss some of these differences in future posts. In
my next post, I’ll discuss how the banking system has
changed over time—especially over the past 25 years—adding to the complexity and scope of banking regulation
in the U.S.
For discussion: As
compared with small banks, do big banks are relatively more burdened by
regulations? Or vice versa?
Federal Reserve and Monetary Policy
Part I - Fed Introduction
In
Plain Enlgish Fed St. Louise (Cool video about Fed)
For discussion:
1.
What is FOMC? How many members? How
many time does FOMC meet? What is determined at FOMC meeting?
2.
What is reserve bank? For our area,
where is the reserve bank located?
3.
What is board of governor? How many
members? Who is the chair?
Macro 4.5- The Federal Reserve System- Quick Overview
(video)
For discussion:
1.
How to conduct monetary policy?
2.
What is the role of Fed?
3.
What is the role of New York Fed?
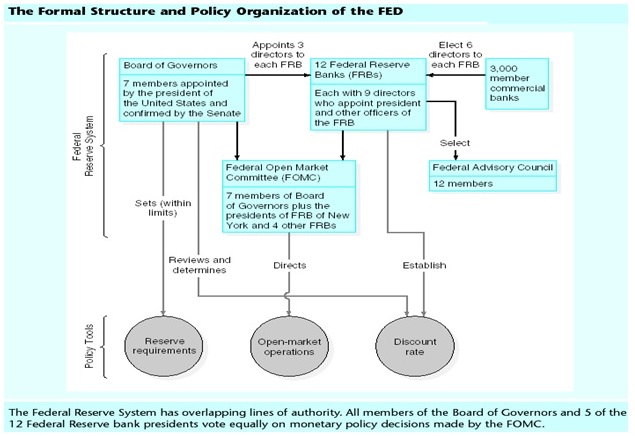
***** FRB – Federal Reserve Banks *******
Federal Reserve Bank
of Atlanta
Federal Reserve Bank of Atlanta's Boardroom Video
(youtube)
2021 Commencement Keynote: Raphael Bostic President
& CEO of the Federal Reserve Bank of Atlanta (youtube)
Federal Reserve Bank
of Atlanta – Jacksonville regional office
https://www.atlantafed.org/rein/jacksonville
ATLANTA FED GOES TO THE GRASSROOTS:
OBSERVING WHAT'S HAPPENING IN THE ECONOMY – Jacksonville
(video)

Part
II: Monetary Policy
The
Fed Explains Monetary Policy (video)
The
Tools of Monetary Policy (video)
For class discussion:
1. Three approaches to conduct Monetary policy.
2. What
is easing (expansionary) monetary (policy? What
is contractionary monetary policy?
3. Draw
supply and demand curve to show the results when Fed purchases (sells)
Treasury securities.
4. Compare
fed fund rate with discount rate. Which
rate is targeted by Fed to implement monetary policy?
6. What
is open market operation? Segment
406: Open Market Operations(video of Philadelphia Fed)
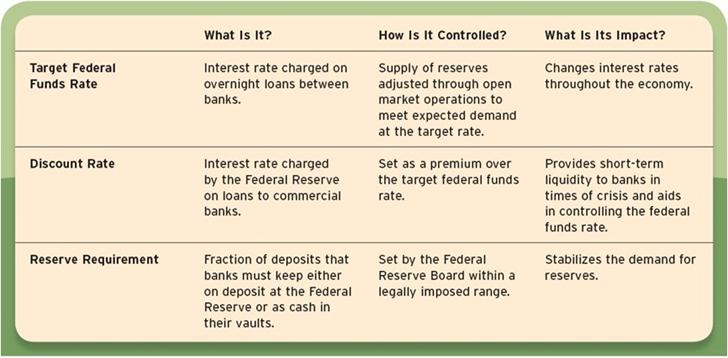
********** Fed Funds Rate *********

Release
date: Oct 1, 2022
https://fred.stlouisfed.org/graph/?g=pbTc
What
is the Fed Fund rate (youtube)
Part III: Open Market
Operation
How Do Open
Market Operations Affect the U.S. Money Supply?
By KESAVAN BALASUBRAMANIAM Updated April 08, 2022, Reviewed by
MICHAEL J BOYLE, Fact checked by MARCUS REEVES
https://www.investopedia.com/ask/answers/06/openmarketoperations.asp
The U.S. Federal
Reserve conducts open market operations by buying or selling bonds and other
securities to control the money supply. With these transactions,
the Fed can expand or contract the amount of money in the banking system and
drive short-term interest rates lower or higher depending on the objectives
of its monetary policy.
KEY TAKEAWAYS
· The Federal Reserve buys and sells government securities to
control the money supply and interest rates. This activity is called open
market operations.
· The Federal Open Market Committee (FOMC) sets monetary policy in
the United States, and the Fed's New York trading desk uses open market
operations to achieve that policy's objectives.
· To increase the money supply, the Fed will purchase bonds from banks,
which injects money into the banking system.
· To decrease the money supply, the Fed will sell bonds to banks,
removing capital from the banking system.
· Open market operations have played a key part in navigating
recent economic downtowns including the 2008 Global Financial Crisis and the
COVID-19 recession.
The Importance
of Open Market Operations
Open market operations are one of three key tools the Federal
Reserve uses to achieve its policy objectives. The objective of open market
operations is to change the reserve balances of U.S. banks and cause
reactionary changes to prevailing interest rates.
The Fed can increase the U.S. money supply by buying securities.
Using newly created money, the Fed can go to the market, inject this capital
into U.S. banks, and apply downward pressure on market interest rates as
lenders now have more money to distribute as credit. The Fed can also
decrease the U.S. money supply by doing the opposite. By selling securities
it is holding on its balance sheet, the Fed can extract capital from bank
reserves and decrease the amount of funds banks have available to lend.
Open market operations are important as it attempts to guide the
direction of the economy. When the Fed is buying securities and increasing
the money supply, the Fed is attempting to stimulate economic growth. This
typically has a ripple effect of increased inflationary pressure, higher
economic growth, higher employment, and generally greater economic prosperity
for citizens and companies.
Open market operations also signal when the Fed believes
inflationary pressure has gotten too high and the economy needs to contract.
By selling securities, the Fed attempts to raise rates, slow economic growth,
and stem inflation. Unfortunately, contractionary economic periods like this
also traditionally cause increases in unemployment. It also makes obtaining
credit more expensive for companies and citizens.
The Role of the Federal Open Market Committee
The Federal Open Market Committee (FOMC) sets monetary policy in
the United States with a dual mandate of achieving full employment and
controlling inflation. The committee holds eight regularly scheduled meetings
each year, though emergency sessions may be called.
During these meetings, the FOMC determines whether to increase
or decrease the money supply in the economy. This decision is driven by the
FOMC's long-term goals of price stability, sustainable economic growth, and
prevailing market conditions. The New York Fed's trading desk then conducts
its market operations with the aim of achieving that policy, buying or
selling securities in open market operations.
Expanding the Money Supply to Fuel Economic Growth
During a recession or economic downturn, the Fed will seek to expand
the supply of money in the economy with a goal of lowering the federal funds
rate—the rate at which banks lend to each other overnight.
To do this, the Fed trading desk will purchase bonds from banks
and other financial institutions and deposit payment into the accounts of the
buyers. This increases the amount of money that banks and financial
institutions have on hand, and banks can use these funds to provide loans.
Contracting the Money Supply to Stabilize Prices
The Fed will undertake the opposite process when the economy is
overheating and inflation is reaching the limit of its comfort zone. When the
Fed sells bonds to the banks, it takes money out of the financial system,
reducing the money supply.
Example of Monetary Contraction
By the end of 2021, the Federal Reserve was faced with rapidly
escalating inflation and a booming economy. To try and preserve price
stability, The Fed announced it would begin tapering its purchase of Treasury
securities. Starting December 2021, the Fed began buying $10 billion less
Treasury securities each month and $5 billion of agency mortgage-backed
securities each month.
This will cause interest rates to rise, discouraging individuals
and businesses from borrowing. In theory, consumers will spend, consumer,
borrow, and invest less. It will also become more expensive for companies to
expand. The impact of both outcomes is to slow inflation and economic growth,
though the downside risk is an increase in unemployment.
Segment 406: Open Market Operations (youtube, by the Fed)
No Homework assignment.
Please find time to work on term project which is due with final.
2022 FOMC Meetings (FYI)
January
25-26
Statement:
PDF | HTML
Implementation Note
Press Conference
Statement on
Longer-Run Goals and Monetary Policy Strategy
Principles for
Reducing the Size of the Federal Reserve's Balance Sheet
Minutes:
PDF | HTML
(Released February 16, 2022)
March
15-16*
Statement:
PDF | HTML
Implementation Note
Press Conference
Projection
Materials
PDF | HTML
Minutes:
PDF | HTML
(Released April 06, 2022)
May
3-4
Statement:
PDF | HTML
Implementation Note
Press Conference
Plans for Reducing
the Size of the Federal Reserve's Balance Sheet
Minutes:
PDF | HTML
(Released May 25, 2022)
June
14-15*
Statement:
PDF | HTML
Implementation Note
Press Conference
Projection
Materials
PDF | HTML
Minutes:
PDF | HTML
(Released July 06, 2022)
July
26-27
Statement:
PDF | HTML
Implementation Note
Minutes:
PDF | HTML
(Released August 17, 2022)
September
20-21*
Statement:
PDF | HTML
Implementation Note
Press Conference
Projection
Materials
PDF | HTML
Minutes:
PDF | HTML
(Released October 12, 2022)
November
1-2
Statement:
PDF | HTML
Implementation Note
December
13-14*
Study guide for Final (on
Options, Banks, the Fed;
30 multiple
choice questions)
11/17,
11:30 AM – 2 PM: Final
Exam; Term project due
Chapter 9 Options
1. What is call option?
2. What is put option?
3. When interest rate increases (decrease), can call
option holder benefit from it?
4. When interest rate increases (decrease), can put
option holder benefit from it?
5. When the recession news just hit the market,
between call and put option holders, who can benefit from this news?
6. What are the five factors that are associated with
option pricing?
7. What is the most popular option pricing model? (https://www.investopedia.com/terms/b/blackscholes.asp#:~:text=The%20Black%2DScholes%20model%2C%20aka,free%20rate%2C%20and%20the%20volatility
Banks
1. What is bank run? It is rare. Why?
2. Why are banks reluctant to lend out to small
business, but offer loans to homebuyers?
3. Too big too fail. What is your opinion on this
statement? Should we worry about banks getting bigger and bigger? Why or why
not?
4. How to explain the uniqueness of banks’ balance
sheet. For example, banks are highly leveraged.
5. What are
the differences between commercial bank and investment bank?
6. What are the pro and con for big banks?
The Fed
1. What is the purpose of the Fed? The structures of the Fed?
2. The three approaches to conduct Monetary
policy.
3. Compare fed fund rate with discount rate. Which
rate is targeted by Fed to implement monetary policy?
4. What is open market operation? When Fed plans to increase interest rate,
how can Fed do so via open market operation?
5. If Fed does increase interest rate in mid Dec,
what is your prediction of its impact in the stock market? If Fed does not
increases interest rate, what will happen to the stock market?
6. What is easing monetary policy? What is
contractary monetary policy?
Happy Holidays!
Happy Holidays!