Banking: How It Works
What banks do, how they make money, why they sometimes fail, and how inflation and interest rates change their decisions.
1) Intro Banks as “plumbing” for the economy
Banks move funds from savers to borrowers, run payments, and transform risk/maturity. When they work, they are invisible; when they don’t, everything else struggles.
Explore the essentials
- Three pillars: Intermediation • Payments • Safekeeping
- Three classic risks: Credit • Liquidity • Interest-Rate Risk
- Safety net: Capital, Liquidity buffers, Supervision, Deposit Insurance, Central-Bank backstops
🧾 Historical Sample Bank Account Comparison (Fall 2025)
| Institution | Basic Checking | Savings APY | Notes |
|---|---|---|---|
| Chase | $12/mo (waived with $500 DD) | ≈0.01% | Huge ATM network, good app. |
| Bank of America | $12/mo (waived with $250 DD) | ≈0.01% | Preferred Rewards perks if balance >$20k. |
| Wells Fargo | $10/mo (waived with $500 DD) | ≈0.01% | Large branch network. |
| VyStar CU | $0 (no monthly fee) | ≈0.10% | Strong local presence, member-owned, good car loan rates. |
| Ally / SoFi (Online) | $0 | ≈4.25% | No branches, high-yield savings, ATM reimbursements. |
Historical illustrative rates and fees, not current offers. Check each institution’s site before comparing accounts today.
Today’s banking setting: elevated inflation and higher rates
As of September 2026, August CPI inflation was 3.4% over 12 months, above the Fed’s 2% goal. On September 16, the Fed raised its target range for the federal funds rate to 3.75%–4.00%. These figures are dated; rates entered in the calculators and game are hypothetical, not current market quotes.
Depositors
When rates rise, customers may seek higher yielding accounts. A bank may pay more to keep deposits, increasing its funding cost.
Borrowers
New loan rates may rise, but some existing fixed rate loans do not reprice quickly. Higher payments can reduce demand or make repayment harder for some borrowers.
Bank managers
Older fixed rate bonds can lose market value when rates rise. Managers must watch interest margin, credit losses, liquidity, and capital together.
Explore: Explore bank interest income and costs, the duration gap, and withdrawal risk. A higher loan rate alone does not guarantee higher profit if funding costs and defaults rise too.
Sources: BLS, August 2026 CPI · Federal Reserve, September 16, 2026 statement.
Watch and play: run a bank
2. Play The Banker’s Path
The short explainer video now appears at the top of the game, just above the banker choices.
Start with a $100 deposit. Choose a borrower and loan size, then manage withdrawals, defaults, funding, and the Fed’s emergency lending across ten rounds.
The game opens in a separate page.
After playing: connect the game to inflation
Play again with a different banker style. Which decision leaves more cash for withdrawals? If deposit costs and loan rates rise together, what happens to your margin? How could higher borrower costs change default risk? The game uses fixed conditions. Consider how higher inflation and rates might change your decisions.
2) What Banks Do Transformations
Risk Transformation
Pool many risky loans ⇒ diversify idiosyncratic risk; screen/monitor borrowers.
Show simple example
Expected loss ≈ p(default) × exposure; diversification reduces variance; capital covers unexpected loss.
Maturity Transformation
Borrow short (deposits) and lend long (loans/securities).
Why it’s risky
Deposits can reprice/leave quickly while assets are fixed-rate and illiquid → duration gap. See IRR demo.
Liquidity Services
Checking/ATMs/wires/card rails keep payments flowing.
Everyday example
- Direct deposit, debit cards, Zelle/ACH, ATM fees
- Overdraft vs. account alerts; fraud holds & provisional credit
3) Bank Balance Sheet (T-Accounts)
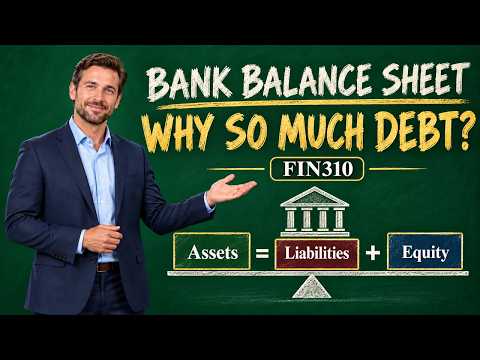
Assets
- Reserves at Fed / Cash
- Loans (retail, mortgage, commercial)
- Securities (Treasuries, MBS)
Liabilities & Equity
- Deposits (demand/time)
- Wholesale funding (repo, CP)
- Equity (capital)
Click to run a quick T-account shock
| Assets | Liabilities & Equity |
|---|---|
| Reserves: 100 | Deposits: 1000 |
| Loans: 900 | Equity: ≈0 |
| Total Assets: 1000 | Total Liabs+Eq: 1000 |
How the loan and deposit appear
Make a $1000 loan → bank credits a deposit (liability +1,000) and splits assets: 100 to reserves and 900 to loans. Total assets now = 1,000, exactly matching total liabilities. Equity stays ~0 at origination.
4) Deposits & Money Creation
When a bank approves a $100 loan, it normally credits the borrower’s deposit account by $100. The bank now has a $100 loan asset and owes the borrower a $100 deposit liability. The deposit is spendable money; it is not $100 of bank profit.
If that money moves to another bank, the lending bank must settle the payment and manage its liquidity. Its ability to lend depends on creditworthy borrowers, capital, funding, liquidity, and regulation. See the balance sheet example for the asset and liability entries.
5) How Banks Earn Money (Net Interest Margin & fees)
🏦 To run a healthy bank for the long term:
- Lend wisely
- Keep cash ready for withdrawals
- Earn enough to absorb losses
Interest side: Quick NIM Calculator
Interest income: interest earned on loans and securities. Interest expense: interest paid on savings accounts, CDs, interest-bearing checking, and other borrowed funds. Repaying a deposit or loan principal is separate from interest expense.
Earning assets: the bank’s assets that earn interest, mainly loans, bonds, and interest-bearing balances at the Fed. Buildings and cash sitting in a vault do not earn interest. For a real NIM, use the average earning-assets balance over the same period as the interest income and expense.
This interest calculation excludes fees. Change the fee examples on the right to see how they affect the separate return measure.
What the numbers show
- NIM (Net Interest Margin):
(Interest income − Interest expense) ÷ Earning assets. - Fees do not change NIM. They enter the separate return calculation on the right.
How to play
- Change Interest income to simulate loan yields/mix.
- Change Interest expense to simulate deposit/wholesale costs.
- Scale Earning assets to see size effects (ratios may stay the same).
- Change the three fee categories on the right to see how fee income can offset lower net interest income in the simplified income ratio.
What the results say
- NIM = 3.30% means 3.30¢ of net interest per $1 of earning assets.
- With the starting inputs, $8 of fees lifts the income ratio to 4.10¢ per $1 of earning assets. It does not change the 3.30% NIM.
- If interest expense rises faster than interest income, NIM compresses. Fees can support total income but do not repair NIM.
Costs and risks not included
- Credit costs (provision for loan losses)
- Operating expenses & taxes
- Capital & liquidity requirements (CET1, LCR/NSFR)
Actual bank results also depend on credit losses, operating costs, and regulatory requirements.
Fee side: Try real examples
Change these example amounts. The calculator adds them and uses the total in the return measure below.
Notice: Fees raise this ratio but never enter NIM. This is not ROA: it divides by earning assets and leaves out credit losses, operating costs, and taxes.
Everyday example
ATM fees, overdraft, statement fees; avoid with alerts, autopay, and maintaining minimums.
5A) National vs Regional Banks Scale, funding, geography & risk
What typically differs?
- Scale: Nationals are very large; regionals smaller/local.
- Funding mix: Nationals more wholesale/markets; regionals more core deposits.
- Geography: Nationals diversify widely; regionals more concentrated.
- Reg burden: Nationals face more complex oversight.
- Income mix: Nationals more fee diversity; regionals more NIM-heavy.
Sample comparison
Translate each row
- Assets: Size ⇒ scale & complexity.
- Footprint: Diversification vs local risk.
- Funding: Core deposits cheaper/stable; wholesale flexible/volatile.
- Uninsured %: Higher ⇒ faster runs if confidence breaks.
- NIM: Spread earnings (may be thinner at huge scale).
- Fee share: More business lines diversify revenue.
Mini stress hint (uninsured vs HQLA)
What is HQLA?
HQLA = High-Quality Liquid Assets. These are assets that can be quickly sold or pledged to raise cash without major losses. Under the Liquidity Coverage Ratio (LCR), banks must hold enough HQLA to survive 30 days of severe outflows.
- Level 1: Most liquid, no haircut — cash, Fed reserves, U.S. Treasuries.
- Level 2A: Slight haircut — GSE securities (agency MBS), some sovereign bonds.
- Level 2B: Higher haircut — high-quality corporates, equities (up to 15% of HQLA).
A higher % of HQLA means the bank can handle more withdrawals before it must sell illiquid assets at fire-sale prices. Pair this with the uninsured deposit % to see stress vulnerability.
Quick quiz: which is more exposed to a local downturn?
5B) Which Bank Should You Choose? Life + Features
Check all that apply, then click See My Bank Match to get a suggestion and feature checklist.
Life Stage & Plans
Feature Priorities
Recommendation
Choose options and click below to see your result.
Bank Type Glossary (with Examples)
-
National bank: Nationwide reach, big ATM network, premium cards, mortgages.
Examples: JPMorgan Chase, Bank of America, Wells Fargo, Citibank. -
Regional bank: Regional footprint, strong for mortgages, local feel.
Examples: PNC Bank, Truist, Fifth Third, Regions Bank. -
Credit union / community bank: Low fees, personal service, car loan specialists.
Examples: VyStar Credit Union (FL), Navy Federal CU, local community banks. -
Online bank / fintech: Highest APYs, lowest fees, no branches.
Examples: Ally Bank, SoFi, Chime, Discover Bank, Capital One 360.
Compare current offers and availability where you live.
5C) Jargon Decoder Plain-English + where it shows up
Banking Terms & Why They Matter
| Term | Meaning | Why It Matters |
|---|---|---|
| NIM | Net Interest Margin | Earnings on loans/securities after paying for deposits/funding. |
| HQLA | High-Quality Liquid Assets | Cash/Treasuries to meet outflows. |
| LCR | Liquidity Coverage Ratio | Enough HQLA for 30-day stress? ≥100% goal. |
| TCE | Tangible Common Equity | Core loss-absorbing capital. |
| AOCI/OCI | Accumulated Other Comprehensive Income | Unrealized gains/losses (esp. AFS) in equity. |
| HTM vs AFS | Held-to-Maturity vs Available-for-Sale | HTM shields P&L; AFS marks hit AOCI. |
| IOR | Interest on Reserves | Fed rate on reserves; policy floor. |
Where to Find in Filings
- NIM: Income Statement + average earning assets.
- HQLA: Liquidity section/HQLA table.
- LCR: Liquidity/Reg capital section.
- TCE/CET1: Regulatory capital tables.
- AOCI: Balance Sheet (AOCI line).
- HTM/AFS: Investment securities note.
- IOR: Federal Reserve H.15 / FOMC.

5D) Jargon Snapshot by Bank Use latest 10-Q/Annual/NCUA
Click a metric in the left column to see its meaning. Values change each quarter; check the latest filing.
| Metric | JPMorgan Chase | Bank of America | Wells Fargo | VyStar CU |
|---|---|---|---|---|
NIMNet interest margin: (interest income − interest expense) ÷ average earning assets. It shows interest earnings after funding costs. Find it in the earnings supplement or MD&A. |
||||
HQLA (amount or % assets)High-quality liquid assets: assets such as cash, Fed balances, and eligible securities that can help meet withdrawals. HQLA is an amount, not a ratio. Find the HQLA table in the liquidity section; a credit union may report different liquidity measures. |
||||
LCRLiquidity coverage ratio: HQLA ÷ projected net cash outflows during 30 days of stress. It asks whether a covered bank has a liquid buffer for outflows. Look in the liquidity disclosures; it is generally not reported for credit unions. |
N/A (CU) | |||
TCE / CET1TCE means tangible common equity: common equity after removing intangible assets. CET1 is a separate regulatory capital measure. Both describe loss-absorbing capital, but they are not interchangeable. Check the capital table and any TCE reconciliation. |
||||
AOCI / OCIOther comprehensive income (OCI) includes certain gains and losses outside net income. AOCI is their accumulated balance in equity, including many unrealized AFS securities gains or losses. Find it in shareholders’ equity. |
||||
HTM vs AFS mixHeld-to-maturity (HTM) securities are generally carried at amortized cost; available-for-sale (AFS) securities are reported at fair value, with most changes going through OCI. Compare each category in the investment securities note. |
||||
IORB (reference)Interest on reserve balances (IORB) is the interest rate the Fed pays eligible institutions on reserve balances. It is a Fed policy rate, not a bank-specific financial ratio. Use the Fed’s current rate page. |
||||
Where to click (shortcuts)
- JPMorgan Chase — IR ▶ Quarterly Results ▶ 10-Q PDF + Pillar 3.
- Bank of America — IR ▶ Quarterly Results ▶ 10-Q + “Regulatory Capital”.
- Wells Fargo — IR ▶ Quarterly Supplement (NII/NIM) + 10-Q Liquidity section.
- VyStar CU — NCUA FPR (“Financial Performance Report”) ▶ NIM/Net Worth/Investments.
Research Links
6) Core Risks
Credit Risk
Borrower defaults or deteriorates.
Simple credit math
Expected loss ≈ PD × LGD × EAD. Capital covers unexpected loss.
Liquidity Risk
Need cash now; assets not liquid or too costly to sell/pledge.
Funding mix matters
Stable core deposits vs. volatile wholesale funding changes outflow rates.
Interest-Rate Risk
Duration mismatch: deposits reprice fast, assets slow.
Hedge idea
Use swaps to pay fixed/receive floating to reduce positive duration gap.
Mini duration gap demo
Why this matters
The duration gap measures how sensitive a bank’s net worth is to interest-rate changes.
Example: A gap of 4.2 years means roughly:
+1% rate shock → ≈ −4.2% drop in asset value (net of liabilities).
- ≤ 1 yr: Low interest-rate risk — bank is nearly hedged.
- 1–3 yrs: Moderate risk — NIM and capital may swing with rates.
- > 3 yrs: High risk — rapid hikes can wipe out equity if unhedged.
Real-world example — SVB (2023):
Silicon Valley Bank had very long-duration securities funded by short-term, uninsured deposits.
When the Fed hiked rates, asset values plunged. To meet withdrawals, SVB sold bonds at losses,
triggering panic and accelerating the run.
Conclusion: Manage duration gap with swaps, floating-rate loans, or shorter securities. Too much duration = dangerous for capital when rates rise.
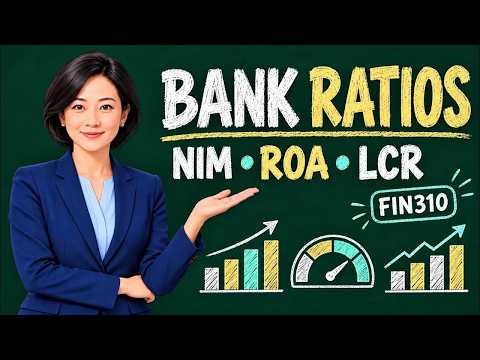
7) Bank Ratios: Learn One at a Time
Start with the question each number answers. Open a card, read its definition, then change the numbers. Your answer updates immediately.
1. NIM · Does lending earn enough after funding costs?Interest earnings
Net interest margin (NIM) is the interest earned on loans and securities, minus interest paid on deposits and borrowing, divided by average earning assets.
Example: ($52 − $19) ÷ $1,000 = 3.30%. That is 3.3¢ of net interest per $1 of earning assets.
NIM excludes fees, operating costs, and loan losses. A high NIM alone does not mean the bank is profitable or safe. Try the live NIM calculator above.
2. ROA · How much profit comes from all assets?Overall profit
Return on assets (ROA) compares net income after expenses and taxes with average total assets.
Example: $10 of net income ÷ $1,000 of average assets = 1.00%.
The “income ratio after fees” in Section 5 is not ROA: it does not subtract credit losses, operating costs, or taxes.
3. TCE to assets · What absorbs losses?Capital cushion
Tangible common equity (TCE) is a measure of the owners’ stake after removing certain intangible assets. A bank with more equity relative to assets generally has more room to absorb losses.
At 6%, the bank has about 6¢ of this equity measure per $1 of assets. This is a cushion against losses, not cash available to pay withdrawals.
4. HQLA · What can the bank use for cash soon?Liquid assets
High-quality liquid assets (HQLA) are eligible assets a bank can turn into cash in a stress. Examples include cash, balances at the Fed, and U.S. Treasuries. Eligible agency mortgage-backed securities can count in a different category with a haircut.
Remember: HQLA is an amount of assets, not a ratio. It is the top number in the LCR below.
5. LCR · Can the bank cover 30 days of stress?Liquidity coverage
Liquidity coverage ratio (LCR) compares HQLA with projected net cash outflows during a 30-day stress. For banks subject to the full rule, 100% means HQLA equals those projected outflows. Requirements vary by institution.
At 120%, the bank has $1.20 of HQLA for each $1 of projected net outflow. This two-input illustration omits regulatory adjustments and does not calculate an official LCR.
6. Apply both · Why did SVB face trouble in 2023?Capital and cash are different
Rising rates reduced the market value of long-term securities. Concentrated, largely uninsured depositors withdrew quickly. Selling securities to raise cash realized losses and intensified concern.
Ask yourself: Does the bank have a loss cushion? Can it meet withdrawals without selling assets at a loss? You need both answers. This simple example does not assign an LCR to SVB.
8) Bank Runs & Backstops
- Run mechanics: concerns → withdrawals → asset sales (losses) → more concerns.
- Fire sale risk: long-duration assets sold into rising-rate markets ⇒ realized losses.
- Backstops: Deposit insurance, discount window, emergency facilities, communications.
Try a withdrawal shock
Explain the hint
Higher uninsured + lower liquidity = faster runs historically; communication and pledging collateral can help.
9) 2023 Lessons (SVB-style profile)
- Concentration: client base with correlated cash-flow cycles.
- High share of uninsured deposits ⇒ fast, digital outflows.
- Large fixed-rate securities at low yields ⇒ big unrealized losses when rates rose.
- Communication & risk governance gaps.
- Backstop design matters (collateral valuation, term, stigma).
Five lessons from this case
- Don’t fund long fixed assets with hot money.
- Know your uninsured %, and pre-position collateral.
- Hedge duration when rates can rise.
- Explain your balance sheet clearly to depositors.
- Practice drills for outflow days.
From the 2008 crisis to a possible future shock
Watch the historical explanation first. Then use the 2027–28 video to test how a different shock could spread. The future paths are scenarios, not predictions.
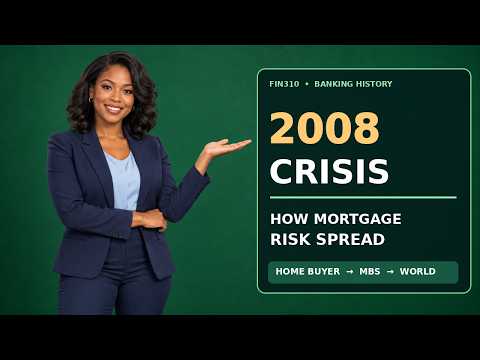
Historical case: follow subprime mortgages, mortgage-backed securities, investors, and funding.
▶ Watch on YouTube
Possible paths: Treasury yields, borrowing costs, asset values, the dollar, and funding stress.
▶ Watch on YouTube9A) Media Gallery Banking Concepts in Action
📺 Why the U.S. Has 4,500 Banks (vs. Canada’s 79)
Watch this short video for insight into why the U.S. banking landscape has thousands of banks while Canada has only a few dozen — a mix of history, regulation, and geography.
10) Mini Tools
11) Check Your Understanding
Three short quizzes · 10 true/false questions each. Choose an answer to see the correct answer and a short explanation immediately.
Quiz 1: Bank Fundamentals, Balance Sheet & Key Ratios (10 questions)
1. A customer deposit is a liability of the bank because the bank owes that money to the customer.
2. A loan made to a customer is a liability of the bank.
3. A bank’s assets must equal its liabilities plus its equity.
4. A bank’s equity is the same thing as the cash in its vault.
5. When a bank credits a new borrower’s deposit account, it records both a loan asset and a deposit liability.
6. A higher net interest margin (NIM) always means a bank has no credit losses.
7. Interest paid on savings accounts and CDs is an interest expense for a bank.
8. ATM and service fees are included in net interest margin.
9. A capital ratio helps show how much loss-absorbing capital a bank has relative to its assets or risk-weighted assets.
10. The liquidity coverage ratio measures how much income a bank earned from fees.
Quiz 2: National vs. Regional Banks (10 questions)
1. A national bank generally operates across more places than a regional bank.
2. Every regional bank has exactly the same funding mix and customers.
3. A regional bank focused on one area may be more exposed to a downturn in that area.
4. A national bank cannot face a bank run because it has branches in many states.
5. Large national banks may earn fees from a wider range of services.
6. A regional bank is always safer than a national bank solely because it is smaller.
7. National banks often have access to more types of funding, including capital markets.
8. Regional banks never offer mortgages or business loans.
9. A national bank may be less dependent on one local economy because it serves many markets.
10. The best bank for every customer is always a national bank.
Quiz 3: Bank Risk — Concepts Only (10 questions)
1. If borrowers stop repaying their loans, the bank faces credit risk.
2. Liquidity risk means a bank’s buildings lose value whenever interest rates rise.
3. When many depositors withdraw money at once, a bank may need cash quickly.
4. An uninsured depositor has no reason to watch the financial condition of a bank.
5. Long-term fixed-rate assets can lose market value when interest rates rise.
6. Selling an investment at a loss can turn a paper loss into a realized loss.
7. Holding more cash for withdrawals removes all credit risk from a bank’s loans.
8. A bank run may worsen when customers see other customers rushing to withdraw.
9. Bank capital and ready cash serve exactly the same purpose.
10. A bank can ignore funding costs as long as the interest rate on its loans stays unchanged.
12) Homework: Which Bank Fits You?
Complete the steps below as your Session 5 homework.
- Run the tools: Use Which Bank Should You Choose? and skim National vs Regional. Note your selected checkboxes and the recommendation you received.
- Your pick: State your recommended bank type and explain why using at least 3–5 criteria.
- Reality check: Which institution do you currently bank with? Compare features you have vs. need.
-
Feature checklist:
Feature Must-Have Nice-to-Have My Current Bank My Recommended Type Monthly/overdraft fees & minimums ATM/branch access where I’ll live Payments (Zelle/ACH/wires), app quality International usage/FX & ATM fees Savings/APY & goals (emergency fund) Upcoming loans (auto/mortgage) Perks (cash-back/travel/student) - Action plan: Will you stay or switch? If switching, list the top 3 features and how you’ll do it. If staying, what would make you reconsider.
- Attach evidence (optional): Screenshot your selections and any fee/APY pages you consulted.
Verify fees and APYs on official sites before choosing an account.

These calculators omit some real-world costs and rules; do not use their results as regulatory measures.