Video 1 — International Trade 101 (baseline)
Economics Explained (YouTube)
Open on YouTube
If embed is blocked, use “Open on YouTube”.
What you should get from Module 3
By the end, you should be able to:
- Explain current account vs financial account in one sentence (flow vs financing/ownership).
- Interpret a current-account deficit correctly (what it is, and what it is not).
- Connect BoP to the identity CA ≈ S − I (saving vs investment).
- Describe financing composition: FDI vs portfolio vs bank flows vs reserves.
Video 2 — The Balance of Payments Explained (NEW)
You asked to add this video too.
Open on YouTube
Use this as the “BoP accounting” anchor.
Reading links (high value)
BEA: U.S. International Transactions (BoP)
FRED: Macro data (CA, trade, yields)
IMF BPM6 (BoP Manual)
World Bank: Current account (% GDP)
Note: In modern reporting (IMF BPM6 / BEA), we separate:
Current account, Capital account (small), and the Financial account.
A classroom identity is: CA + KA + FA + E&O = 0.
Sign conventions differ across sources; focus on the balancing logic.
Why Balance of Payments matters
BoP is the scoreboard for a country’s trade + income + financing with the rest of the world.
FX pressure • current account deficits can raise demand for foreign currency (context matters)
Financing risk • “who funds whom” shows rollover/refinancing exposure
Policy lens • tariffs, sanctions, capital controls show up in accounts
Markets • flows tie into rates, spreads, and sentiment
High-level interpretation (what you should say in an interview)
A current-account deficit means the country is a net buyer of foreign goods/services and/or is paying more net income/transfers abroad.
It must be offset by net financial inflows (someone buys the country’s assets or lends to it), or reserve changes, plus errors/omissions.
Meaning • A current-account deficit means: “We spent more on foreign goods/services/income/transfers than we earned—so we covered the gap by selling assets/borrowing (financial-account inflow) or using reserves.”
Key habit: Always ask:
(1) What drives CA (trade vs income vs transfers)?
(2) How is it financed (FDI vs portfolio vs bank flows vs reserves)?
One picture: flows vs financing
Exam sentence: “A current-account deficit is financed by net capital inflows in the financial account (plus errors/omissions).”
Topic 1: What is the Balance of Payments (BoP)?
The Balance of Payments is the accounting framework that records a country’s transactions with the rest of the world.
It tracks flows (trade + income + transfers) and the matching financing/ownership flows (FDI, portfolio, loans, reserves).
| Account | What it records | Common examples |
|---|---|---|
| Current Account | Goods & services trade, primary income (interest/dividends/wages), and current transfers. | Exports/imports; tourism; interest received/paid; remittances; foreign aid. |
| Capital Account | Capital transfers and acquisition/disposal of certain non-produced, nonfinancial assets. | Debt forgiveness (capital transfer); certain IP-type transactions (depending on reporting). |
| Financial Account | Cross-border ownership/financing flows: FDI, portfolio investment, derivatives, other investment, reserves. | Foreign firm builds a factory (FDI); buying foreign stocks/bonds; cross-border loans; changes in FX reserves. |
Key identity
A commonly used identity is:
Current + Capital + Financial + Errors/Omissions = 0
Interpretation: if the current account is negative, the financial account tends to be positive (net inflows) to “fund” it.
Important: The capital account is usually small. Most “cross-border investment/borrowing” shows up in the financial account.
Myths vs Reality (Current-Account Deficits)
These are the exact “confusions” you might have.
Exam-ready wrap: “A deficit is not automatically bad. Evaluate (1) CA ≈ S − I,
(2) financing composition (FDI vs portfolio vs bank flows), and (3) sustainability (maturity, currency, productivity).”
Myth: “Deficit = the country is broke.” Flow vs solvency
Reality: A deficit is a flow outcome, not a bankruptcy verdict. It can persist if financing is stable and obligations are manageable.
Myth: “Trade deficit means we are ‘losing’.” CA is broader
Reality: The current account includes services, investment income, and transfers, not just goods trade.
Myth: “If we cut imports, the deficit must shrink.” General equilibrium
Reality: Not always. In CA ≈ S − I, durable improvement usually means higher saving and/or lower investment.
Myth: “A deficit always weakens the currency.” Capital flows
Reality: FX depends on rate differentials, risk sentiment, and inflows. A deficit can coexist with a strong currency if inflows are large.
Myth: “Foreigners owning assets is automatically dangerous.” Composition matters
Reality: Long-term FDI/equity-like financing is typically more stable than short-term foreign-currency debt or hot money.
Myth: “Surplus countries are always healthier.” Demand vs saving
Reality: Context matters. Surplus can reflect strength—or weak domestic demand/underinvestment.
Myth: “Deficits don’t matter for reserve-currency issuers.” Not a free pass
Reality: Reserve status helps financing, but does not eliminate constraints. Composition still matters.
Financing quality checklist Use in essays
- More stable: FDI, long-term equity-like inflows, long-maturity local-currency liabilities
- More fragile: short-term bank flows, foreign-currency debt, hot money chasing yield
Why does the U.S. run persistent current-account deficits?
A practical explanation that can be used in discussions and exams.
U.S. current account snapshot (last ~10 years):
Loading chart…
Source: FRED (BOPBCA).
Click the chart to see exact quarterly values.
Core macro identity (classroom version):
Current Account (CA) ≈ National Saving (S) − Investment (I)
If S < I, the country typically runs a CA deficit and borrows from (or sells assets to) the rest of the world.
Current Account (CA) ≈ National Saving (S) − Investment (I)
If S < I, the country typically runs a CA deficit and borrows from (or sells assets to) the rest of the world.
Four common U.S. drivers
- Low national saving relative to investment: household, corporate, and government saving patterns.
- Reserve-currency demand: global investors demand USD assets (Treasuries, agencies, equities), enabling financing.
- Strong domestic consumption: importing consumer goods and intermediate inputs at scale.
- Global portfolio allocation: foreign savers allocate into deep, liquid U.S. markets.
Quick “exam-ready” answer template
Copy this structure.
If asked: “Why does the U.S. have a current-account deficit?”
Use a 3-part response:
- Accounting: CA deficit means the U.S. buys more foreign goods/services and/or pays more net income/transfers than it receives.
- Macro driver: CA ≈ S − I, so deficits often reflect saving shortfalls relative to investment.
- Financing: The U.S. can finance deficits because global investors demand USD assets (deep markets; reserve currency).
Good nuance: “Deficits are not inherently bad.” The key is sustainability and financing quality (stable vs fragile inflows).
BEA chart — Quarterly U.S. Current Account and Component Balances (NEW)
This is the “components” picture: goods vs services vs income vs the overall current account.
How to read this: The goods balance is usually the big negative; services and primary income often offset part of it.
The orange line is the overall current account.
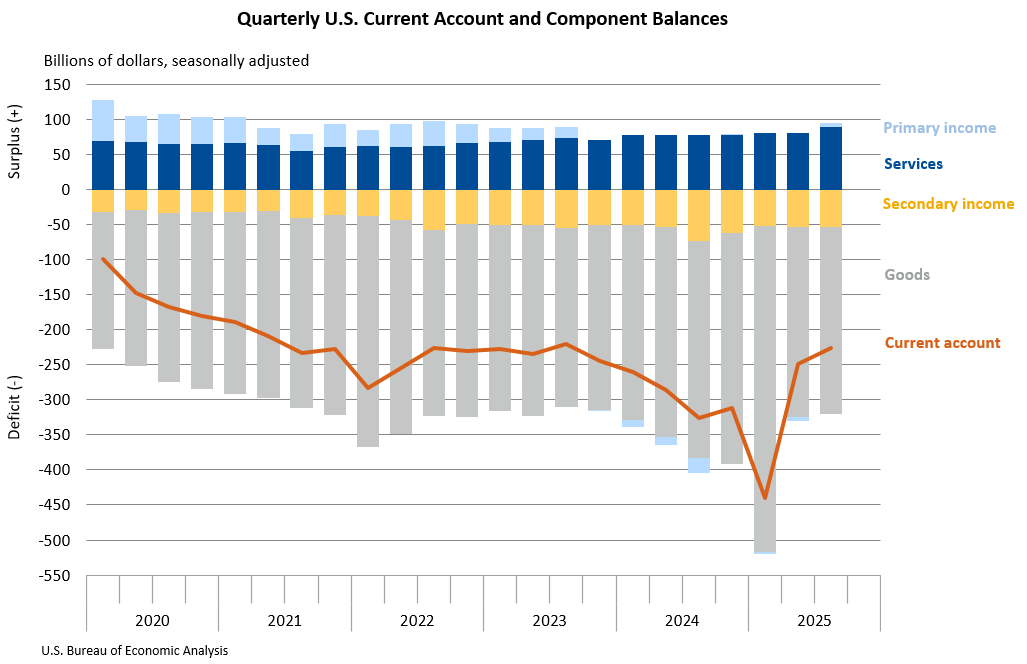
Source: U.S. Bureau of Economic Analysis (BEA) — U.S. International Transactions, 3rd Quarter 2025.
Tip for students: describe (1) trend, (2) largest component, (3) what changed in 2024–2025, (4) what that implies for financing in the financial account.
Current account components (what to memorize)
| Component | Meaning | Examples |
|---|---|---|
| Goods balance | Exports − imports of goods. | Cars, electronics, oil, agricultural products. |
| Services balance | Exports − imports of services. | Tourism, shipping, consulting, cloud services. |
| Primary income | Net income on investments and compensation (interest/dividends/wages). | Interest received on foreign bonds; dividends; cross-border wages. |
| Current transfers | One-way transfers not tied to assets. | Remittances, foreign aid, gifts. |
Sign intuition (surplus vs deficit)
Surplus: net inflows from trade/income/transfers (credits exceed debits).
Deficit: net outflows on current transactions (debits exceed credits).
Deficit: net outflows on current transactions (debits exceed credits).
Financial account (how deficits get financed)
Think “ownership and lending.” This is where funding shows up.
| Bucket | What it includes | Examples |
|---|---|---|
| FDI | Longer-term ownership/control investment. | Foreign firm builds/buys a factory; acquisitions. |
| Portfolio | Stocks and bonds (non-controlling stakes). | Foreign purchases of Treasuries, corporate bonds, U.S. equities. |
| Other investment | Loans, deposits, trade credit (often shorter-term). | Cross-border bank loans; corporate borrowing; deposits. |
| Reserves | Official reserve assets (central bank). | Changes in FX reserves (common for pegging/managed FX systems). |
Shortcut: Current account = “trade + income + transfers.” Financial account = “who buys whose assets / who lends to whom.”
Data dashboard (useful in real life)
Use these sources for “latest numbers” instead of memorizing stale tables.
| Question you want to answer | Best starting source | What to look for |
|---|---|---|
| U.S. current account (level and trend) | BEA International Transactions | CA balance; goods/services; primary income; transfers |
| Trade deficit (goods vs services) | BEA trade tables + FRED | Goods deficit vs services surplus; cyclical vs structural drivers |
| International investment position (IIP) | BEA IIP tables | Net foreign assets; who owns U.S. assets; maturity and currency mix |
| Cross-country CA comparisons | World Bank + IMF | CA as % of GDP; persistent surplus/deficit countries |
Optional: live pull from FRED (advanced; needs an API key)
This page stays “no external libraries.” You can still click FRED links or use the chart image (above).
Current account calculator (fast practice)
Enter components and immediately see CA and interpretation.
Enter components (billions, or any consistent units)
Goods & services balance
Net primary income
Net current transfers
Ready.
Interpretation rule: If CA is negative, the country must attract net financial inflows (sell assets / borrow) or run down reserves.
Country comparison (U.S., China, Japan, Canada, Brazil)
Instead of memorizing stale values, learn the “pattern + driver” for each country.
| Country | Typical pattern (conceptual) | Main driver |
|---|---|---|
| United States | Often CA deficit; financed by large portfolio inflows | Reserve currency demand + deep capital markets; S < I identity |
| China | Historically surplus periods; large goods exports; policy-influenced FX/reserves | High saving rate; export structure; managed FX at times |
| Japan | Often surplus; strong net foreign asset position; aging demographics | High saving, overseas income flows; portfolio allocation abroad |
| Canada | Resource-linked swings; deficit/surplus varies with commodity cycle | Terms of trade: oil/commodities affect trade balance and income |
| Brazil | Often sensitive to commodity prices and capital flows | External financing conditions; risk premium; commodity cycle |
How to answer: “Compare U.S. vs China vs Japan”
Use this structure:
- Pattern: deficit vs surplus vs cyclical.
- Driver: saving/investment, demographics, export structure, commodity dependence.
- Financing: portfolio/FDI vs reserves vs bank flows.
- Risk: sensitivity to rates/FX vs stable financing.
Editable comparison chart (enter CA % of GDP)
Paste the latest values from World Bank/IMF and the chart updates.
U.S. (CA % GDP)
China
Japan
Canada
Brazil
Ready.
Interpretation: Surplus countries export net saving; deficit countries import net saving.
Interactive Game A: Account Sorter (Current vs Capital vs Financial)
Choose which account each transaction belongs to. Then click Grade.
Not graded yet.
Interactive Game B: Current Account Impact (Increase or Decrease?)
For each item, decide whether it increases or decreases the current account balance.
Not graded yet.
Quiz 2 (Trade Policy & Current Account) — link
Open the quiz on its own page.
Module 3 Homework (Due with the first midterm exam)
Make it interesting: This is a “BoP War Room” scenario. Your job is to brief decision-makers using
the channels below. Do not answer with one-liners.
Separate: (a) import volume effects, (b) exchange-rate effects, (c) retaliation & export losses,
(d) income/transfer channels, and (e) financing composition (FDI vs portfolio vs short-term flows).
Part 1 — Trade war: can it shrink the deficit?
Answer using channels (a)–(e). Your conclusion can be “yes,” “no,” or “depends,” but you must justify with mechanisms.
Question
Can a trade war help reduce the current account deficit? Why or why not?
How do tariffs impact the current account deficit in the context of ongoing trade disputes?
How do tariffs impact the current account deficit in the context of ongoing trade disputes?
Part 2 — “Retaliation + sell U.S. bonds” scenario (the fun part)
A major trading partner announces: (i) retaliatory tariffs on U.S. exports, and (ii) a shift away from U.S. financial assets
(Treasuries and/or U.S. equities). Your task is to map what hits CA vs what hits FA, and how FX and yields mediate.
Key conceptual point: “Selling U.S. bonds” is primarily a financial account event (portfolio outflows). It does
not directly change the current account on impact. But it can affect the current account indirectly via
exchange rates, domestic demand, and investment income payments over time.
2A — Fill-in table (CA direction)
For each activity, does it increase or decrease the current account balance (CA)?
| Activity | CA impact | Why (one line) |
|---|
Tip: CA improves with exports/receipts ↑ and imports/payments ↓. Remember primary income and transfers.
2B — Quick simulator (qualitative)
Use sliders to build a scenario. This does not compute “true” macro values; it forces correct channel logic.
Scenario controls
Ready.
What you are supposed to notice
- Tariffs can reduce imports (helps CA) but can also raise costs and provoke retaliation (hurts exports → hurts CA).
- Capital outflows (selling U.S. bonds) hit the financial account; FX/yield changes can later feed back to CA.
- USD appreciation tends to worsen CA (imports cheaper, exports harder) while USD depreciation can improve CA (with lags).