FIN301,FIN 509 & FIN510 Class Web Page, Summer'21
Weekly SCHEDULE, LINKS, FILES and Questions
|
Week |
Coverage, HW, Supplements -
Required |
Equations and
Assignments |
||||||||||||||||||||||||||||||||||||||||||||||||||||||||||||||||||||||||||||||||||||||||||||||||||||||||||||||||||||||||||||||||||||||||||||||||||||||||||||||||||||||||||||||||||||||||||||||||||||||||||||||||||||||||||||||||||||||||||||||||||||||||||||||||||||||||||||||||||||||||||||||||||||||||||||||||||||||||||||||||||||||||||||||||||||||||||||||||||||||||||||||||||||||||||||||||||||||||||||||||||||||||||||||||||||||||||||||||||||||||||||||||||||||||||||||||||||||||||||||||||||||||||||||||||||||||||||||||||||||||||||||||||||||||||||||||||||||||||||||||||||||||||||||||||||||||||||||||||||||||||||||||||||||||||||||||||||||||||||||||||||||||||||||||||||||||||||||||||||||||||||||||||||||||||||||||||||||||||||||||||||||||||||||||||||||||||||||||||||||||||||||||||||||||||||||||||||||||||||||||||||||||||||||||||||||||||||||||||||||||||||||||||||||||||||||||||||||||||||||||||||||||||||||
|
Weekly
Thursday class url: https://us.bbcollab.com/guest/e16136f1cab14057ba2f68d150977a7d Weekly
Saturday Q&A (7-8 pm) https://us.bbcollab.com/guest/02cf97530549475087efccd04a8927ce Class Schedule:
|
|
|||||||||||||||||||||||||||||||||||||||||||||||||||||||||||||||||||||||||||||||||||||||||||||||||||||||||||||||||||||||||||||||||||||||||||||||||||||||||||||||||||||||||||||||||||||||||||||||||||||||||||||||||||||||||||||||||||||||||||||||||||||||||||||||||||||||||||||||||||||||||||||||||||||||||||||||||||||||||||||||||||||||||||||||||||||||||||||||||||||||||||||||||||||||||||||||||||||||||||||||||||||||||||||||||||||||||||||||||||||||||||||||||||||||||||||||||||||||||||||||||||||||||||||||||||||||||||||||||||||||||||||||||||||||||||||||||||||||||||||||||||||||||||||||||||||||||||||||||||||||||||||||||||||||||||||||||||||||||||||||||||||||||||||||||||||||||||||||||||||||||||||||||||||||||||||||||||||||||||||||||||||||||||||||||||||||||||||||||||||||||||||||||||||||||||||||||||||||||||||||||||||||||||||||||||||||||||||||||||||||||||||||||||||||||||||||||||||||||||||||||||||||||||||||
|
Week 0 |
Market
Watch Game Use the information and directions below
to join the game. 1. URL for your game: 2. Password for this private game: havefun. 3. Click on the 'Join Now' button to get
started. 4. If you are an existing MarketWatch member, login. If you are a new user, follow the link
for a Free account - it's
easy! 5. Follow the instructions and start trading! Market Watch Tutorial-
Stock Market Competition 2018 NHSA (youtube)
|
Pre-class assignment: Set up marketwatch.com account and have
fun |
||||||||||||||||||||||||||||||||||||||||||||||||||||||||||||||||||||||||||||||||||||||||||||||||||||||||||||||||||||||||||||||||||||||||||||||||||||||||||||||||||||||||||||||||||||||||||||||||||||||||||||||||||||||||||||||||||||||||||||||||||||||||||||||||||||||||||||||||||||||||||||||||||||||||||||||||||||||||||||||||||||||||||||||||||||||||||||||||||||||||||||||||||||||||||||||||||||||||||||||||||||||||||||||||||||||||||||||||||||||||||||||||||||||||||||||||||||||||||||||||||||||||||||||||||||||||||||||||||||||||||||||||||||||||||||||||||||||||||||||||||||||||||||||||||||||||||||||||||||||||||||||||||||||||||||||||||||||||||||||||||||||||||||||||||||||||||||||||||||||||||||||||||||||||||||||||||||||||||||||||||||||||||||||||||||||||||||||||||||||||||||||||||||||||||||||||||||||||||||||||||||||||||||||||||||||||||||||||||||||||||||||||||||||||||||||||||||||||||||||||||||||||||||||
|
Week1,2 |
Chapter 5 Time value of money The time value of money -
German Nande (youtube)
Week 1 in class exercise (word file) Solution Concept of FV, PV,
Rate, Nper Calculation of FV, PV,
Rate, Nper Concept of interest
rate, compounding rate, discount rate
Chapter 6 Time Value of Money 2 Concept of PMT, NPV Calculation of FV, PV,
Rate, Nper, PMT, NPV, NFV Concept of EAR, APR Calculation of EAR,
APR HOMEWORK of Chapters 5
and 6 1. The Thailand
Co. is considering the purchase of some new equipment. The quote consists of a
quarterly payment of $4,740 for 10 years at 6.5 percent interest. What is the
purchase price of the equipment? ($138,617.88) 2. The
condominium at the beach that you want to buy costs $249,500. You plan to
make a cash down payment of 20 percent and finance the balance over 10 years
at 6.75 percent. What will be the amount of your monthly mortgage
payment? ($2,291.89) 4. Shannon wants
to have $10,000 in an investment account three years from now. The account
will pay 0.4 percent interest per month. If Shannon saves money every month,
starting one month from now, how much will she have to save each month?
($258.81)
(Hint: Bridget’s is an annuity due, so abs(fv(8%/12, 10*12, 150, 0,
1)) --- type =1; Jordan’s is an ordinary annuity, so abs(fv(8%/12, 10*12, 175,
0) --- type =0, or omitted. There is a mistake in the help video for this
question. Sorry for the mistake.) 14. What is the
future value of weekly payments of $25 for six years at 10 percent? ($10,673.90) 15. At the end of
this month, Bryan will start saving $80 a month for retirement through his
company's retirement plan. His employer will contribute an additional $.25
for every $1.00 that Bryan saves. If he is employed by this firm for 25 more
years and earns an average of 11 percent on his retirement savings, how much
will Bryan have in his retirement account 25 years from
now? ($157,613.33) 16. Sky
Investments offers an annuity due with semi-annual payments for 10 years at 7
percent interest. The annuity costs $90,000 today. What is the amount of each
annuity payment? ($6,118.35) 17. Mr. Jones
just won a lottery prize that will pay him $5,000 a year for thirty years. He
will receive the first payment today. If Mr. Jones can earn 5.5 percent on
his money, what are his winnings worth to
him today? ($76,665.51) 18. You want to
save $75 a month for the next 15 years and hope to earn an average rate of
return of 14 percent. How much more will you have at the end of the 15 years
if you invest your money at the beginning of each month rather than the end
of each month? ($530.06) 19. What is the
effective annual rate of 10.5 percent compounded
semi-annually? (10.78%) 22. What is the
effective annual rate of 12.75 percent compounded daily? (13.60 percent) 23. Your
grandparents loaned you money at 0.5 percent interest per month. The APR on
this loan is _____ percent and the EAR is _____ percent. (6.00; 6.17) FYI only: help for homework Part 1(Qs
1-2) Part 2(Qs
4-8) Part 3(Qs 9-12) Part 4(Qs
13-16) Part 5(Qs
17-20) Part 6(Qs 21-24) (Q13: Bridget’s is an annuity
due, so abs(fv(8%/12, 10*12, 150, 0, 1)) --- type
=1; Jordan’s is an ordinary annuity, so abs(fv(8%/12, 10*12, 150, 0) --- type
=0, or omitted. There is a mistake in the help video for this question. Sorry
for the mistake.) Quiz 1- Help Videos |
Calculators Time
Value of Money Calculator © 2002 - 2019 by Mark A. Lane,
Ph.D. Math Formula FV = PV *(1+r)^n PV = FV /
((1+r)^n) N = ln(FV/PV) / ln(1+r) Rate = (FV/PV)1/n -1 Annuity: N = ln(FV/C*r+1)/(ln(1+r)) Or N = ln(1/(1-(PV/C)*r)))/ (ln(1+r))
EAR = (1+APR/m)^m-1 APR = (1+EAR)^(1/m)*m Excel Formulas To get FV, use FV
function. =abs(fv(rate, nper, pmt, pv)) To get PV, use PV
function = abs(pv(rate, nper, pmt, fv)) To get r, use rate
function = rate(nper, pmt, pv, -fv) To get number of years, use nper function = nper(rate, pmt, pv, -fv) To get annuity payment, use PMT
function = abs(pmt(rate, nper, pv, -fv)) To get Effective rate (EAR), use
Effect
function = effect(nominal_rate, npery) To get annual percentage rate
(APR), use nominal function APR = nominal(effective rate, npery) |
||||||||||||||||||||||||||||||||||||||||||||||||||||||||||||||||||||||||||||||||||||||||||||||||||||||||||||||||||||||||||||||||||||||||||||||||||||||||||||||||||||||||||||||||||||||||||||||||||||||||||||||||||||||||||||||||||||||||||||||||||||||||||||||||||||||||||||||||||||||||||||||||||||||||||||||||||||||||||||||||||||||||||||||||||||||||||||||||||||||||||||||||||||||||||||||||||||||||||||||||||||||||||||||||||||||||||||||||||||||||||||||||||||||||||||||||||||||||||||||||||||||||||||||||||||||||||||||||||||||||||||||||||||||||||||||||||||||||||||||||||||||||||||||||||||||||||||||||||||||||||||||||||||||||||||||||||||||||||||||||||||||||||||||||||||||||||||||||||||||||||||||||||||||||||||||||||||||||||||||||||||||||||||||||||||||||||||||||||||||||||||||||||||||||||||||||||||||||||||||||||||||||||||||||||||||||||||||||||||||||||||||||||||||||||||||||||||||||||||||||||||||||||||||
|
Week3 |
Chapter
7 Bond Pricing Simplified Balance Sheet of WalMart
https://www.wsj.com/market-data/quotes/WMT/financials/annual/balance-sheet For discussion: · What is this “long term debt”? · Who is the lender of this “long term
debt”? So this long term debt is
called bond in the financial market. Where can you find the pricing
information and other specifications of the bond issued by WMT?
How
Bonds Work (video) Investing
Basics: Bonds(video) FINRA – Bond market information http://finra-markets.morningstar.com/BondCenter/Default.jsp WAL-MART STORES INC
http://finra-markets.morningstar.com/BondCenter/BondDetail.jsp?ticker=C104227&symbol=WMT.GP Coupon
Rate
7.550 % Maturity
Date
02/15/2030
Credit and Rating
Elements
Classification
Elements
Special
Characteristics
Issue
Elements
Bond
Elements
For class discussion: Interest rates are
low. So, shall you invest in short
term bond or long term bond? In class exercise: 1.
Find
bonds sponsored by WMT ·
just go to www.finra.org, è Investor center è market data è bond è corporate bond ·
Search for Walmart bonds For
discussion: ·
What are the ratings of the WMT bonds? How does the rating
agency rate a bond? Altman Z Score video
·
Why some WMT bonds are priced higher than the par value, while
others are priced at a discount? ·
Why some WMT bonds have higher coupon rates than other bonds?
How does WMT determine the coupon rates? ·
Why some WMT bonds have higher yields than other bonds? Does a
bond’s yield change daily? ·
Which of the WMT bonds are the most attractive one to you? Why? http://finra-markets.morningstar.com/BondCenter/BondDetail.jsp?ticker=C610043&symbol=WMT4117477 2. 2.
Understand what is coupon, coupon rate, yield, yield to maturity, market price,
par value, maturity, annual bond, semi-annual bond, current yield. 3. 3.
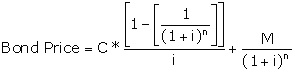
Understand how to price bond Bond
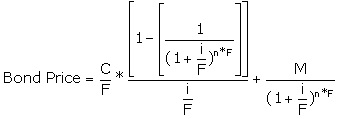
price = abs(pv(yield, maturity, coupon, 1000)) ------- annual coupon Bond
price = abs(pv(yield/2, maturity*2, coupon/2,
1000)) ------- semi-annual coupon Also change the yield and observe the
price changes. Summarize the price change pattern and draw a graph to
demonstrate your findings. Again, when yield to maturity of
this semi_annual coupon bond is
4%, how should this WMT bond sell for? 4. Understand
how to calculate bond returns Yield
to maturity = rate(maturity, coupon, -market price, 1000) ----
annual coupon Yield
to maturity = rate(maturity*2, coupon/2, -market price, 1000)*2
----- semi-annual coupon Bond
Calculator (www.jufinance.com/bond) For example, when the annual coupon bond
is selling for $1,100, what is its return to investors? For example, when the semi-annual
coupon bond is selling for $1,100, what is its return to investors? 5. Current
yield: For the above bond, calculate current yield. 6. Zero
coupon bond: coupon=0 and treat it as semi-annual coupon bond. Example:
A ten year zero coupon bond is selling for $400. How
much is its yield to maturity? A ten year zero coupon bond’s yield to
maturity is 10%. How much is its price? 7. Understand
what is bond rating and how to read those
ratings. a. Who
are Moody, S&P and Fitch? b. What
is WMT’s rating? c. Is
the rating for WMT the highest? d. Who
earned the highest rating? Supplement: Municipal Bond
For
class discussion: ·
Shall you invest in municipal bonds? ·
Are municipal bonds better than investment
grade bonds? The risks investing in a bond ·
Bond investing: credit Risk (video) ·
Bond investing: Interest rate risk (video) ·
Bond investing: increased risk
(video) Market data website: 1. FINRA http://finra-markets.morningstar.com/BondCenter/Default.jsp (FINRA bond market
data) 2. WSJ Market watch on Wall Street Journal has
daily yield curve and bond yield information. http://www.marketwatch.com/tools/pftools/ https://www.youtube.com/watch?v=yph8TRldW6k 3. Bond Online http://www.bondsonline.com/Todays_Market/ Homework 1. Firm AAA’s bonds
price = $850. Coupon rate is 5% and par is $1,000. The bond has
six years to maturity. Calculate for current yield? (5.88%) 2. For a zero
coupon bond, use the following information to calculate its yield to
maturity. (14.35%) Years
left to maturity = 10 years. Price = $250. 3. For a
zero coupon bond, use the following information to calculate its price. ($456.39)
Years left to maturity = 10 years. Yield = 8%. 4. Imagine that an annual
coupon bond’s coupon rate = 5%, 15 years left. Draw price-yield profile. (hint: Change interest rate, calculate new price and draw
the graph). 5. IBM 5 year 2% annual coupon bond is
selling for $950. How much this IBM bond’s YTM? 3.09% 6. IBM 10 year
4% semi-annual coupon bond is selling for $950. How much is
this IBM bond’s YTM? 4.63% 7. IBM 10 year 5% annual coupon
bond offers 8% of return. How much is the price of this
bond? 798.7 8. IBM 5 year 5% semi-annual coupon
bond offers 8% of return. How much is the price of this bond? $878.34 9. IBM 20 year zero
coupon bond offers 8% return. How much is the price of this bond? 208.29 10. Collingwood
Homes has a bond issue outstanding that pays an 8.5 percent coupon and
matures in 18.5 years. The bonds have a par value of $1,000 and a market
price of $964.20. Interest is paid semiannually. What is the yield to
maturity? (8.90%) 11. Grand Adventure
Properties offers a 9.5 percent coupon bond with annual payments. The yield
to maturity is 11.2 percent and the maturity date is 11 years from today.
What is the market price of this bond if the face value is $1,000? ($895.43) 12. The zero coupon
bonds of D&L Movers have a market price of $319.24, a face value of
$1,000, and a yield to maturity of 9.17 percent. How many years is it until
these bonds mature? (12.73 years) 13. A zero coupon bond
with a face value of $1,000 is issued with an initial price of $212.56. The
bond matures in 25 years. What is yield to maturity? (6.29%) 14. The bonds issued by Stainless
Tubs bear a 6 percent coupon, payable semiannually. The bonds
mature in 11 years and have a $1,000 face value. Currently, the bonds sell
for $989. What is the yield to maturity? (6.14%) Videos
--- homework help Part I Q1-Q2 Q3-Q4 Q5-Q8 Q9-Q14 Quiz
2- Help
Video |
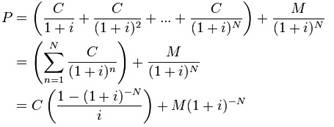
Bond Pricing Formula (FYI)
Bond Pricing Excel Formula Summary of
bond pricing excel functions To calculate bond price (annual coupon bond): Price=abs(pv(yield to maturity, years left to maturity, coupon
rate*1000, 1000) To calculate yield to maturity (annual coupon bond):: Yield
to maturity = rate(years left to maturity, coupon rate *1000, -price, 1000) To calculate bond price (semi-annual coupon bond): Price=abs(pv(yield to maturity/2, years left to maturity*2,
coupon rate*1000/2, 1000) To calculate yield to maturity (semi-annual coupon
bond): Yield
to maturity = rate(years left to maturity*2, coupon rate *1000/2,
-price, 1000)*2 To calculate number of years left(annual coupon bond) Number
of years =nper(yield to maturity, coupon
rate*1000, -price, 1000) To calculate number of years left(semi-annual coupon bond) Number
of years =nper(yield to
maturity/2, coupon rate*1000/2, -price, 1000)/2 To calculate coupon (annual coupon bond) Coupon
= pmt(yield to maturity, number of years left, -price, 1000) Coupon
rate = coupon / 1000 To calculate coupon (semi-annual coupon bond) Coupon
= pmt(yield to maturity/2, number of years left*2, -price, 1000)*2 Coupon
rate = coupon / 1000 Low interest on Walmart
bonds not worthy of investment (FYI) MONEY
& INVESTING June
28, 2018 ericBRETAN https://naples.floridaweekly.com/articles/low-interest-on-walmart-bonds-not-worthy-of-investment/ What do
you do if you need a few extra bucks and don’t have
the money? If it is a small purchase, you may put it on your credit card. If
it is something larger, you may have to go to the bank and get a loan. But
what if you are a business and need more than a few extra bucks? What if you
need $16 billion — what do you do then? Walmart recently faced this problem after its acquisition
of the Indian E-commerce company Flipkart Group.
The solution was to issue corporate bonds to the public in return for the
cash needed to fund the purchase. But just what are corporate bonds, how are
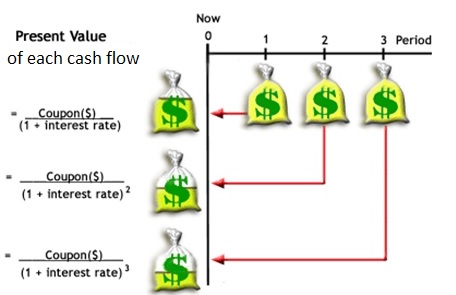
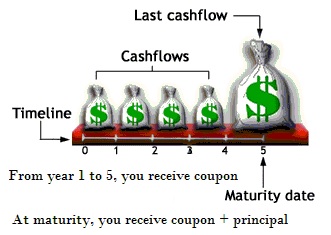
they priced and issued, and are they a good investment? A bond
is simply an investment where the investor loans money to a borrower in
exchange for a set interest rate for a given period of time. At the bond’s maturity, the investor receives the principal back as
well. For bonds issued by corporations, typically interest is paid every six
months although some bonds pay quarterly or monthly interest payments.
Corporations issue bonds that mature anywhere from less than a year (this
debt is often called commercial paper) to 30 years or more. Large companies
like Disney or Coca-Cola have even issued 100-year maturity bonds. To
issue a bond, a company typically will meet with a bank or investment bank to
structure the investment. First, the parties will determine the size of the
bond. If the company borrows too much, it may hurt its credit rating or have
trouble making the interest payments. If it borrows too little, the borrower
may not have the funds to maximize its growth or business opportunities.
Second, the company and bank will determine the appropriate maturity for the
bonds. Factors such as the use of the funds, overall interest rate
environment, and credit worthiness of the borrower all will affect this
decision. Finally,
the bank will price the bonds. Most bonds are issued at par meaning they are
issued at the face value of the bond, often $1,000. The “price” of the bond is then the interest rate that the buyer of
the bond will receive. For example, a company can issue a 10 year bond at par
that is priced at an interest rate of 6.2 percent. The interest rate of a
corporate bond is determined by two factors. The first is the overall rate
environment, typically determined by U.S. government debt rates. The second is
the credit worthiness of the issuer, which determines the additional interest
that investors demand to hold the bonds over Treasury rates. This “spread” can be very small for well
capitalized and stable companies like Microsoft or Apple or very large for risky
biotech firms. After
the interest rate of the bonds is set, the investments are sold to the public
at the face value of the bonds. Going forward, however, the bonds will trade
on the open market and will either trade at a premium or discount to the face
value. If overall interest rates go up or the credit worthiness of the
company declines, the bond’s value will decline as
investors sell the bonds to buy more stable bonds or bonds with higher
interest rates. Conversely, if interest rates decline or the company credit
strengthens, the bonds’ value will rise as investors
buy the bond. In the
case of Walmart, several maturities of bonds were
offered to investors to fund the staggering $16 billion needed to fund its
acquisition. The longest dated bonds, 30 years to maturity, were priced at
just 1.05 percent over the 30 year Treasury rate or around 4.1 percent. This
very low rate speaks very highly of the credit worthiness of Walmart. However, one of the main bond credit ratings
companies, S&P, stated that the company’s strong
AA credit rating may be placed under review because of the significant
acquisitions the company has recently made and the resulting debt issued to
pay for them. Therefore, I would be hesitant to tie up my money for 30 years
at such a low interest rate and feel that there are plenty of better
investments to earn a better risk adjusted return. ¦ — Eric Bretan, the co- owner of Rick’s
Estate & Jewelry Buyers in Punta Gorda, was a
senior derivatives marketer and investment banker for more than 15 years at
several global banks. |
||||||||||||||||||||||||||||||||||||||||||||||||||||||||||||||||||||||||||||||||||||||||||||||||||||||||||||||||||||||||||||||||||||||||||||||||||||||||||||||||||||||||||||||||||||||||||||||||||||||||||||||||||||||||||||||||||||||||||||||||||||||||||||||||||||||||||||||||||||||||||||||||||||||||||||||||||||||||||||||||||||||||||||||||||||||||||||||||||||||||||||||||||||||||||||||||||||||||||||||||||||||||||||||||||||||||||||||||||||||||||||||||||||||||||||||||||||||||||||||||||||||||||||||||||||||||||||||||||||||||||||||||||||||||||||||||||||||||||||||||||||||||||||||||||||||||||||||||||||||||||||||||||||||||||||||||||||||||||||||||||||||||||||||||||||||||||||||||||||||||||||||||||||||||||||||||||||||||||||||||||||||||||||||||||||||||||||||||||||||||||||||||||||||||||||||||||||||||||||||||||||||||||||||||||||||||||||||||||||||||||||||||||||||||||||||||||||||||||||||||||||||||||||||
|
Week 4 |
Chapter
8 Stock Valuation Part I Dividend payout and Stock Valuation For
class discussion: · Why
can we use dividend to estimate a firm’s intrinsic value? · Are future dividends predictable? Ford’s dividends: https://www.nasdaq.com/market-activity/stocks/f/dividend-history
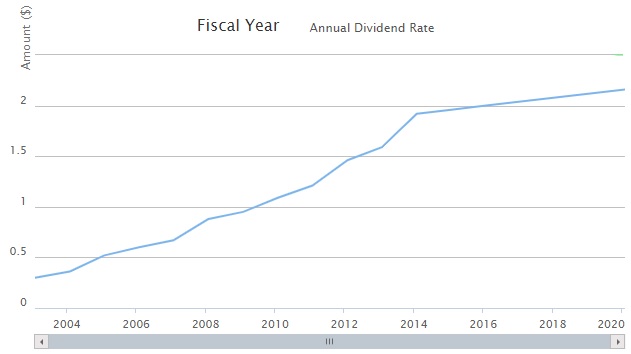
· Refer to the following table for Wal-mart (WMT’s dividend history) http://stock.walmart.com/investors/stock-information/dividend-history/default.aspx
Stock Splits
Wal-Mart Stores, Inc. was incorporated on Oct. 31, 1969. On
Oct. 1, 1970, Walmart offered 300,000 shares of its
common stock to the public at a price of $16.50 per share. Since that time,
we have had 11 two-for-one (2:1) stock splits. On a purchase of 100 shares at
$16.50 per share on our first offering, the number of shares has grown as
follows:
Can you
estimate the expected dividend in 2022? And in 2023? And on and on…
Can you write down the
math equation now? WMT stock price = ? Can you calculate now? It
is hard right because we assume dividend payment goes to infinity. How can we
simplify the calculation? We can assume that
dividend grows at certain rate, just as the table on the right shows. Discount rate is r (based
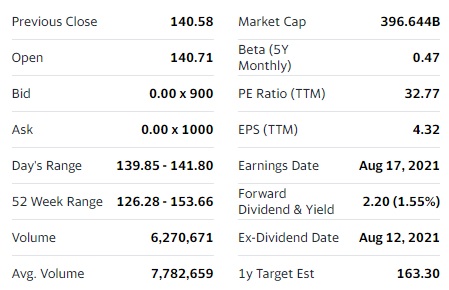
on Beta and CAPM that we will learn in chapter 13) From finance.yahoo.com
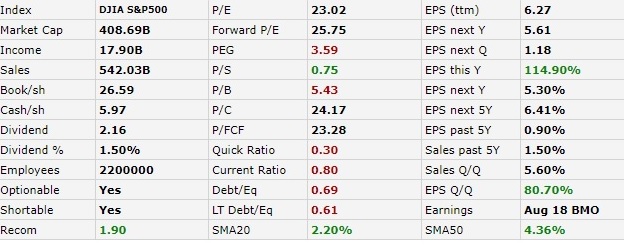
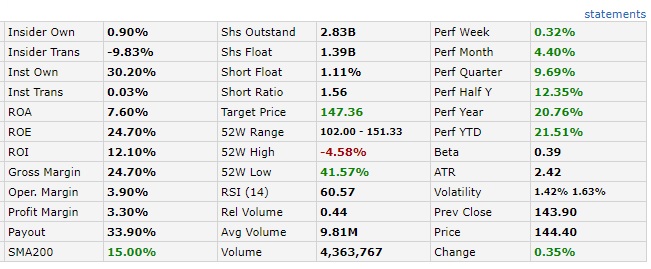
What does each item indicate? From finviz.com https://finviz.com/quote.ashx?t=WMT
Part II: Constant
Dividend Growth-Dividend growth model Calculate stock prices 1) Given next dividends and price Po= Po= Po= Po= ……
Refer to http://www.calculatinginvestor.com/2011/05/18/gordon-growth-model/ · Now let’s apply this
Dividend growth model in problem solving. Constant dividend growth
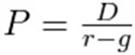
model calculator (www.jufinance.com/stock) Equations ·
Po= D1/(r-g) or Po= Do*(1+g)/(r-g) ·
r = D1/Po+g = Do*(1+g)/Po+g ·
g= r-D1/Po = r- Do*(1+g)/Po ·
·
Capital Gain yield = g ·
·
Dividend Yield = r – g = D1 / Po = Do*(1+g) / Po ·
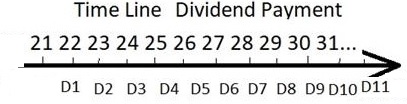
D1=Do*(1+g); D2= D1*(1+g);
D3=D2*(1+g)… Exercise: 1.
Consider the
valuation of a common stock that paid $1.00 dividend at the end of the last
year and is expected to pay a cash dividend in the future. Dividends are
expected to grow at 10% and the investors required rate of return is 17%. How
much is the price? How much is the dividend yield? Capital gain yield? 2.
The current market
price of stock is $90 and the stock pays dividend of $3 with a growth rate of
5%. What is the return of this stock? How much is the dividend yield? Capital
gain yield? Part III:
Non-Constant Dividend Growth Calculate stock prices 1) Given next dividends and price Po= Po= Po= Po= …… Non-constant dividend growth model calculator (https://www.jufinance.com/dcf/) Equations Pn = Dn+1/(r-g) = Dn*(1+g)/(r-g), since
year n, dividends start to grow at a constant rate. Where Dn+1= next dividend in year n+1; Do = just paid dividend in year n; r=stock return; g= dividend growth rate; Pn= current market price in year n; Po = npv(r, D1, D2,
…, Dn+Pn) Or, Po = D1/(1+r) + D2/(1+r)2 + … +
(Dn+Pn)/(1+r)n In class exercise for non-constant dividend growth model
(similar to quiz questions) 1. You
expect AAA Corporation to generate the following free cash flows over the
next five years:
Since
year 6, you estimate that AAA's free cash flows will grow at 6% per year.
WACC of AAA = 15% ·
Calculate the enterprise
value for DM Corporation. ·
Assume that AAA has $500 million
debt and 14 million shares outstanding, calculate its stock price. Answer:
2. AAA pays no dividend currently. However,
you expect it pay an annual dividend of $0.56/share 2 years from now with a
growth rate of 4% per year thereafter. Its equity cost = 12%, then its stock
price=? Answer: Do=0 D1=0 D2=0.56 g=4% after year 2 è P2 = D3/(r-g), D3=D2*(1+4%) è P2 = 0.56*(1+4%)/(12%-4%) = 7.28 r=12% Po=? Po = NPV(12%, D1, D2+P2), D2 = 0.56,
P2=7.28. SO Po = NPV(12%, 0,0.56+7.28) = 6.25 (Note: for non-constant growth model,
calculate price when dividends start to grow at the constant rate. Then use
NPV function using dividends in previous years, last dividend plus price. Or
use calculator at https://www.jufinance.com/dcf/
) 3.
Required return =12%. Do = $1.00, and
the dividend will grow by 30% per year for the next 4 years. After t = 4, the dividend is expected to
grow at a constant rate of 6.34% per year forever. What is the stock price ($40)? (similar to quiz question) Answer: Do=1 D1 = 1*(1+30%) = 1.3 D2= 1.3*(1+30%) = 1.69 D3 = 1.69*(1+30%) = 2.197 D4 = 2.197*(1+30%) = 2.8561 D5 = 2.8561*(1+6.34%), g=6.34% P4 = D5/(r-g) = 2.8561*(1+6.34%) /(12%
- 6.34%) Po = NPV(12%, 1.3, 1.69,
2.197, 2.8661+2.8561*(1+6.34%) /(12% - 6.34%)) = 40 Or use calculator at https://www.jufinance.com/dcf/
Part IV: How to
pick stocks? (FYI) How to
pick stocks – Does it work? PE ratio Stock screening tools ·
Reuters stock screener to help select stocks http://stockscreener.us.reuters.com/Stock/US/ ·
FINVIZ.com http://finviz.com/screener.ashx use screener on finviz.com to narrow down your choices of
stocks, such as PE<15, PEG<1, ROE>30% ·
WSJ stock screen http://online.wsj.com/public/quotes/stock_screener.html ·
Simply the Web's Best Financial Charts You can find analyst rating from MSN money For instance, ANALYSTS RATINGS Zacks average brokerage recommendation is Moderate Buy
Summary of stock
screening rules from class discussion PEG<1 PE<15 (? FB’s PE>100?) Growth
rate<20 ROE>10% Analyst
ranking: strong buy only Zacks average =1 (from Ranking stocks using PEG
ratio) current
price>5 How to pick stocks Capital Asset Pricing Model (CAPM)Explained https://www.youtube.com/watch?v=JApBhv3VLTo Ranking stocks using PEG ratio https://www.youtube.com/watch?v=bekW_hTehNU HOMEWORK 1.
Northern Gas
recently paid a $2.80 annual dividend on its common stock. This dividend
increases at an average rate of 3.8 percent per year. The stock is currently
selling for $26.91 a share. What is the market rate of return? (14.60
percent) 2. Douglass Gardens pays an annual dividend that is expected
to increase by 4.1 percent per year. The stock commands a market rate of return
of 12.6 percent and sells for $24.90 a share. What is the expected amount of
the next dividend? ($2.12) 3. IBM just paid $3.00 dividend per share to investors. The
dividend growth rate is 10%. What is the expected dividend of the next year? ($3.3) 4. The current market price of stock is $50 and the stock is
expected to pay dividend of $2 with a growth rate of 6%. How much is the
expected return to stockholders? (10%) 5.
Investors of Creamy Custard common stock earns 15% of return. It just paid a dividend of
$6.00 and dividends are expected to grow at a rate of 6% indefinitely. What
is expected price of Creamy Custard's stock? ($70.67) Homework
Video of this week Quiz 3- Help Video (have non-constant growth dividend
questions) Part I Part II Part
III Part IV
|
P/E Ratio Summary by
industry (FYI) --- Thanks to Dr Damodaran Data Used: Multiple data services Date of Analysis: Data used is as of January 2021 Download as an excel file instead: http://www.stern.nyu.edu/~adamodar/pc/datasets/pedata.xls For global datasets: http://www.stern.nyu.edu/~adamodar/New_Home_Page/data.html
Details
about how to derive the model mathematically (FYI) The Gordon growth model is a simple discounted cash flow
(DCF) model which can be used to value a stock, mutual fund, or even the
entire stock market. The model is named after Myron Gordon who first
published the model in 1959. The Gordon model assumes that a financial security
pays a periodic dividend (D) which grows at a constant rate
(g). These growing dividend payments are assumed to continue forever.
The future dividend payments are discounted at the required rate of return
(r) to find the price (P) for the stock or fund. Under these simple assumptions, the price of the
security is given by this equation:
In this equation, I’ve used the “0” subscript
on the price (P) and the “1” subscript on the dividend (D) to
indicate that the price is calculated at time zero and the dividend is the
expected dividend at the end of period one. However, the equation is
commonly written with these subscripts omitted. Obviously, the assumptions built into this
model are overly simplistic for many real-world valuation problems. Many
companies pay no dividends, and, for those that do,
we may expect changing payout ratios or growth rates as the
business matures. Despite
these limitations, I believe spending some time experimenting with the
Gordon model can help develop intuition about the relationship between
valuation and return. Deriving the Gordon Growth Model Equation
The Gordon growth model calculates the present value of
the security by summing an infinite series of discounted dividend payments
which follows the pattern shown here:
Multiplying both sides of the previous equation by
(1+g)/(1+r) gives:
We can then subtract the second equation from the first
equation to get:
Rearranging and simplifying:
Finally,
we can simplify further to get the Gordon growth model equatio |
||||||||||||||||||||||||||||||||||||||||||||||||||||||||||||||||||||||||||||||||||||||||||||||||||||||||||||||||||||||||||||||||||||||||||||||||||||||||||||||||||||||||||||||||||||||||||||||||||||||||||||||||||||||||||||||||||||||||||||||||||||||||||||||||||||||||||||||||||||||||||||||||||||||||||||||||||||||||||||||||||||||||||||||||||||||||||||||||||||||||||||||||||||||||||||||||||||||||||||||||||||||||||||||||||||||||||||||||||||||||||||||||||||||||||||||||||||||||||||||||||||||||||||||||||||||||||||||||||||||||||||||||||||||||||||||||||||||||||||||||||||||||||||||||||||||||||||||||||||||||||||||||||||||||||||||||||||||||||||||||||||||||||||||||||||||||||||||||||||||||||||||||||||||||||||||||||||||||||||||||||||||||||||||||||||||||||||||||||||||||||||||||||||||||||||||||||||||||||||||||||||||||||||||||||||||||||||||||||||||||||||||||||||||||||||||||||||||||||||||||||||||||||||||
|
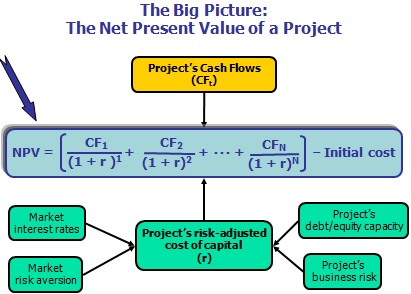
Chapter 9 Capital
Budgeting
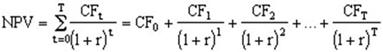
1. NPV Excel syntax Syntax NPV(rate,value1,value2, ...) Rate is the rate of discount over
the length of one period. Value1, value2, ...
are 1 to 29 arguments representing the payments and income. · Value1, value2, ... must
be equally spaced in time and occur at the end of
each period. NPV uses the order of value1, value2, ... to interpret the order of cash flows. Be
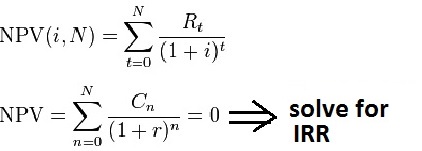
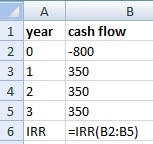
sure to enter your payment and income values in the correct sequence. 2. IRR Excel syntax Syntax IRR(values, guess) Values is an array or a reference to cells that contain
numbers for which you want to calculate the internal rate of return. Guess is a number that you guess is
close to the result of IRR.
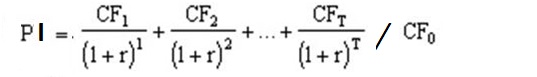
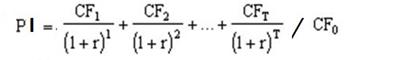
Or, PI =
NPV / CFo +1 Profitable
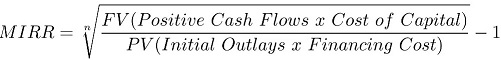
index (PI) =1 + NPV / absolute value of CFo 3. MIRR( values, finance_rate, reinvest_rate ) Where
the function arguments are as follows:
Modified Rate of Return:
Definition & Example (video)
https://study.com/academy/lesson/modified-rate-of-return-definition-example.html NPV, IRR, Payback Period calculator I NPV, IRR,
Payback Period calculator II
Excel Template - NPV, IRR, MIRR, PI, Payback, Discounted
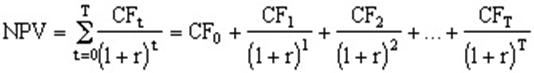
payback In class exercise Part I: Single project 1.
How much is MIRR? IRR? Payback period?
Discounted payback period? NPV? WACC: 11.00% Year 0 1 2 3 Cash
flows -$800 $350 $350 $350 Answer: 1)
NPV: NPV = -800 + 350/(1+11%) +
350/(1+11%)2 + 350/(1+11%)3 = 55.30 Or in excel: = npv(11%, 350,
350, 350)-800 = 55.30 2)
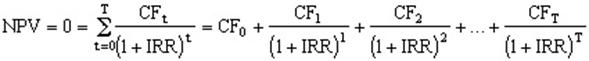
IRR:
So NPV = 0 = -800 +
350/(1+IRR) + 350/(1+IRR)2 + 350/(1+IRR)3 , use Solver,
can get IRR = 14.93% Or in excel:
3)
PI: profitable index
SO, PI= (350/(1+11%) + 350/(1+11%)2 + 350/(1+11%)3
) / 800 = 1.069 Or PI = NPV/800 + 1 = 55.30/800 + 1 = 1.069 4)
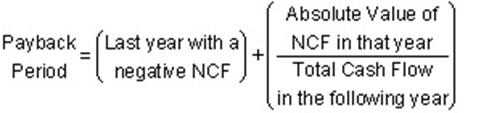
Payback period:
A portion of the third year = (800-350-350)/350 = 100/350 =
0.2857 So it takes 2 + 0.2857 = 2.2857 years to pay off the debt of
$800. 5)
Discounted payback period:
Note: All the cash flows in the above equation should be the
present values.
A portion of the third year = (800-315.32-284.07)/255.92 =
0.78 So it takes 2 + 0.78 = 2.78 years to pay off the debt of $800.
Or use the calculator at https://www.jufinance.com/capital/ Part
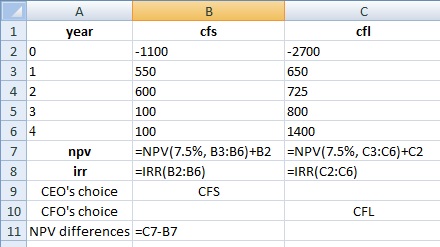
II: Multi-Projects 1.
Projects S and L, whose cash flows are
shown below. These projects are
mutually exclusive, equally risky, and not repeatable. The CEO believes the IRR is the best
selection criterion, while the CFO advocates the NPV. If the decision is made by choosing the
project with the higher IRR rather than the one with the higher NPV, how
much, if any, value will be forgone, i.e., what's the chosen NPV versus the
maximum possible NPV? Note that (1) “true value” is measured by NPV,
and (2) under some conditions the choice of IRR vs. NPV will have no effect
on the value gained or lost. WACC: 7.50% Year 0 1 2 3 4 CFS -$1,100 $550 $600 $100 $100 CFL -$2,700 $650 $725 $800 $1,400 Answer:
If the required rate of return is 10%. Which
project shall you choose? 1) How
much is the cross over rate? (answer:
11.8%) 2) How
is your decision if the required rate of return is 13%? (answer: NPV of
B>NPV of A) · Rule for mutually exclusive projects: (answer:
Choose B) · What about the two projects are
independent? (answer: Choose both)
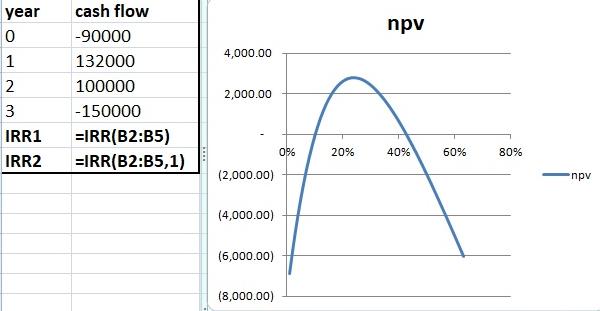
Part III More on IRR – (non-conventional cash flow) Suppose an investment will cost
$90,000 initially and will generate the following cash flows: – Year 1: 132,000 – Year 2: 100,000 – Year 3: -150,000 The required return is 15%.
Should we accept or reject the project? 1) How does the
NPV profile look like? (Answer: Inverted NPV profile) 2) IRR1= 10.11% --
answer 3) IRR2= 42.66% --
answer Answer:
HOMEWORK Year Cash flows 1 $8,000 2 4,000 3 3,000 4 5,000 5 10,000 1) How
much is the payback period (approach one)? ----
4 years 2) If
the firm has a 10% required rate of return. How much is NPV (approach
2)?-- $2456.74 3) If
the firm has a 10% required rate of return. How much is IRR (approach
3)? ---- 14.55% 4) If
the firm has a 10% required rate of return. How much is PI (approach
4)? ---- 1.12 Question 2: Project with an initial cash outlay of $60,000 with
following free cash flows for 5 years. Year FCF Initial
outlay –60,000 1 25,000 2 24,000 3 13,000 4 12,000 5 11,000 The firm has a 15% required rate of return. Calculate payback period, NPV, IRR and PI.
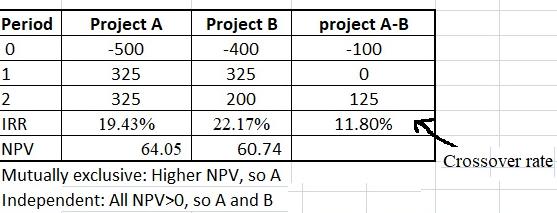
Analyze your results. Question 3: Mutually Exclusive
Projects 1) Consider
the following cash flows for one-year Project A and B, with required rates of
return of 10%. You have limited capital and can invest in one but one
project. Which one? § Initial
Outlay: A = -$200; B = -$1,500 § Inflow: A
= $300; B = $1,900 2) Example:
Consider two projects, A and B, with initial outlay of $1,000, cost of
capital of 10%, and following cash flows in years 1, 2, and 3: A:
$100 $200 $2,000 B:
$650 $650 $650 Which
project should you choose if they are mutually exclusive? Independent?
Crossover rate? (mutually
exclusive: A’s NPV=758.83 > B’s NPV = 616.45, so choose A; Independent,
choose all positive NPV, so choose both; Crossover
rate = 21.01%. The calculator does not work. Use IRR in Excel) Quiz 4- chapter 9 – (no
video prepared; Could use the calculator) Homework help videos (chapter 9) |
Simple
Rules’ for Running a Business
From the 20-page cellphone contract
to the five-pound employee handbook, even the simple things seem to be getting
more complicated. Companies have been complicating things for themselves, too—analyzing hundreds of factors when making decisions, or
consulting reams of data to resolve every budget dilemma. But those
requirements might be wasting time and muddling priorities. So argues Donald Sull, a lecturer at the Sloan School of Management at the
Massachusetts Institute of Technology who has also worked for McKinsey &
Co. and Clayton, Dubilier &
Rice LLC. In the book Simple Rules: How to Thrive in a Complex World,
out this week from Houghton
Mifflin Harcourt HMHC -1.36%,
he and Kathleen Eisenhardt of
Stanford University claim that straightforward guidelines lead to better
results than complex formulas. Mr. Sull recently
spoke with At Work about what companies can do to simplify, and why five
basic rules can beat a 50-item checklist. Edited excerpts: WSJ: Where, in the business
context, might “simple rules” help more than a complicated
approach? Donald Sull: Well, a common
decision that people face in organizations is capital allocation. In many organizations,
there will be thick procedure books or algorithms–one
company I worked with had an algorithm that had almost 100 variables for
every project. These are very cumbersome approaches to making decisions and
can waste time. Basically, any decision about how to focus resources—either people or money or attention—can
benefit from simple rules. WSJ: Can you give an example of
how that simplification works in a company? Sull: There’s a German company called Weima GmBH that makes shredders. At one point,
they were getting about 10,000 requests and could only fill about a thousand
because of technical capabilities, so they had this massive problem of
sorting out which of these proposals to pursue. They had a very detailed checklist with 40 or 50 items. People
had to gather data and if there were gray areas the proposal would go to
management. But because the data was hard to obtain and there were so many
different pieces, people didn’t always fill out the
checklists completely. Then management had to discuss a lot of these
proposals personally because there was incomplete data. So top management is
spending a disproportionate amount of time discussing this low-level stuff. Then Weima came
up with guidelines that the frontline sales force and engineers could use to
quickly decide whether a request fell in the “yes,” “no” or “maybe” category. They did it with five
rules only, stuff like “Weima had to collect at least 70% of the
price before the unit leaves the factory.” After that, only the “maybes” were sent to management. This
dramatically decreased the amount of time management spend evaluating these
projects–that time was decreased by almost a factor
of 10. Or, take Frontier Dental Laboratories in Canada. They were
working with a sales force of two covering the entire North American market.
Limiting their sales guidelines to a few factors that made someone likely to
be receptive to Frontier—stuff like “dentists
who have their own practice” and “dentists
with a website”—helped focus their efforts and
increase sales 42% in a declining market. WSJ: Weima used five factors—is
that the optimal number? And how do you choose which rules to follow? Sull: You should have four to six rules. Any more than that, you’ll spend too much time trying to follow
everything perfectly. The entire reason simple rules help is because they
force you to prioritize the goals that matter. They’re
easy to remember, they don’t confuse or stress you,
they save time. They should be tailored to your specific goals, so you choose the
rules based on what exactly you’re trying to achieve.
And you should of course talk to others. Get information from different
sources, and ask them for the top things that worked for them. But focus on
whether what will work for you and your circumstances. WSJ: Is there a business leader
you can point to who has embraced the “simple rules” guideline? Donald Sull: Let’s look at when Alex Behring took over America
Latina Logistica SARUMO3.BR +1.59%,
the Brazilian railway and logistics company. With a budget of $15 million,
how do you choose among $200 million of investment requests, all of which are
valid? The textbook business-school answer to this is that you run the
NPV (net present value) test on each project and rank-order them by NPV. Alex
Behring knows this. He was at the top of the class at Harvard Business School. But instead Similarly, the global-health arm of the Gates Foundation gets
many, many funding requests. But since they know that their goal is to have
the most impact worldwide, they focus on projects in developing countries
because that’s where the money will stretch farther. |
|||||||||||||||||||||||||||||||||||||||||||||||||||||||||||||||||||||||||||||||||||||||||||||||||||||||||||||||||||||||||||||||||||||||||||||||||||||||||||||||||||||||||||||||||||||||||||||||||||||||||||||||||||||||||||||||||||||||||||||||||||||||||||||||||||||||||||||||||||||||||||||||||||||||||||||||||||||||||||||||||||||||||||||||||||||||||||||||||||||||||||||||||||||||||||||||||||||||||||||||||||||||||||||||||||||||||||||||||||||||||||||||||||||||||||||||||||||||||||||||||||||||||||||||||||||||||||||||||||||||||||||||||||||||||||||||||||||||||||||||||||||||||||||||||||||||||||||||||||||||||||||||||||||||||||||||||||||||||||||||||||||||||||||||||||||||||||||||||||||||||||||||||||||||||||||||||||||||||||||||||||||||||||||||||||||||||||||||||||||||||||||||||||||||||||||||||||||||||||||||||||||||||||||||||||||||||||||||||||||||||||||||||||||||||||||||||||||||||||||||||||||||||||||||
|
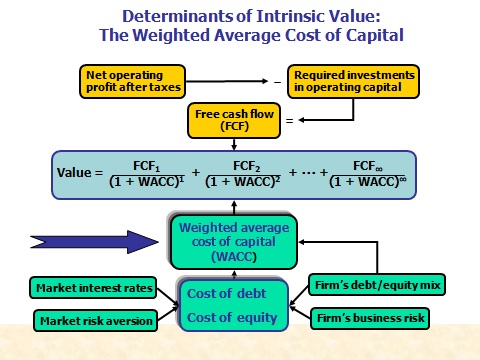
Chapter 14 Cost of Capital (optional,
not required)
For class discussion: · What is WACC? · Why is it important? · WACC increases, good or bad to stock holders? · How to apply WACC to figure out firm value?
One option (if beta is given, refer to chapter 13)
Another option (if dividend is given):
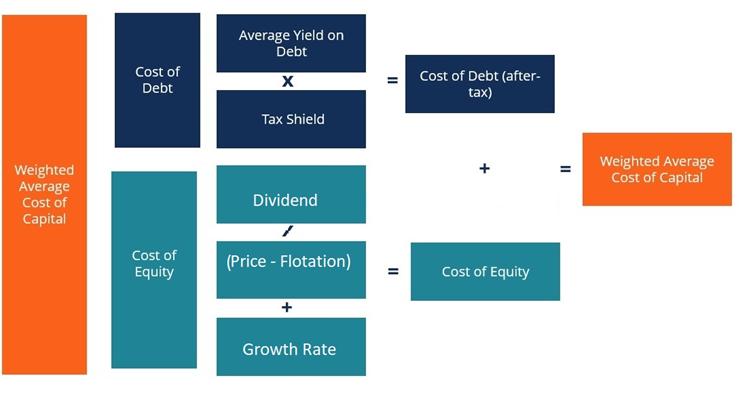
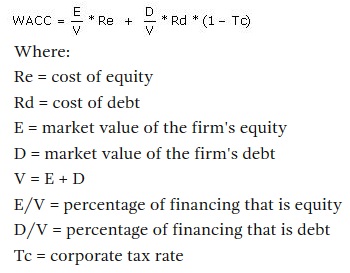
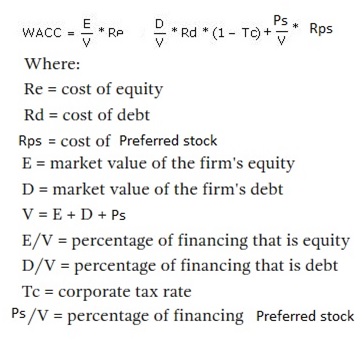
WACC Formula
WACC calculator (annual
coupon bond) (www.jufinance.com/wacc)
WACC calculator (semi-annual coupon bond) (www.jufinance.com/wacc_1)
WACC Calculator help
videos FYI
Summary of Equations
Discount rate to figure out the value of projects is called WACC (weighted average cost of capital)
WACC = weight of debt * cost of debt + weight of equity *( cost of equity)
Wd= total debt / Total capital = total borrowed / total capital We= total equity/ Total capital Cost of debt = rate(nper, coupon, -(price – flotation costs), 1000)*(1-tax
rate) Cost of Equity = D1/(Po – Flotation Cost) + g D1: Next period dividend; Po: Current stock price; g: dividend growth rate Note: flotation costs = flotation percentage * price
Or if beta is given, use CAPM model (refer to chapter 13) Cost of equity = risk free
rate + beta *(market return – risk free rate) Cost of equity = risk free rate +
beta * market risk premium
In Class Exercise: A firm borrows money from bond market. The price they paid is $950 for the bond with 5% coupon rate and 10 years to mature. Flotation cost is $40. For the new stocks, the expected dividend is $2 with a growth rate of 10% and price of $40. The flotation cost is $4. The company raises capital in equal proportions i.e. 50% debt and 50% equity (such as total $1m raised and half million is from debt market and the other half million is from stock market). Tax rate 34%. What is WACC (weighted average cost of capital, cost of capital)? (Answer: 9.84%) 1) Why does the firm raise capital from the financial market? Is there of any costs of doing so? What do you think? 2) What is cost of debt? (Kd = rate(nper, coupon, -(price – flotation costs $)), 1000)*(1-tax rate)) 3) Cost of equity? (Ke = (D1/(Price – flotation costs $)) +g, or Ke = Rrf + Beta*MRP)) Why no tax adjustment like cost of debt? 4) WACC=Cost of capital = Percentage of Debt * cost of debt + percentage of stock * cost of stock = Wd*Kd + We* Ke Meaning: For a dollar raised in the capital market from debt holders and stockholders, the cost is WACC (or WACC * 1$ = several cents, and of course, the lower the better but many companies do not have good credits)
No
homework for chapter 14
|
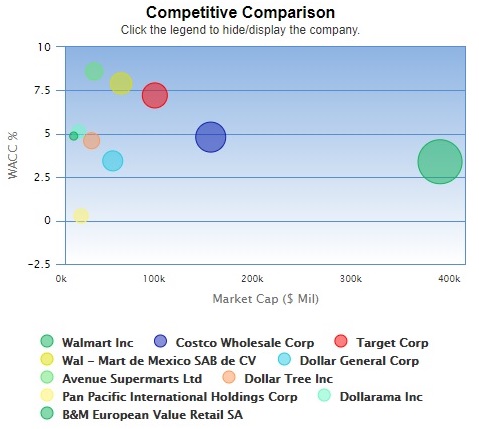
Walmart Inc (NYSE:WMT) WACC %:3.20%
(7/27/2021) As of today, Walmart Inc's
weighted average cost of capital is 3.20%. Walmart
Inc's ROIC % is 8.81% (calculated
using TTM income statement data). Walmart Inc
generates higher returns on investment than it costs the company to raise the
capital needed for that investment. It is earning excess returns. A firm that
expects to continue generating positive excess returns on new investments in
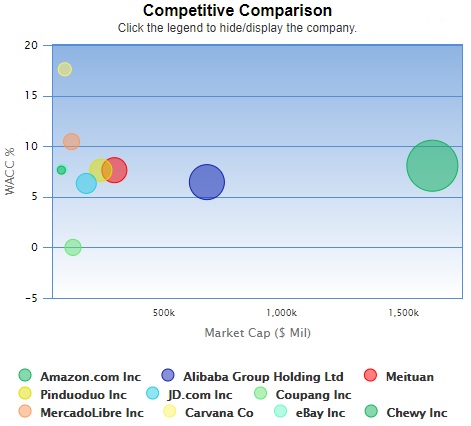
the future will see its value increase as growth increases. https://www.gurufocus.com/term/wacc/WMT/WACC/Walmart%2BInc Amazon.com
Inc (NAS:AMZN) WACC %:7.80% (7/27/2021) As of today, Amazon.com Inc's weighted average
cost of capital is 7.80%. Amazon.com Inc's ROIC % is 13.47% (calculated
using TTM income statement data). Amazon.com Inc generates higher returns on
investment than it costs the company to raise the capital needed for that
investment. It is earning excess returns. A firm that expects to continue
generating positive excess returns on new investments in the future will see
its value increase as growth increases. https://www.gurufocus.com/term/wacc/AMZN/WACC-Percentage/Amazon.com%20Inc
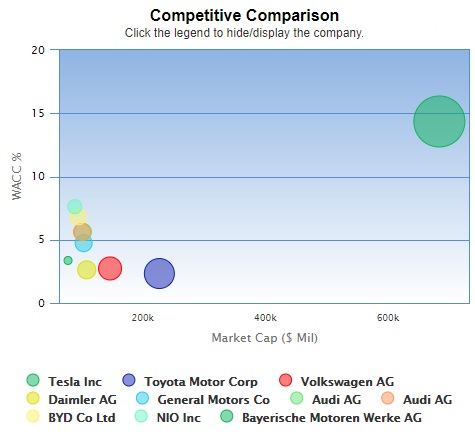
Tesla (NAS:TSLA) WACC
%:13.2% (7/27/2021) As of today, Tesla’s weighted average cost of
capital is 13.2%. Apple Inc's ROIC % is 5.66% (calculated
using TTM income statement data). https://www.gurufocus.com/term/wacc/NAS:TSLA/WACC-/Tesla
Cost of Capital by Sector (US) Date of Analysis: Data used is as of January 2021
http://people.stern.nyu.edu/adamodar/New_Home_Page/datafile/wacc.htm |
|||||||||||||||||||||||||||||||||||||||||||||||||||||||||||||||||||||||||||||||||||||||||||||||||||||||||||||||||||||||||||||||||||||||||||||||||||||||||||||||||||||||||||||||||||||||||||||||||||||||||||||||||||||||||||||||||||||||||||||||||||||||||||||||||||||||||||||||||||||||||||||||||||||||||||||||||||||||||||||||||||||||||||||||||||||||||||||||||||||||||||||||||||||||||||||||||||||||||||||||||||||||||||||||||||||||||||||||||||||||||||||||||||||||||||||||||||||||||||||||||||||||||||||||||||||||||||||||||||||||||||||||||||||||||||||||||||||||||||||||||||||||||||||||||||||||||||||||||||||||||||||||||||||||||||||||||||||||||||||||||||||||||||||||||||||||||||||||||||||||||||||||||||||||||||||||||||||||||||||||||||||||||||||||||||||||||||||||||||||||||||||||||||||||||||||||||||||||||||||||||||||||||||||||||||||||||||||||||||||||||||||||||||||||||||||||||||||||||||||||||||||||||||||||
|
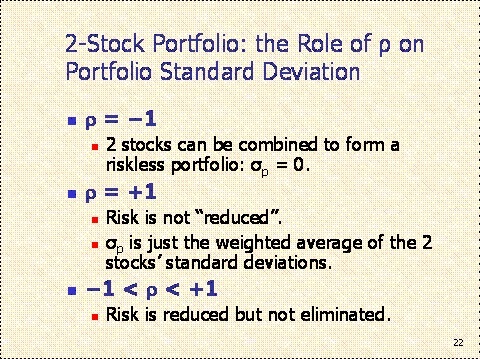
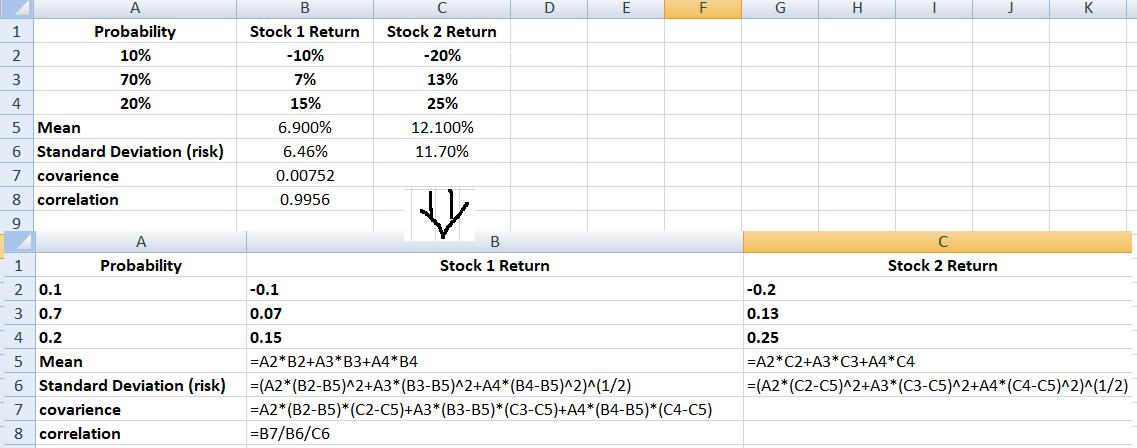
Chapter 13 Risk and Return In class
exercise Risk and Return Equations (FYI): 1. Expected return and
standard deviation Given a probability distribution of
returns, the expected return can be calculated using the following equation:
where
https://www.zenwealth.com/businessfinanceonline/RR/ExpectedReturn.html Given an asset's expected return,
its variance can be calculated using the following equation:
where
The standard deviation is
calculated as the positive square root of the variance.
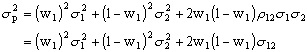
https://www.zenwealth.com/businessfinanceonline/RR/MeasuresOfRisk.html 2. Two stock portfolio
equations:
W1 and W2 are the percentage of each stock in the
portfolio.
In class
exercise and solution
3.. Historical returns Holding period return (HPR) =
(Selling price – Purchasing price + dividend)/ Purchasing price 4. CAPM (Capital Asset
Pricing Model) model · What is Beta? Where to find Beta?
Beta
is a measurement of a stock's price fluctuations, which is often called
volatility, and is used by investors to gauge how quickly a stock's price
will rise or fall. Because beta is calculated from past returns, it's not
considered as reliable a tool to forecast rises in stock prices, and it is
more commonly used by options traders. Beta compares the changes in a
company's stock returns against the returns of the market as a whole. Online
brokerages give investors extensive data on a stock's beta value, and some
free financial news websites also show current beta measurements. · What
Is the Capital Asset Pricing Model?
The Capital Asset Pricing Model (CAPM)
describes the relationship between systematic risk and expected
return for assets, particularly stocks. CAPM is widely used throughout
finance for pricing risky securities and generating expected
returns for assets given the risk of those assets and cost of capital. Ri = Rf + βi
*( Rm -
Rf)
------ CAPM model Ri = Expected return of investment Rf = Risk-free rate βi = Beta of the investment Rm = Expected return of market (Rm -
Rf) =
Market risk premium Investors expect to be compensated for risk and the time
value of money. The risk-free rate in the CAPM formula accounts for
the time value of money. The other components of the CAPM formula account for
the investor taking on additional risk. The beta of a potential investment is a
measure of how much risk the investment will add to a portfolio that looks
like the market. If a stock is riskier than the market, it will have a beta
greater than one. If a stock has a beta of less than one, the formula assumes
it will reduce the risk of a portfolio. A stock’s beta is then multiplied by
the market risk premium, which is the return expected from the market
above the risk-free rate. The risk-free rate is then added to the product of
the stock’s beta and the market risk premium.
The result should give an investor the required
return or discount rate they can use to find the value of an
asset. The goal of the CAPM formula is to evaluate whether a stock is
fairly valued when its risk and the time value of money are compared to its
expected return. For example, imagine an investor is
contemplating a stock worth $100 per share today that pays a 3% annual
dividend. The stock has a beta compared to the market of 1.3, which means it
is riskier than a market portfolio. Also, assume that the risk-free rate is
3% and this investor expects the market to rise in value by 8% per year. The expected return of the stock based on the CAPM formula is
9.5%. The expected return of the CAPM formula is used to discount
the expected dividends and capital appreciation of the stock over the
expected holding period. If the discounted value of those future cash flows
is equal to $100 then the CAPM formula indicates the stock is fairly valued
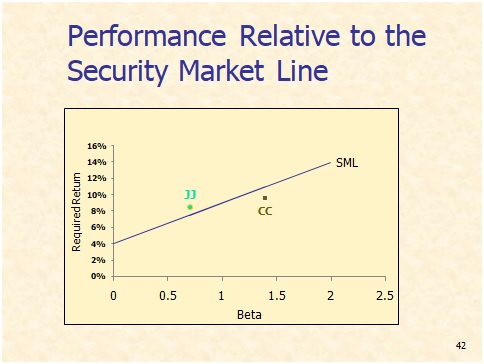
relative to risk. (https://www.investopedia.com/terms/c/capm.asp) · SML – Security Market Line
HOMEWORK 1. AAA
firm’s stock has a 0.25 possibility to make 30.00% return, a 0.50 chance to
make 12% return, and a 0.25 possibility to make -18%
return. Calculate expected rate of return (Answer: 9%) 2. If
investors anticipate a 7.0% risk-free rate, the market risk premium = 5.0%,
beta = 1, Find the return. (answer:12%) 3. AAA
firm has a portfolio with a value of $200,000 with the following four stocks.
Calculate the beta of this portfolio ( answer: 0.988) Stock value β A $
50,000.00 0.9500 B 50,000.00 0.8000 C 50,000.00 1.0000 D 50,000.00 1.2000 Total $200,000.00 4. A
portfolio with a value of $40,000,000 has a beta = 1. Risk free rate = 4.25%,
market risk premium = 6.00%. An additional $60,000,000 will be included in
the portfolio. After that, the expected return should be 13%. Find the
average beta of the new stocks to achieve the goal ( answer:
1.76) 5. Stock A
has the following returns for various states of the economy: State of the
Economy Probability Stock
A's Return Recession 10% -30% Below
Average 20% -2% Average 40% 10% Above
Average 20% 18% Boom 10% 40% Stock A's
expected return is? Standard deviation? (answer:
expected return = 8.2%, variance=0.02884, standard deviation=16.98%,
visit https://www.jufinance.com/return/) 6. Collectibles
Corp. has a beta of 2.5 and a standard deviation of returns of 20%. The
return on the market portfolio is 15% and the risk free rate is 4%. What is
the risk premium on the market? 7. An
investor currently holds the following portfolio: Amount Invested 8,000 shares of
Stock A $16,000 Beta = 1.3 15,000 shares of
Stock B $48,000 Beta = 1.8 25,000 shares of
Stock C $96,000 Beta = 2.2 The beta
for the portfolio is? 8. Deleted 9. Assume that
you have $165,000 invested in a stock that is returning 11.50%, $85,000
invested in a stock that is returning 22.75%, and $235,000 invested in a
stock that is returning 10.25%. What is the expected return of your portfolio? 10. If you hold
a portfolio made up of the following stocks: Investment
Value Beta Stock
A $8,000 1.5 Stock
B $10,000 1.0 Stock
C $2,000 .5 What is the
beta of the portfolio? 11. You
own a portfolio consisting of the stocks below. Stock Percentage
of
portfolio Beta 1. 20% 1 2. 30% 0.5 3. 50% 1.6 The risk free
rate is 3% and market return is 10%. a. Calculate
the portfolio beta. b. Calculate
the expected return of your portfolio. 12. An
investor currently holds the following portfolio: Amount Invested 8,000 shares of
Stock A $10,000 Beta = 1.5 15,000 shares of
Stock B $20,000 Beta = 0.8 25,000 shares of
Stock C $20,000 Beta = 1.2 Calculate the
beta for the portfolio. Homework Help videos Q1 Q5 Q2 Q3 Q4 Q6 Q7 Q9 TO THE END Quiz 5
prep video Part
I (has three questions from chapter 8) Part
II |
How much does Amazon worth?” --- FYI only: Amazon.com Inc. (AMZN) https://www.stock-analysis-on.net/NASDAQ/Company/Amazoncom-Inc/DCF/Present-Value-of-FCFF
Present
Value of Free Cash Flow to the Firm (FCFF)
In
discounted cash flow (DCF) valuation techniques the value of the stock is estimated
based upon present value of some measure of cash flow. Free cash flow to the
firm (FCFF) is generally described as cash flows after direct costs and
before any payments to capital suppliers.
Intrinsic Stock Value (Valuation Summary)
Amazon.com
Inc., free cash flow to the firm (FCFF) forecast
1 Weighted Average Cost of Capital (WACC)
Amazon.com
Inc., cost of capital
1 USD $ in millions Equity (fair value) = No. shares
of common stock outstanding × Current share price Debt (fair value). See Details » 2 Required rate of return on equity
is estimated by using CAPM. See Details » Required rate of return on
debt. See Details » Required rate of return on debt
is after tax. Estimated (average) effective
income tax rate WACC
= 16.17% FCFF Growth Rate (g)
FCFF growth rate
(g) implied by PRAT model
Amazon.com
Inc., PRAT model
2017
Calculations 2 Interest expense, after tax =
Interest expense × (1 – EITR) 3 EBIT(1 – EITR) = Net income
(loss) + Interest expense, after tax 4 RR = [EBIT(1 – EITR) – Interest
expense (after tax) and dividends] ÷ EBIT(1 – EITR) 5 ROIC = 100 × EBIT(1 – EITR) ÷
Total capital 6 g = RR × ROIC FCFF growth rate
(g) forecast
Amazon.com
Inc., H-model
where: Calculations g2 = g1 + (g5 – g1) × (2 – 1) ÷ (5 – 1) g3 = g1 + (g5 – g1) × (3 – 1) ÷ (5 – 1) g4 = g1 + (g5 – g1) × (4 – 1) ÷ (5 – 1) |
|||||||||||||||||||||||||||||||||||||||||||||||||||||||||||||||||||||||||||||||||||||||||||||||||||||||||||||||||||||||||||||||||||||||||||||||||||||||||||||||||||||||||||||||||||||||||||||||||||||||||||||||||||||||||||||||||||||||||||||||||||||||||||||||||||||||||||||||||||||||||||||||||||||||||||||||||||||||||||||||||||||||||||||||||||||||||||||||||||||||||||||||||||||||||||||||||||||||||||||||||||||||||||||||||||||||||||||||||||||||||||||||||||||||||||||||||||||||||||||||||||||||||||||||||||||||||||||||||||||||||||||||||||||||||||||||||||||||||||||||||||||||||||||||||||||||||||||||||||||||||||||||||||||||||||||||||||||||||||||||||||||||||||||||||||||||||||||||||||||||||||||||||||||||||||||||||||||||||||||||||||||||||||||||||||||||||||||||||||||||||||||||||||||||||||||||||||||||||||||||||||||||||||||||||||||||||||||||||||||||||||||||||||||||||||||||||||||||||||||||||||||||||||||||
|
Week 7 |
Final
Exam (will be posted on blackboard) (on youtube, no WACC, no financial statement) |
|||||||||||||||||||||||||||||||||||||||||||||||||||||||||||||||||||||||||||||||||||||||||||||||||||||||||||||||||||||||||||||||||||||||||||||||||||||||||||||||||||||||||||||||||||||||||||||||||||||||||||||||||||||||||||||||||||||||||||||||||||||||||||||||||||||||||||||||||||||||||||||||||||||||||||||||||||||||||||||||||||||||||||||||||||||||||||||||||||||||||||||||||||||||||||||||||||||||||||||||||||||||||||||||||||||||||||||||||||||||||||||||||||||||||||||||||||||||||||||||||||||||||||||||||||||||||||||||||||||||||||||||||||||||||||||||||||||||||||||||||||||||||||||||||||||||||||||||||||||||||||||||||||||||||||||||||||||||||||||||||||||||||||||||||||||||||||||||||||||||||||||||||||||||||||||||||||||||||||||||||||||||||||||||||||||||||||||||||||||||||||||||||||||||||||||||||||||||||||||||||||||||||||||||||||||||||||||||||||||||||||||||||||||||||||||||||||||||||||||||||||||||||||||||