FIN415 Class Web
Page, Spring '20
Jacksonville
University
Instructor:
Maggie Foley
Term Project Part I (due with
final)
Term project part II (excel
questions) (due with final)
Weekly SCHEDULE, LINKS, FILES and Questions
|
Week |
Coverage, HW, Supplements -
Required |
|
Videos (optional) |
|||||||||||||||||||||||||||||||||||||||||||||||||||||||||||||||||||||||||||||||||||||||||||||||||||||||||||||||||||||||||||||||||||||||||||||||||||||||||||||||||||||||||||||||||||||||||||||||||||||||||||||||||||||||||||||||||||||||||||||||||||||||||||||||||||||||||||||||||||||||||||||||||||||||||||||||||||||||||||||||||||||||||||||||||||||||||||||||||||||||||||||||||||||||||||||||||||||||||||||||||||||||||||||||||||||||||||||||||||||||||||||||||||||||||||||||||||||||||||||||||||||||||||||||||||||||||||||||||||||||||||||||||||||||||||||||||||||||||||||||||||||||||||||||||||||||||||||||||||||||||||||||||||||||||||||||||||||||||||||||||||||||||||||||||||||||||||||||||||||||||||||||||||||||||||||||||||||||||||||||||||||||||||||||||||||||||||||||||||||||||||||||||||||||||||||||||||||||||||||||||||||||||||||||||||||||||||||||||||||||||||||||||||||||||||||||||||||||||||||||||||||||||||||||||||||||||||||||||||||||||||||||||||||||||||||||||||||||||||||||||||||||||||||||||||||||||||||
|
Week 1 |
Marketwatch Stock Trading Game (Pass code: havefun) 1. URL for your game: 2. Password for this private game: havefun. 3. Click on the 'Join Now' button to get
started. 4. If you are an existing MarketWatch member, login. If you are a new user,
follow the link for a Free account - it's easy! 5. Follow the instructions and start trading! 6. Game will be over
on 4/17/2019 |
|
||||||||||||||||||||||||||||||||||||||||||||||||||||||||||||||||||||||||||||||||||||||||||||||||||||||||||||||||||||||||||||||||||||||||||||||||||||||||||||||||||||||||||||||||||||||||||||||||||||||||||||||||||||||||||||||||||||||||||||||||||||||||||||||||||||||||||||||||||||||||||||||||||||||||||||||||||||||||||||||||||||||||||||||||||||||||||||||||||||||||||||||||||||||||||||||||||||||||||||||||||||||||||||||||||||||||||||||||||||||||||||||||||||||||||||||||||||||||||||||||||||||||||||||||||||||||||||||||||||||||||||||||||||||||||||||||||||||||||||||||||||||||||||||||||||||||||||||||||||||||||||||||||||||||||||||||||||||||||||||||||||||||||||||||||||||||||||||||||||||||||||||||||||||||||||||||||||||||||||||||||||||||||||||||||||||||||||||||||||||||||||||||||||||||||||||||||||||||||||||||||||||||||||||||||||||||||||||||||||||||||||||||||||||||||||||||||||||||||||||||||||||||||||||||||||||||||||||||||||||||||||||||||||||||||||||||||||||||||||||||||||||||||||||||||||||||||||||
2019
in Review: The Global Economy Explained in 5 Charts
Global growth this
year recorded its weakest pace since the global financial crisis a decade
ago, reflecting common influences across countries and country-specific
factors. Rising trade
barriers and associated uncertainty weighed on business sentiment and
activity globally. In some cases (advanced economies and China), these
developments magnified cyclical and structural slowdowns already under way. Further
pressures came from country-specific weakness in large emerging market
economies such as Brazil, India, Mexico, and Russia. Worsening macroeconomic
stress related to tighter financial conditions (Argentina), geopolitical
tensions (Iran), and social unrest (Venezuela, Libya, Yemen) rounded out the
difficult picture.
With the
economic environment becoming more uncertain, firms turned cautious on
long-range spending and global purchases of machinery and equipment
decelerated. Household demand for durable goods also weakened, although there
was a pick up in the second quarter of 2019. This was particularly evident
with automobiles, where regulatory changes, new emission standards, and
possibly the shift to ride-shares weighed on sales in several countries.
Faced with
sluggish demand for durable goods, firms scaled back industrial production.
Global trade—which is intensive in durable final goods and the components
used to produce them—slowed to a standstill.
Central banks
reacted aggressively to the weaker activity. Over the course of the year,
several—including the US Federal Reserve, the European Central Bank (ECB),
and large emerging market central banks—cut interest rates, while the ECB
also restarted asset purchases.
These policies
averted a deeper slowdown. Lower interest rates and supportive financial
conditions reinforced still-resilient purchases of nondurable goods and
services, encouraging job creation. Tight labor markets and gradually rising
wages, in turn, supported consumer confidence and household spending.
Will these
bright spots translate into stronger global growth next year? Find out more when
the IMF releases its World Economic Outlook Update on
January 20. We're not
predicting recession in 2020 but odds are growing, says Vanguard global chief
economist (Video)
For class discussion: What is
your opinion about the US economy in 2019? What is
your economic outlook of 2020? Recession? |
|
For class discussion: ·
Any
interesting facts? Any surprises? And why? ·
Find
the current exchange rates among the G7 countries and BRIC countries. ·
Convert
$100 to currencies of the G7 countries and BRIC countries. ·
Assuming
you are a consultant. What advice can you give to investors in Japan to make
money without risk? |
||||||||||||||||||||||||||||||||||||||||||||||||||||||||||||||||||||||||||||||||||||||||||||||||||||||||||||||||||||||||||||||||||||||||||||||||||||||||||||||||||||||||||||||||||||||||||||||||||||||||||||||||||||||||||||||||||||||||||||||||||||||||||||||||||||||||||||||||||||||||||||||||||||||||||||||||||||||||||||||||||||||||||||||||||||||||||||||||||||||||||||||||||||||||||||||||||||||||||||||||||||||||||||||||||||||||||||||||||||||||||||||||||||||||||||||||||||||||||||||||||||||||||||||||||||||||||||||||||||||||||||||||||||||||||||||||||||||||||||||||||||||||||||||||||||||||||||||||||||||||||||||||||||||||||||||||||||||||||||||||||||||||||||||||||||||||||||||||||||||||||||||||||||||||||||||||||||||||||||||||||||||||||||||||||||||||||||||||||||||||||||||||||||||||||||||||||||||||||||||||||||||||||||||||||||||||||||||||||||||||||||||||||||||||||||||||||||||||||||||||||||||||||||||||||||||||||||||||||||||||||||||||||||||||||||||||||||||||||||||||||||||||||||||||||||||||||||||
|
Part II In class exercise –
convert currencies back and forth If
the dollar is pegged to gold at US $1200 = 1 ounce of gold and the British
pound is pegged to gold at £240 = 1 ounce of gold. What should be the
exchange rate between US$ and British £? How much can you make without any
risk if the exchange rate is 1£ = 6$? Assume that your initial investment is
$1200. Solution: Start with $1200à
option 1: get 1 ounce of gold à
trade for £240 in UK è
and then get £240 * 6$/£ = $1440, the money that you can put into your pocket
è $240 profits
($1440-$1200), this strategy works! Start with $1200à option 2: get £200 ($1200
and 1£ for 6$, so $1200/6=£200) è get gold (200/240 = 5/6 ounce of
gold) è get back
$, 1200*(5/6) = $1000è this
strategy will not work! You will lose $200 by doing so! Note
that with $1200, you can either buy gold first, or get £ first. |
|
Reference of useful websites for global economy International Trade
Statistics (PDF) Current Account (BOP) Data – World Bank http://data.worldbank.org/indicator/BN.CAB.XOKA.CD IMF, world bank and UN are only a few of the major organizations
that track, report and aid international economic and
financial development. Using these website, you can summarize the
economic outlook for each country. IMF: www.imf.org/external/index.htm UN: www.un.org/databases/index.htm World bank: www.worldbank.org Bank of international settlement: www.bis.org/index.htm St. Louis Federal Reserve provides a large amount of recent open
economy macroeconomic data online. You can track down BOP and GDP data for
the major industrial countries. Recent international economic data: research.stlouisfed.org/publicaitons/iet |
||||||||||||||||||||||||||||||||||||||||||||||||||||||||||||||||||||||||||||||||||||||||||||||||||||||||||||||||||||||||||||||||||||||||||||||||||||||||||||||||||||||||||||||||||||||||||||||||||||||||||||||||||||||||||||||||||||||||||||||||||||||||||||||||||||||||||||||||||||||||||||||||||||||||||||||||||||||||||||||||||||||||||||||||||||||||||||||||||||||||||||||||||||||||||||||||||||||||||||||||||||||||||||||||||||||||||||||||||||||||||||||||||||||||||||||||||||||||||||||||||||||||||||||||||||||||||||||||||||||||||||||||||||||||||||||||||||||||||||||||||||||||||||||||||||||||||||||||||||||||||||||||||||||||||||||||||||||||||||||||||||||||||||||||||||||||||||||||||||||||||||||||||||||||||||||||||||||||||||||||||||||||||||||||||||||||||||||||||||||||||||||||||||||||||||||||||||||||||||||||||||||||||||||||||||||||||||||||||||||||||||||||||||||||||||||||||||||||||||||||||||||||||||||||||||||||||||||||||||||||||||||||||||||||||||||||||||||||||||||||||||||||||||||||||||||||||||||
|
Chapter 2 Chapter 2 (PPT) Let’s watch this video together. Imports, Exports, and Exchange
Rates: Crash Course Economics #15 ·
What is BOP? The balance of payment of a country contains two accounts:
current and capital. The current account records
exports and imports of goods and services as well as unilateral transfers,
whereas the capital account records purchase
and sale transactions of foreign assets and liabilities during a particular
year. ·
What is the current account? Balance of
payments: Current account (video, Khan academy)
As the name implies, the current account considers goods and
services currently being produced. The current account deals with short-term transactions known
as actual transactions, as they have a real impact on income, output and
employment levels of a country through the movement of goods and services in the
economy. It consists of visible trade (export and import of goods), invisible trade (export
and import of services), unilateral transfers, and investment income (income from
factors such as land or foreign shares). The credit and debit of foreign exchangedue
to these transactions are also recorded in the balance of current account. The
resulting balance of the current account is approximated as the sum total of balance of trade.
https://www.bea.gov/data/intl-trade-investment/international-transactions
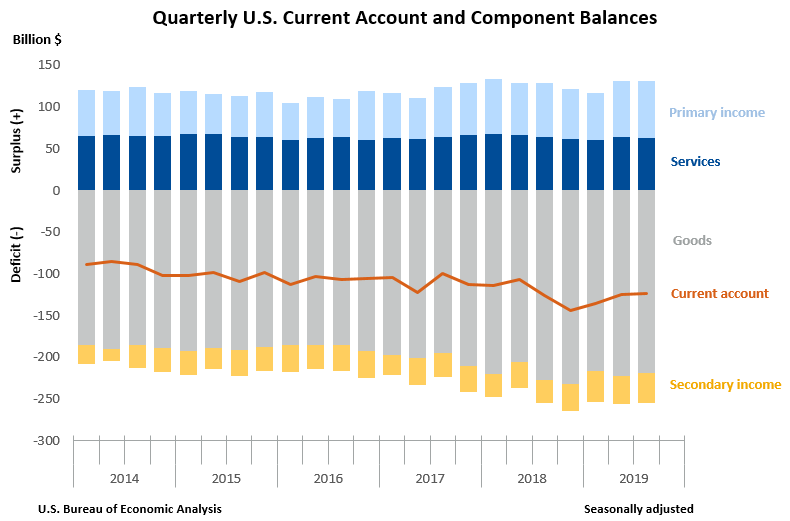
The U.S. current account deficit narrowed by $1.1 billion, or 0.9 percent, to $124.1 billion in the third quarter of 2019, according to statistics from the U.S. Bureau of Economic Analysis. The revised second quarter deficit was $125.2 billion. The third quarter deficit was 2.3 percent of current dollar gross domestic product, down less than 0.1 percent from the second quarter. For Details, please read the following article. U.S.
International Transactions, Third Quarter 2019
Current
Account Deficit Narrows by 0.9 Percent in Third Quarter The U.S.
current account deficit, which reflects the combined
balances on trade in goods and services and income flows between U.S.
residents and residents of other countries, narrowed by $1.1 billion, or 0.9
percent, to $124.1 billion in the third quarter of 2019, according to
statistics from the U.S. Bureau of Economic Analysis (BEA). The revised
second quarter deficit was $125.2 billion. The third
quarter deficit was 2.3 percent of current dollar gross domestic product,
down less than 0.1 percent from the second quarter. The $1.1
billion narrowing of the current account deficit in the third quarter mainly
reflected a reduced deficit on goods and an expanded surplus on primary
income.
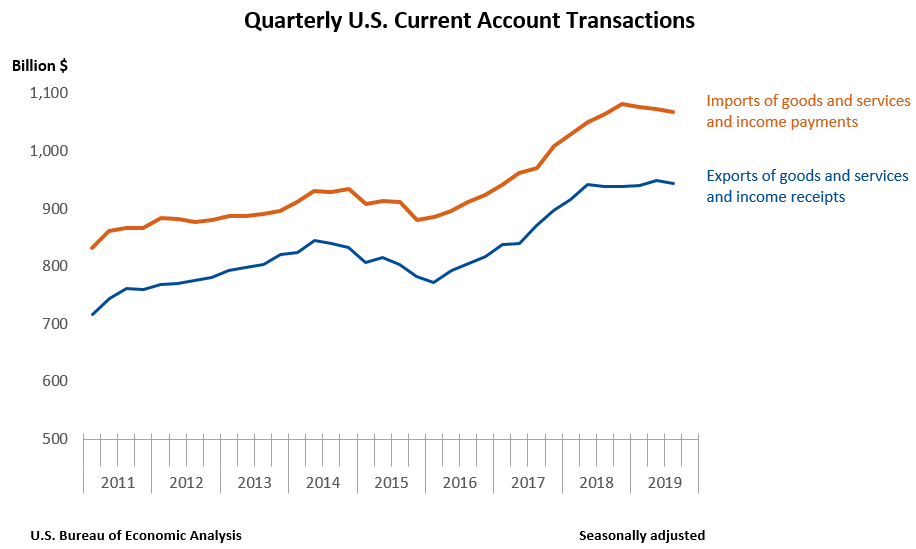
Current Account
Transactions Exports of
goods and services to, and income received from, foreign residents decreased
$4.3 billion, to $944.4 billion, in the third quarter. Imports of goods and
services from, and income paid to, foreign/n residents decreased $5.4
billion, to $1.07 trillion.
Trade in Goods Exports of
goods decreased $0.9 billion, to $413.8 billion, and imports
of goods decreased $4.5 billion, to $633.4 billion. The
decreases in both exports and imports mainly reflected decreases in
industrial supplies and materials, primarily petroleum and products. Trade in Services Exports of services decreased
$0.3 billion, to $212.0 billion, reflecting partly offsetting changes across
major categories. Decreases were led by travel, mainly other personal travel,
and increases were led by other business services, mainly professional and
management consulting services. Imports of services increased
$1.6 billion, to $149.8 billion, reflecting increases in nearly all major
categories. Increases were led by insurance services, mainly reinsurance. Primary Income Receipts of primary income decreased $4.1 billion, to $282.0 billion, and payments
of primary income decreased $6.2 billion, to $213.3
billion. The decreases in both receipts and payments mainly reflected
decreases in direct investment income and in other investment income. Within
direct investment income receipts, dividends increased $24.9 billion, to
$95.3 billion, in the third quarter and remain elevated since the passage of
the 2017 Tax Cuts and Jobs Act, which generally eliminated taxes on
repatriated earnings beginning in 2018. For more information, see “How do the effects of the 2017 Tax Cuts and Jobs Act
appear in BEA’s direct investment statistics?” The decreases in other investment income receipts and
payments mainly reflected decreases in interest on loans and deposits. Secondary Income Receipts of secondary income increased $1.0 billion, to $36.6 billion, mainly
reflecting an increase in private sector fines and penalties, a component of
private transfer receipts. Payments of secondary income increased
$3.7 billion, to $72.0 billion, mainly reflecting increases in U.S.
government grants and in insurance-related transfers, a component of private
transfer payments. ·
What is the Capital Account
Balance of payments: Capital account (video,
Khan Academy) The capital account is a
record of the inflows and outflows of capital that directly affect a nation’s foreign assets and liabilities. It is concerned with all international trade
transactions between citizens of a given country and
citizens in other countries. The components of the capital account include foreign investment and loans,
banking capital and other forms of capital, as well as monetary movements or
changes in the foreign exchange
reserve. The capital account flow reflects factors such as
commercial borrowings, banking, investments, loans, and capital. In other words, the capital account is concerned with payments
of debts and claims, regardless of the time period. The balance of capital
account also includes all items reflecting changes in stocks.
https://fred.stlouisfed.org/tags/series?t=capital+account · The Bottom LineIn economic terms, the current account deals with receipt and
payment in cash as well as non-capital items, and the capital account
reflects sources and utilization of capital. The sum of the current
account and capital account as reflected in the balance of payments will
always be zero; any surplus or deficit in
the current account is matched and canceled out by an equal surplus or
deficit in the capital account. (https://www.investopedia.com/ask/answers/031615/whats-difference-between-current-account-and-capital-account.asp) The
20 largest trade partners of the United States represent 76.6% of
U.S. exports, and 81.0% of U.S. imports as of December 2014. These
figures do not include services or foreign direct investment. The
largest US partners with their total trade (sum of imports and exports)
in millions of $ for calendar year 2016 are as follows
Source:
indexmundi.com and world bank (2015) For
Class Discussion: 1. Can US win the trade war
against China? Can trade war help reduce US current deficit? 2. Can
US devaluate currency to eliminate current account deficit? Why does US reduce interest rate? Can cutting
interest rate help boosting US economy? · $
devalued, then export become cheaper and increased; imports more expensive
and decreased; seems like current account deficit could disappear. · However,
in short run, demand is not so flexible and thereby current account might get
worsen. · Demand
will improve with time, so current account improves with time, but not
immediately. · $
depreciated, it becomes less attractive to foreign government and investors.
The borrowing cost to cover the deficit will increase. · $
depreciated, living standard might drop. · Competitor
can drop price; Countries can devalue their currencies. · Your
idea? Topic:
Trade war with China to reduce trade deficit (current account deficit) Despite Trump's tariffs,
the U.S. trade deficit keeps growing (video)
U.S. China
Trade War Explained: How Tariffs Work & Impact the Economy (video)
Analysts say
US-China trade imbalance may not be what really matters (vido)
A Wall Street
Strategist Explains His Trade Deficit With Costco (Video)
Timeline of the
China-U.S. trade war (video)
HW I- Chapter 2
(Due with first mid term exam) 1.
About the trade war between US and China and the upcoming one between
US and Germany, what is your opinion? Can the trade wars help reduce the US
current account deficits? 2.
Based on the classroom discussion, and documents posted and available
online, do you think that the trade war against China could help US to reduce
its trade deficit (or current account deficit)? Please be specific. 3. Internet exercises (not
required, information for intereted students only) a. IMF,
world bank and UN are only a few of the major organizations that track, report and aid international economic and financial
development. Based on information provided in those websites, you could learn
about a country’s economic outlook. IMF: www.imf.org/external/index.htm UN: www.un.org/databases/index.htm World
bank: www.worldbank.org’ Bank
of international settlement: www.bis.org/index.htm b. St.
Louis Federal Reserve provides a large amount of recent open economy
macroeconomic data online. You can track down BOP and GDP data for the major
industrial countries. Recent
international economic data: research.stlouisfed.org/publications Balance
of Payments statistics: research.stlouisfed.org/fred2/categories/125 |
|
Balance of
payments: Current account (video, Khan academy) (FYI)
Balance of payments:
Capital account (video, Khan Academy) (FYI) US Trade Deficit With China and Why
It's So High
The Real Reason American Jobs Are
Going to China (For class discussion)
Updated November 21, 2018 The U.S. trade deficit with China was $375 billion in
2017. The trade deficit exists because U.S. exports to China were
only $130 billion while imports from China were $506 billion. The United States imported from China $77 billion in computers
and accessories, $70 billion in cell phones, and $54 billion in apparel and
footwear. A lot of these imports are from U.S. manufacturers that send raw
materials to China for low-cost assembly. Once shipped back to the United
States, they are considered imports. In 2017, China imported from America $16 billion in commercial aircraft, $12
billion in soybeans, and $10 billion in autos. In 2018, China canceled its
soybean imports after President Trump started a trade war. He imposed tariffs on Chinese steel exports and other
goods. Current Trade Deficit As of July 2018, the United States exported a total of $74.3
billion in goods to China. It imported $296.8 billion, according to the U.S. Census Bureau. As a result, the total trade deficit
with China is $222.6 billion. A monthly breakdown is in the chart. Causes China can produce many consumer goods at lower costs than
other countries can. Americans, of course, want these goods for the lowest
prices. How does China keep prices so low? Most economists agree that China's
competitive pricing is a result of two factors:
If the United States implemented trade protectionism, U.S.
consumers would have to pay high prices for their "Made in America"
goods. It’s unlikely that the trade deficit will change. Most people would
rather pay as little as possible for computers, electronics, and
clothing, even if it means other Americans lose their jobs. China is the world's largest economy. It also has the world's biggest
population. It must divide its production between almost 1.4 billion
residents. A common way to measure standard of living is gross domestic product per
capita. In 2017,
China’s GDP per capita was $16,600. China's leaders are desperately trying to
get the economy to grow faster to raise the country’s living standards.
They remember Mao's Cultural Revolution all too well. They know that the
Chinese people won't accept a lower standard of living forever. China sets the value of its currency, the yuan, to equal the value of a basket of
currencies that includes the dollar. In other words, China pegs its currency to the dollar using a
modified fixed exchange rate.
When the dollar loses value, China buys dollars through U.S. Treasurys to support it. In 2016, China
began relaxing its peg. It wants market forces to have a greater impact on
the yuan's value. As a result, the dollar to yuan conversion has been more volatile since
then. China's influence on the dollar remains substantial. Effect China must buy so many U.S. Treasury notes that it is the
largest lender to the U.S. government. Japan is the second largest. As
of September 2018, the U.S. debt to China was $1.15 trillion. That's
18 percent of the total public debt owned by foreign countries. Many are concerned that this gives China
political leverage over U.S. fiscal policy. They worry about
what would happen if China started selling its Treasury holdings. It
would also be disastrous if China merely cut back on its Treasury purchases. Why are they so worried? By buying Treasurys, China helped
keep U.S. interest rates low. If China were to stop buying
Treasurys, interest rates would rise. That could throw the United States into a recession. But
this wouldn’t be in China's best interests, as U.S. shoppers would buy fewer
Chinese exports. In fact, China is buying almost as many Treasurys
as ever. U.S. companies that can't compete with cheap Chinese goods
must either lower their costs or go out of business. Many businesses reduce
their costs by outsourcing jobs to China or India. Outsourcing adds to
U.S. unemployment. Other industries have just dried up. U.S.
manufacturing, as measured by the number of jobs, declined 34
percent between 1998 and 2010. As these industries declined, so has
U.S. competitiveness in the global marketplace. What's Being Done President Trump promised to lower the trade deficit with
China. On March 1, 2018, he announced he would impose a 25
percent tariff on steel imports and a 10 percent tariff on
aluminum. On July 6, Trump's tariffs went into effect for $34 billion of
Chinese imports. China canceled all import contracts for soybeans. Trump's tariffs have raised the costs of imported steel, most
of which is from China. Trump's move comes a month after he imposed
tariffs and quotas on imported solar panels and washing
machines. China has become a global leader in solar panel
production. The tariffs depressed the stock market when they were
announced. The Trump administration is developing further
anti-China protectionist measures, including more tariffs. It wants China to remove
requirements that U.S. companies transfer technology to Chinese firms. China
requires companies to do this to gain access to its market. Trump also asked China to do more to raise its currency. He
claims that China artificially undervalues the yuan by 15 percent to 40
percent. That was true in 2000. But former Treasury Secretary Hank Paulson initiated the U.S.-China Strategic
Economic Dialogue in 2006. He convinced the People's Bank of China to
strengthen the yuan's value against the dollar. It increased 2 to 3 percent annually
between 2000 and 2013. U.S. Treasury Secretary Jack Lew continued the
dialogue during the Obama administration. The Trump administration continued the talks until they
stalled in July 2017. The dollar strengthened 25 percent between 2013 and 2015.
It took the Chinese yuan up with it. China had to lower costs even more
to compete with Southeast Asian companies. The PBOC tried unpegging the yuan
from the dollar in 2015. The yuan immediately plummeted. That indicated that
the yuan was overvalued. If the yuan were undervalued, as Trump claims, it
would have risen instead. Potential questions for discussion: 1. How does China manipulate its currency according to this paper? 2. What would happen to interest rate if China stops purchasing Treasury securities? 3. Do you think the tariff worked as it was supposed to? 4. … A quick guide to the US-China trade
war (https://www.bbc.com/news/business-45899310)
·
16 December
2019 ·
·
The world's
two largest economies are locked in a bitter trade battle. The
dispute, which has simmered for nearly 18 months, has seen the US and China
impose tariffs on hundreds of billions of dollars worth of one another's
goods. US
President Donald Trump has long accused China of unfair trading practices and
intellectual property theft. In China,
there is a perception that the US is trying to curb its rise as a global
economic power. § The US-China trade war
in charts § US-China trade war:
'We're all paying for this' Negotiations
are ongoing but have proven difficult. In December, the two sides announced
a preliminary deal but some of the thorniest issues
remain unresolved. Uncertainty
surrounding the trade war has hurt businesses and weighed on the global
economy. What tariffs have been imposed?
Mr Trump's
tariffs policy aims to encourage consumers to buy American by making imported
goods more expensive. So far, the
US has imposed tariffs on more than $360bn (£268bn) of Chinese goods, and
China has retaliated with tariffs on more than $110bn of US products. Washington
delivered three rounds of tariffs last year, and a fourth one in September. The most recent round
targeted Chinese imports, from meat to musical instruments, with a 15% duty. Beijing
has hit back with tariffs ranging from 5% to 25% on US goods. Its latest
tariff strike included a 5% levy on US crude oil, the first time fuel has
been hit in the trade battle.
What's next?
The so-called "phase one" deal agreed in December
reduces some US tariffs in exchange for more Chinese purchases of American
products, and better protection for US intellectual property. § Trump
escalates trade war with fresh tariff hikes § US delays some
tariffs on Chinese imports The deal is yet to be signed and tariffs of 25% on $250bn
worth of Chinese goods remain in place. However, the US will drop tariffs on $120bn worth of
Chinese goods to 7.5%. Washington also shelved a planned round of tariffs, which
would have hit Chinese smart phones, clothing and toys. For class
discussion: What is the
purpose of the trade war against China? Has the
trade war achieved its goal yet? |
||||||||||||||||||||||||||||||||||||||||||||||||||||||||||||||||||||||||||||||||||||||||||||||||||||||||||||||||||||||||||||||||||||||||||||||||||||||||||||||||||||||||||||||||||||||||||||||||||||||||||||||||||||||||||||||||||||||||||||||||||||||||||||||||||||||||||||||||||||||||||||||||||||||||||||||||||||||||||||||||||||||||||||||||||||||||||||||||||||||||||||||||||||||||||||||||||||||||||||||||||||||||||||||||||||||||||||||||||||||||||||||||||||||||||||||||||||||||||||||||||||||||||||||||||||||||||||||||||||||||||||||||||||||||||||||||||||||||||||||||||||||||||||||||||||||||||||||||||||||||||||||||||||||||||||||||||||||||||||||||||||||||||||||||||||||||||||||||||||||||||||||||||||||||||||||||||||||||||||||||||||||||||||||||||||||||||||||||||||||||||||||||||||||||||||||||||||||||||||||||||||||||||||||||||||||||||||||||||||||||||||||||||||||||||||||||||||||||||||||||||||||||||||||||||||||||||||||||||||||||||||||||||||||||||||||||||||||||||||||||||||||||||||||||||||||||||||||
|
Part II of Chapter 2 --- Evolution of international monetary system Finance: The History of Money (combined) (video, fan to
watch)
Review of history of money: A brief history of money - From gold to
bitcoin and cryptocurrencies (video)
· Bimetallism:
Before 1875 · Classical
Gold Standard: 1875-1914 The Gold Standard Explained in One Minute (video)
§ International
value of currency was determined by its fixed relationship to gold. § Gold was used to
settle international accounts, so the risk of trading with other countries
could be reduced. · Interwar
Period: 1915-1944 § Countries
suspended gold standard during the WWI, to increase money supply and pay for
the war. § Countries relied
on a partial gold standard and partly other countries’ currencies
during the WWII · Bretton Woods System: 1945-1972 The Bretton Woods Monetary System (1944 - 1971) Explained in
One Minute (video)
§ All currencies
were pegged to US$. § US$ was the only
currency that was backed by gold. § US$ was world
currency at that time. · The
Flexible Exchange Rate Regime: 1973-Present FLOATING AND FIXED EXCHANGE RATE (video)
For class discussion: Read the following. Is there any knowledge that is new to you? The Evolution
of US Currency
At times, America may not be
the most popular nation in the world, but one thing is for sure: it is famous
for its green. The greenback has been iconic since its inception. This infographic above misses a few key instances
in US currency history – namely the birth of the
Federal Reserve in 1913 and Nixon ending convertibility to gold in
1971. Both events were catalysts to massive money printing which leaves
the USD with only a fraction of the purchasing power that it once had.
|
|
Brexit: What happens now? By Peter BarnesSenior elections and political analyst, BBC
News ·
16 January 2020
The government's large majority meant that
the EU Withdrawal Bill sailed through the House of Commons. There will be attempts to amend the bill in
the Lords but any significant changes would almost certainly be overturned by
MPs. It is expected to become law within days. What happens after Brexit? Assuming the European Parliament also gives
the green light, the UK will formally leave the EU on 31 January with a
withdrawal deal - and it will then go into a transition period that is
scheduled to end on 31 December 2020. During this period the UK will effectively
remain in the EU's customs union and single market - but will be outside the
political institutions and there will be no British members of the European
Parliament. Future trade deal The first priority will be to negotiate a
trade deal with the EU. The UK wants as much access as possible for its goods
and services to the EU. But the government has made clear that the
UK must leave the customs union and single market and end the overall
jurisdiction of the European Court of Justice. Time is short. The EU could take weeks to
agree a formal negotiating mandate - all the remaining 27 member states and
the European Parliament have to be in agreement. That means formal talks
might only begin in March. The government has ruled out any form of
extension to the transition period. If no trade deal has been agreed and
ratified by the end of the year, then the UK faces the prospect of tariffs on
exports to the EU. The prime minister has argued that as the UK
is completely aligned to EU rules, the negotiation should be straightforward.
But critics have pointed out that the UK wishes to have the freedom to
diverge from EU rules so it can do deals with other countries - and that will
make negotiations more difficult. It's not just a trade deal that needs to be sorted out. The UK must agree how it is going to co-operate with the EU on security and law enforcement. The UK is set to leave the European Arrest Warrant scheme and will have to agree a replacement. It must also agree deals in a number of other areas where co-operation is needed. (https://www.bbc.com/news/uk-politics-46393399) |
||||||||||||||||||||||||||||||||||||||||||||||||||||||||||||||||||||||||||||||||||||||||||||||||||||||||||||||||||||||||||||||||||||||||||||||||||||||||||||||||||||||||||||||||||||||||||||||||||||||||||||||||||||||||||||||||||||||||||||||||||||||||||||||||||||||||||||||||||||||||||||||||||||||||||||||||||||||||||||||||||||||||||||||||||||||||||||||||||||||||||||||||||||||||||||||||||||||||||||||||||||||||||||||||||||||||||||||||||||||||||||||||||||||||||||||||||||||||||||||||||||||||||||||||||||||||||||||||||||||||||||||||||||||||||||||||||||||||||||||||||||||||||||||||||||||||||||||||||||||||||||||||||||||||||||||||||||||||||||||||||||||||||||||||||||||||||||||||||||||||||||||||||||||||||||||||||||||||||||||||||||||||||||||||||||||||||||||||||||||||||||||||||||||||||||||||||||||||||||||||||||||||||||||||||||||||||||||||||||||||||||||||||||||||||||||||||||||||||||||||||||||||||||||||||||||||||||||||||||||||||||||||||||||||||||||||||||||||||||||||||||||||||||||||||||||||||||||
|
Second
Quiz Solution (FYI) 1. If U.S. imports > exports, then the supply of dollars > the demand of the dollars in the foreign exchange market, ceteris paribus. True / false Solution: Import means using $ (spending $, or out flow of $) to buy foreign goods è In the FX market, supply of $ increases è So when supply increases and assume that demand is unchanged, the value of $ will drop 2. If Japan exports > imports, then yen would appreciate against other currencies. True / false Solution: Export means selling domestic products for yen ( in flow of yen from importers who will pay yen for the goods made in Japan; there is an increased demand for yen) è In the FX market, demand of yen increases è So when demand increases and assume that supply is unchanged, the value of yen will rise. 3. If the interest rate rises in the U.S., ceteris paribus, then capital will flow out of the U.S. True / false Solution: Interest rate rises è financial market will become more attractive to foreign investors è capital will flow in, not flow out. Chapter 3 International Financial Market/ References: Go to www.forex.com and
set up a practice account and you can trade with $50,000 virtue money. Visit http://www.dailyfx.com/to
get daily foreign exchange market news. Part I: international financial centers As of today, the top ten global financial
centers were:
·
London. London has been a leading international
financial centre since
the 19th century, acting as a centre of lending and
investment around the world. English contract law was
adopted widely for international
finance, with legal services provided in
London. Financial institutions located there provided services
internationally such as Lloyd's of London (founded
1686) for insurance and the Baltic Exchange (founded 1744)
for shipping. During the 20th century London played an important role in
the development of new financial products such as the Eurodollar and Eurobonds in the 1960s,
international asset management and international equities trading in the
1980s, and derivatives in the 1990s. London continues to maintain a leading
position as a financial centre in the 21st century, and maintains the largest
trade surplus in financial services around the world. However, like New York,
it faces new competitors including fast-rising eastern financial centres such
as Hong Kong and Shanghai. London is the largest centre for derivatives markets, foreign
exchange markets, money markets, issuance of
international debt securities, international insurance, trading in gold, silver and base metals through
the London
bullion market and London
Metal Exchange, and
international bank lending. London
benefits from its position between the Asia and U.S. time zones, and has benefited from its location within the European Union, though this may end following the outcome of the Brexit referendum of 2016 and the
decision of the United Kingdom to leave the European Union. As well as
the London
Stock Exchange, the Bank of England, the second oldest
central bank, and the European
Banking Authority are in London, although the EBA is
moving to Paris in March 2019 after Brexit. ·
Tokyo. One report
suggests that Japanese authorities are working on plans to transform Tokyo
but have met with mixed success, noting that "initial drafts suggest
that Japan's economic specialists are having trouble figuring out the secret
of the Western financial centres' success." Efforts include
more English-speaking restaurants and services a/nd the building of many new
office buildings in Tokyo, but more powerful stimuli such as lower taxes have
been neglected and a relative aversion to finance remains prevalent in Japan. Tokyo
emerged as a major financial centre in the 1980s as the Japanese economy
became one of the largest in the world. As a financial centre, Tokyo has good links with New
York City and London. ·
Hong
Kong. As a financial centre,
Hong Kong has strong links with London and New York City. It developed its financial services industry while a
British territory and its present legal system, defined in Hong Kong Basic Law,
is based on English law.
In 1997, Hong Kong became a Special Administrative Region of the People's Republic
of China, retaining its laws and a high degree of autonomy
for at least 50 years after the transfer. Most of the world's 100 largest
banks have a presence in the city. Hong Kong is a
leading location for initial
public offerings, competing with New York City, and also for merger and acquisition activity ·
Singapore. With its strong links with London, Singapore has developed into the Asia region's largest
centre for foreign exchange and commodity trading, as well as a growing
wealth management hub.
Other than Tokyo, it
is one of the main centres for fixed income trading in Asia. However, the
market capitalisation of its stock exchange has been falling since 2014 and
several major companies plan to delist. (https://en.wikipedia.org/wiki/Financial_centre) For Discussion: What
makes an international financial centre? (video)
Is
China threatening Asia's financial center? | CNBC Explains
(video)
Do
we need so many financial centers in Asia? Part II: Floating exchange rate system vs. fixed
exchange rate system For Discussion: · US is using floating exchange rate system. What is the
advantage and disadvantage of this system? DO we need Cheap $ or strong $? · Chinese
currency is pegged to US$. What is the advantage and disadvantage of this
system? What about let it float, instead of holding its value at a fixed
rate? Can Chinese government control its currency? How? Is cheap RMB always
better than Strong RMB, to Chinese government? · Germany
is part of the Euro Zone. Can Germany manipulate Euro? · Who
are the major players in the FX market? · As
compared with stock market, FX market is more volatile or less? Why? A - set a fixed exchange rate between its currency and
another while allowing capital to flow freely across its borders, B - allow capital to flow freely and set
its own monetary policy, or C - set its own monetary policy and
maintain a fixed exchange rate. The Impossible Trinity or "The
Trilemma", in which two policy positions are possible. If a nation were
to adopt position a, for example,
then it would maintain a fixed exchange rate and allow free capital flows,
the consequence of which would be loss of monetary sovereignty.
The Impossible Trinity - 60 Second Adventures in Economics (5/6)
(video)
The impossible trinity (also
known as the trilemma) is a concept
in international
economics which states that it is impossible to have all
three of the following at the same time: ·
a fixed foreign exchange
rate ·
free capital movement (absence of capital controls) ·
an independent monetary policy It is both a hypothesis based on the uncovered interest
rate parity condition, and
a finding from empirical studies where governments that have tried to
simultaneously pursue all three goals have failed. The concept was developed
independently by both John Marcus Fleming in 1962 and Robert Alexander
Mundell in different articles between 1960 and 1963. Policy
choices
According to the impossible
trinity, a central bank can only pursue two of the above-mentioned three
policies simultaneously. To see why, consider this example: Assume that world interest
rate is at 5%. If the home central bank tries to set domestic interest rate
at a rate lower than 5%, for example at 2%, there will be a depreciation
pressure on the home currency, because investors would want to sell their low
yielding domestic currency and buy higher yielding foreign currency. If the
central bank also wants to have free capital flows, the only way the central
bank could prevent depreciation of the home currency is to sell its foreign
currency reserves. Since foreign currency reserves of a central bank are
limited, once the reserves are depleted, the domestic currency will
depreciate. Hence, all three of the
policy objectives mentioned above cannot be pursued simultaneously. A central
bank has to forgo one of the three objectives. Therefore, a central bank has
three policy combination options. Options
In terms of the diagram above
(Oxelheim, 1990), the options are: ·
Option (a): A stable exchange rate and free capital flows (but
not an independent monetary policy because setting a domestic interest rate
that is different from the world interest rate would undermine a stable
exchange rate due to appreciation or depreciation pressure on the domestic
currency). ·
Option (b): An independent monetary policy and free capital
flows (but not a stable exchange rate). ·
Option (c): A stable exchange rate and independent monetary policy
(but no free capital flows, which would require the use of capital
controls. Currently, Eurozone members
have chosen the first option (a) while most other countries have opted for
the second one (b). By contrast, Harvard economist Dani Rodrik advocates the use of the
third option (c) in his book The Globalization Paradox, emphasising
that world GDP grew fastest during the Bretton Woods era when capital
controls were accepted in mainstream economics. Rodrik also argues that the
expansion of financial globalization and the free movement of
capital flows are the reason why economic crises have become more frequent in
both developing and advanced economies alike. Rodrik has also developed the
"political trilemma of the world economy", where
"democracy, national sovereignty and global economic
integration are mutually incompatible: we can combine any two of the
three, but never have all three simultaneously and in full." (from Wikipedia)
|
||||||||||||||||||||||||||||||||||||||||||||||||||||||||||||||||||||||||||||||||||||||||||||||||||||||||||||||||||||||||||||||||||||||||||||||||||||||||||||||||||||||||||||||||||||||||||||||||||||||||||||||||||||||||||||||||||||||||||||||||||||||||||||||||||||||||||||||||||||||||||||||||||||||||||||||||||||||||||||||||||||||||||||||||||||||||||||||||||||||||||||||||||||||||||||||||||||||||||||||||||||||||||||||||||||||||||||||||||||||||||||||||||||||||||||||||||||||||||||||||||||||||||||||||||||||||||||||||||||||||||||||||||||||||||||||||||||||||||||||||||||||||||||||||||||||||||||||||||||||||||||||||||||||||||||||||||||||||||||||||||||||||||||||||||||||||||||||||||||||||||||||||||||||||||||||||||||||||||||||||||||||||||||||||||||||||||||||||||||||||||||||||||||||||||||||||||||||||||||||||||||||||||||||||||||||||||||||||||||||||||||||||||||||||||||||||||||||||||||||||||||||||||||||||||||||||||||||||||||||||||||||||||||||||||||||||||||||||||||||||||||||||||||||||||||||||||||||||


|
USD/JPY = 119.50 è USD is the
Base currency / JPY is the Quote currency è 1 UDS =
119.5 JPY ·
This is an indirect quote |
This is
referred to as a currency pair.
The currency to the left of the slash is the base currency, while the currency
on the right is called the quote or counter currency. The
base currency (in this case, the U.S. dollar) is always equal to one unit (in
this case, US$1), and the quoted currency (in this case, the Japanese yen) is
what that one base unit is equivalent to in the other currency. The quote
means that US$1 = 119.50 Japanese yen. In other words, US$1 can buy 119.50
Japanese yen. The forex quote includes the currency abbreviations for the
currencies in question.
Direct
Currency Quote vs. Indirect Currency Quote
There are two
ways to quote a currency pair, either directly or indirectly. A direct currency quote is simply a currency pair in which
the domestic currency is the
quoted currency; while an
indirect quote, is a currency pair where the domestic currency is the base currency. So if you were looking at
the Canadian dollar as the domestic currency and U.S. dollar as the foreign
currency, a direct quote would be USD/CAD, while an indirect quote would be
CAD/USD. The direct quote varies the domestic currency, and the base, or
foreign currency, remains fixed at one unit. In the indirect quote, on the
other hand, the foreign currency is variable and the
domestic currency is fixed at one unit.
·
Direct currency quote:
foreign currency / domestic currency, such as JPY / USD (one JPY for
how many USD)
·
Indirect currency quote: domestic currency / foreign currency,
such as USD/JPY (one USD for how many JPY)
For example,
if Canada is the domestic currency, a direct quote would be 1.18
USD/CAD and means that USD$1 will purchase C$1.18 . The indirect quote
for this would be the inverse (1/1.18), 0.85 CAD/USD, which means with C$1,
you can purchase US$0.85.
In
the forex spot market, most currencies are traded against the U.S.
dollar, and the U.S. dollar is frequently the base currency in the currency
pair. In these cases, it is called a direct quote. This would apply to the
above USD/JPY currency pair, which indicates that US$1 is equal to 119.50
Japanese yen.
However, not
all currencies have the U.S. dollar as the base. The Queen's currencies -
those currencies that historically have had a tie with Britain, such as
the British pound, Australian Dollar and New Zealand dollar - are
all quoted as the base currency against the U.S. dollar. The euro is quoted
the same way as well. In these cases, the U.S. dollar is the counter
currency, and the exchange rate is referred to as an indirect quote. This is
why the EUR/USD quote is given as 1.25, for example, because it means that
one euro is the equivalent of 1.25 U.S. dollars.
Most currency
exchange rates are quoted out to four digits after the decimal place,
with the exception of the Japanese yen (JPY), which is quoted out to two
decimal places.
Cross Currency
( You can find the cross
exchange rates at www.forex.com
When a currency quote is given without the U.S. dollar as one of its components,
this is called a cross currency. The most common cross
currency pairs are the EUR/GBP, EUR/CHF and EUR/JPY. These currency pairs
expand the trading possibilities in the forex market, but it is important to
note that they do not have as much of a following (for example, not as
actively traded) as pairs that include the U.S. dollar, which also are called
the majors. (For more on cross currency, see Make The Currency Cross Your Boss.)
(https://www.investopedia.com/university/forexmarket/forex2.asp)
Summary:
USD / JPY
= 119.50 è 1 US$ = 119.5 YEN, to US residents this is an indirect quote; to a Japanese, it is a direct quote.
Base / quote
JPY / USD
= 1/119.50 è 1 YEN = (1/119.5)$, to US residents this is a direct quote; to a Japanese, it is a indirect quote.
Base / quote
Direct quote
= 1/(indirect quote) or indirect quote = 1/ (direct quote) *** Inverse relationship
Part IV: what is BID and ASK price on
Forex
Forex: Bid and Ask (video)
Bid and Ask
As with most trading in the financial markets, when you are trading a
currency pair there is a bid price (buy) and an ask price (sell).
Again, these are in relation to the base currency. When buying a currency pair (going long), the
ask price refers to the amount of quoted currency that has to be paid
in order to buy one unit of the base
currency, or how much the market will sell one unit of the base
currency for in relation to the quoted currency.
The bid price is used when
selling a currency pair (going short) and reflects how much of the
quoted currency will be obtained when selling one unit of the base currency,
or how much the market will pay for the quoted currency in relation to the
base currency.
The quote before the slash is the bid price, and the two
digits after the slash represent the ask price (only the last two digits of
the full price are typically quoted). Note that the bid price is always
smaller than the ask price. Let's look at an example:
|
USD/CAD = 1.2000/05 |
If you want to
buy this currency pair, this means that you intend to buy the base currency
and are therefore looking at the ask price to see how much (in Canadian
dollars) the market will charge for U.S. dollars. According to the ask price,
you can buy one U.S. dollar with 1.2005 Canadian dollars.
However, in
order to sell this currency pair, or sell the base currency in exchange for
the quoted currency, you would look at the bid price. It tells you that the
market will buy US$1 base currency (you will be selling the market the base
currency) for a price equivalent to 1.2000 Canadian dollars, which is the
quoted currency.
Whichever
currency is quoted first (the base currency) is always the one in which the
transaction is being conducted. You either buy or sell the base currency.
Depending on what currency you want to use to buy or sell the base with, you
refer to the corresponding currency pair spot exchange rate to determine the
price.
(https://www.investopedia.com/university/forexmarket/forex2.asp)
Exercise I:
Assume you have
$1000 and bid rate is $1.52/£ and ask rate is $1.60 /£.
GBP/USD = 1.5200/1.6000
Meanwhile, the bid rate is quoted as 0.625 £/$ and the ask rate
is quoted as 0.6579 £/$.
USD/GBP = 0.6250 /0.6579
If you convert it to £ and then convert it back to $, what will
happen?
Answer:
Sell at bid and buy at ask price (ask is always higher than
bid so you buy high and sell low, since you are dealing with the bank).
You
can either buy and sell dollar:
with
$1000, you sell at bid 0.625 £/$ so you get 625£
($1000* 0.625 £/$ =
625£). With 625£, you sell at bid $1.52/£, so you get $950 (625£ * $1.52/£ =
$950)
Exercise II: you
Suppose the spot ask exchange rate is $1.90 = £1.00
and the spot bid exchange rate is $1.89 = £1.00. If you were to buy
$1,000,000 worth of £ and then sell them 10 minutes later, how much of your
$1,000,000 would be lost by the bid-ask spread? (Hint: You buy at ask and
sell at bid)
Answer:
 GBP
at $1.60 /£ and buy $ at 0.6579 £/$. So $1000 / 1.6
$/£ * 0.6579 £/$ = $950
GBP
at $1.60 /£ and buy $ at 0.6579 £/$. So $1000 / 1.6
$/£ * 0.6579 £/$ = $950
Exercise III: The dollar-euro exchange rate is $1.25 =
€1.00 and the dollar-yen exchange rate is ¥100 =
$1.00. What is the euro-yen cross rate? (answer: ¥125 = €1.00)
Exercise IV: The AUD/$ spot exchange rate is AUD1.60/$
and the SF/$ is SF1.25/$. The AUD/SF
cross exchange rate is: (answer: 1.2800)

Part V: LIBOR, Eurodollar, Eurobond
What is US dollar LIBOR? (What is LIBOR? Video, and other video (Libor, khan academy)
The London Interbank Offered Rate (LIBOR) is an
interest rate based on the average interest rates at which a large number of international
banks in London lend money to one another. The official LIBOR rates are
calculated on a daily basis and made public at 11:00 (London Time) by the ICE
Benchmark Administration (IBA). We publish the LIBOR rates on this website
with a delay (we are not allowed to publish realtime LIBOR rates).
The daily reported interest rates are the mean
of the middle values. The rates are a benchmark rather than a tradable rate,
the actual rate at which banks will lend to one another continues to vary
throughout the day. The LIBOR rates come in different maturities (overnight,
1 week and 1, 2, 3, 6, and 12 months) and different currencies (the euro, US
dollar, British pound sterling, Japanese yen and Swiss franc).
In the past, the BBA published LIBOR rates for
5 more currencies (Swedish krona, Danish krone, Canadian dollar, Australian
dollar and New Zealand dollar) and 8 more maturities (2 weeks, 4, 5, 7, 8, 9,
10 and 11 months).
On this page we show the US dollar LIBOR rates. The US dollar LIBOR rates
can be considered as the interbank cost of borrowing funds in US dollars.
The LIBOR interest rates are being used as a
reference rate for a lot of financial products, for example derivatives like
swaps. A lot of banks use the LIBOR interest rates also to determine their
rates on products like mortgages, savings accounts and loans.
![]() Current US dollar LIBOR
interest rates:
Current US dollar LIBOR
interest rates:
In the following table we show the current US dollar
LIBOR interest rates (not realtime, daily updated).
|
US dollar LIBOR |
01-24-2020 |
01-23-2020 |
01-22-2020 |
01-21-2020 |
01-20-2020 |
|
1.53188 % |
1.53163 % |
1.53263 % |
1.53925 % |
- |
|
|
1.56175 % |
1.56088 % |
1.55325 % |
1.55238 % |
1.56225 % |
|
|
- |
- |
- |
- |
- |
|
|
1.65950 % |
1.66088 % |
1.65938 % |
1.65950 % |
1.65338 % |
|
|
1.78038 % |
1.76575 % |
1.76988 % |
1.78250 % |
1.78638 % |
|
|
1.79538 % |
1.79413 % |
1.80088 % |
1.80625 % |
1.80213 % |
|
|
- |
- |
- |
- |
- |
|
|
- |
- |
- |
- |
- |
|
|
1.80525 % |
1.82175 % |
1.82463 % |
1.83438 % |
1.82950 % |
|
|
- |
- |
- |
- |
- |
|
|
- |
- |
- |
- |
- |
|
|
- |
- |
- |
- |
- |
|
|
- |
- |
- |
- |
- |
|
|
- |
- |
- |
- |
- |
|
|
1.87988 % |
1.89450 % |
1.91900 % |
1.91838 % |
1.92463 % |
The London Interbank Offered Rate is the average interest rate at which leading banks borrow funds from other banks in the London market. LIBOR is the most widely used global "benchmark" or reference rate for short term interest rates.


Eurodollar
-- Eurodollar explained (video)
The term
eurodollar refers to U.S. dollar-denominated deposits at foreign banks or at
the overseas branches of American banks. By being located outside the United States,
eurodollars escape regulation by the Federal Reserve Board, including
reserve requirements. Dollar-denominated deposits not subject to U.S. banking
regulations were originally held almost exclusively in Europe, hence the name
eurodollar. They are also widely held in branches located in the Bahamas and
the Cayman Islands.
(https://www.investopedia.com/terms/e/eurodollar.asp)
For discussion:
· Between LIBOR USD rate and US interest rate for similar terms, there should not be any discrepancies. Right?
What is a Eurobond What is EUROBOND? What does EUOBOND mean? (video)
A eurobond is denominated in a currency other than the home
currency of the country or market in which it is issued. These bonds are
frequently grouped together by the currency in which they are denominated,
such as eurodollar or euroyen bonds. Issuance is usually handled by an
international syndicate of
financial institutions on behalf of the borrower, one of which may underwrite
the bond, thus guaranteeing purchase of the entire issue. https://www.investopedia.com/terms/e/eurobond.asp
HOMEWORK II (CHAPTER 3) (Due with first
mid term exam)
1. Bid/Ask Spread
Compute the bid/ask percentage spread for
Mexican peso retail transactions in which the ask rate is $.11 and the bid
rate is $.10. HINT: BID ASK SPREAD = (ASK-BID)/ASK (Answer:
9.09%)
2. Indirect Exchange Rate
If the direct exchange rate of the euro is
worth $1.25, what is the indirect rate of the euro? That is, what is the
value of a dollar in euros? (Answer:
0.8€)
3. Cross Exchange Rate
Assume Poland currency (the zloty) is worth
$.17 and the Japanese yen is worth $.008. What is the cross rate of the zloty
with respect to yen? That is, how many yen equal a zloty? (Answer:
21.25¥)
4. Foreign Exchange
You just came back from Canada, where the
Canadian dollar was worth $.70.
You still have C$200 from your trip and could
exchange them for dollars at the airport, but the airport foreign exchange
desk will only buy them for $.60. Next week, you will be going to Mexico and
will need pesos. The airport foreign exchange desk will sell you pesos for
$.10 per peso. You met a tourist at the airport who is from Mexico and is on
his way to Canada. He is willing to buy your C$200 for 1,300 pesos. Should
you accept the offer or cash the Canadian dollars in at the airport?
Explain. (Answer: You can only get $1,200 peso if you accept the
offer in the airport)
New
York stretches lead over London as the world’s top financial center, survey
shows
PUBLISHED
THU, SEP 19 20199:11 AM EDTUPDATED THU, SEP 19 201910:25 AM EDT
David
Reid@DAVYREID73
New
York has stretched its lead over London in the race to be the world’s top financial
center, according to a poll conducted by Z/Yen group and the China
Development Institute (CDI).
The Big
Apple scored 790 points to top the 26th edition of the Global Financial
Centres Index. The index studied 104 different cities.
New
York increased its lead over London to 17 points, with the home of Wall
Street considered top in all 5 factors measured: Business Environment, Human
Capital, Infrastructure, Financial Sector, Development, and Reputation.
The
U.K. capital only just retained second in the ranking as Brexit continued to
diminish its standing. London with a score of 773 only just edged out Hong
Kong in third place with a score of 771.
Professor
Michael Mainelli, executive chairman of Z/Yen, said competition at the top of
the index is intensifying and London could soon be surpassed by more than one
city.
“London
is in a ‘slipping second’ position globally and a ‘slipping first’ in Europe
amidst high volatility emanating from policy uncertainties, Brexit, trade
wars, and geopolitical unrest. Asian centres and a resurging Paris are
fighting for that second-place spot,” he said in a press release Thursday.
Singapore
and Shanghai remain in fourth and fifth position respectively and seven of
the top ten places in the index are now taken by Asia/Pacific locations.
A new
separate index was included for the first time, measuring the top locations
for FinTech firms. Chinese centers occupy five of the top seven places in
that index, led by Beijing and Shanghai. New York, London, Singapore, San
Francisco, and Chicago also feature in the top ten for FinTech.
Results
to both surveys were collated via an online questionnaire during the 24
months to June 2019. The survey collectors said 3,360 respondents gave valid
answers during this time.
London
retains global finance throne amid Brexit chaos
Andrew
MacAskill, Sinead Cruise, Huw Jones, Oct, 2019
LONDON (Reuters) - From the pinnacle of the
City of London’s largest skyscraper, Stuart Lipton is wagering a $1.2 billion
bet that the British capital remains a master of the international financial
universe no matter what happens with Brexit.
The
76-year-old property developer is not alone. Bankrolled by a host of global
investors, including France’s Axa (AXAF.PA), his big-ticket gamble in London’s
financial district is - so far - on the money.
The
cataclysmic warnings during the 2016 referendum that London would lose its
financial throne if it voted to leave the European Union (EU) have, so far,
been proven wrong. London is still the world’s banker, only bigger by some
measures.
“London
is extraordinarily resilient and its future as a finance centre is secure
because what we have here is unique,” Lipton told Reuters on the 61st floor
of 22 Bishopsgate, set to become western Europe’s second tallest skyscraper
when it opens next year.
In the
year to June, London has attracted more cross border commercial real estate
investment than any other city. It has overtaken New York as destination for
fintech investment and it has increased its dominance of the world’s $6.6
trillion daily foreign exchange market.
Since
the vote to leave the EU, Britain has leapfrogged the United States to become
the largest centre for trading interest rate swaps, despite calls by
ex-French President Francois Hollande to end London’s dominance in clearing
euro-denominated derivatives.
That
London has expanded its influence as an international finance centre is one
of the biggest riddles of the United Kingdom’s tortuous three year Brexit
crisis.
The
city’s standing ensures the United Kingdom keeps one of its last big chips at
the top table of world politics just as it splits from the EU.
It also
means EU companies will still come to London to raise finance outside the
bloc after Brexit, a fact not lost on Wall Street heavyweights such as
Goldman Sachs (GS.N) and JP Morgan (JPM.N).
Just a
mile away from 22 Bishopsgate, Goldman opened its new 1 million square foot
European headquarters - complete with mothers’ rooms and wildflowers on the
roof - in July, three years on from the 2016 referendum.
Largely
abandoned by the British government during Brexit talks, ten senior industry
officials told Reuters London’s financial services sector has grown since
2016 because there is no realistic competitor in its time zone.
And
high-rolling bankers are too attached to its Anglo-Saxon, work-hard,
play-hard culture.
The
chief executive of the British division of one of Europe’s largest banks said
although some business will move to the EU, most senior bankers will be
reluctant to leave London. He would consider taking a 20% pay cut to remain
in the city.
“If you
are an Italian banker, who moved out to London 20 years ago, and your kids go
to a private school around the corner then you are not going to move to
Frankfurt.” He said.
The
2016 referendum shocked many of the masters of London’s financial universe,
triggering the biggest one-day fall of the pound since the era of
free-floating exchange rates was introduced in the early 1970s.
But so
far, most major financial institutions have opted against moving large
numbers of people and activities until the loss of access to the EU’s
lucrative single market is confirmed.
Banks,
insurers and asset managers have shifted over a trillion euros of assets such
as derivatives and bonds from London to the continent and opened new EU hubs
as a hedge against London suddenly being cut off from the bloc if Britain
exits the EU without a formal agreement.
The
Bank of England estimates around 4,000 people may have moved by the time
Britain has exited the EU. But the key decisions are still taken in London.
Reuters
contacted JP Morgan and Goldman, and rivals Citi (C.N), Bank of America
(BAC.N), UBS (UBSG.S), Morgan Stanley (MS.N), Credit Suisse (CSGN.S) and
Deutsche Bank (DBKGn.DE), to seek details on how a ‘no deal Brexit’ might
accelerate the transfer of resources and activities from London.
All
banks said they were prepared for a no-deal Brexit, and had been since the
first quarter.
BUSINESS NEWSOCTOBER 8, 2019 / 2:04 AM / 4 MONTHS AGO
The end of Libor:
the biggest banking challenge you've never heard of
Sinead Cruise, Lawrence White
LONDON (Reuters) - On June 30, British bank NatWest (RBS.L) sent
out an arcane-sounding press release - bus operator National Express (NEX.L)
had become the first company to take out a loan based on Sonia, a replacement
for scandal-hit interest rate benchmark Libor.
FILE PHOTO: British five pound banknotes are seen in this
picture illustration taken November 14, 2017. REUTERS/Benoit
Tessier/Illustration/File Photo
It was billed as the first switch of thousands that British
firms would make by end-2021, when the benchmark is set to be decommissioned.
Four months on, NatWest’s trailblazing
Sonia switch has been followed by only one other loan, when the bank struck a
deal with utility South West Water on Oct. 2.
The slow progress highlights the challenge banks and borrowers
face as regulators attempt to end the use of Libor, a benchmark embedded in
as much as $340 trillion financial contracts worldwide from home loans to complicated
derivatives.
Libor, once dubbed the world’s most
important number, was discredited after the 2008 financial crisis when
authorities in the United States and Britain found traders had manipulated it
to make a profit.
But replacing Libor is proving expensive and tricky with
concerns that, if mishandled, it could trigger credit market confusion and
waves of lawsuits, finance industry sources said.
RELATED COVERAGE
Factbox: The global benchmarks replacing Libor
With no obvious alternative, some countries are adopting their
own benchmarks. The United States is leading the way with a booming trade in
derivatives linked to its new Sofr rate, while the European Central Bank
started publishing Estr, its new interest rate benchmark, earlier this month.
In Britain, professional investors such as hedge funds and
pension insurance clients are also already writing and trading derivatives
contracts linked to Sonia. But companies which make up the so-called Libor “cash” market of
sterling-denominated loans are dragging their feet or are even not aware of
the shift.
At least two banks in Britain have shifted staff from teams
preparing for Brexit to specialist Libor taskforces in the past quarter as
the issue becomes more pressing, industry sources said.
“Part of the market is very
educated and smart on this and part of the market is not even aware that
Libor is going,” said Phil Lloyd, head of market
structure & regulatory customer engagement at NatWest Markets.
Lloyd said banks like NatWest are battling to allay concerns
among corporate borrowers that the Sonia benchmark will make it harder for
them to know how much interest they owe because the rate is backward looking.
Sonia, the sterling overnight index average, is based on the
average of interest rates banks pay to borrow sterling from one another
outside market hours, and is published at 9:00 a.m. local time (0800 GMT)
daily, after the transactions have been vetted by the Bank of England.
Borrowers taking out Sonia loans will in effect not know exactly
how much interest they owe until they are required to pay.
In contrast, loans linked to Libor can have forward-looking term
rates, meaning borrowers have greater certainty over their future liabilities
and can manage cash flows more easily.
Bankers and consultants said the market was exploring a
forward-looking Sonia term rate by mid-2020 to appease borrowers but not
everyone is in favor.
The overnight Sonia rate, based on actual transactions, is seen
as more robust and less vulnerable to the kind of manipulation that affected
Libor, which was based on rates submitted by banks.
The Libor rigging scandal saw billions of dollars in fines
levied on major banks and jail sentences for traders convicted of
manipulating the benchmark for profit.
Some banks and lawyers fear the creation of a Sonia term rate,
which would likely be based on forward-looking estimates from banks as
opposed to past transactions, could undermine the security of the benchmark
and even spawn legal dangers for banks.
Murray Longton, a consultant at Capco who advises financial
firms on Libor transition, said banks were fearful of lawsuits, as the
proliferation of alternative Sonia term rates offered by different lenders
could spark allegations of mis-selling.
“If
you get this wrong, this is PPI for investment banking- if you haven’t communicated properly and you move a customer (on to
Sonia) and benefit, there could be a case where this gets reviewed and you
owe your client a lot,” he said.
The Payment Protection Insurance (PPI) mis-selling scandal in
Britain has cost banks more than 43 billion pounds in compensation after the
contracts were retrospectively deemed to have been mis-sold.
“A lot of the corporate market
are waiting for a few things of which one is a term rate. And if they never
get a term rate, then waiting will lead to them still executing Libor, and
not being ready for Sonia. The clock is ticking,”
Lloyd said.
“And the other point about
having a term rate is you’re starting to get back
into a world where you are really recreating a new version of Libor.”
COSTS AND CONSEQUENCES
But the reluctance of corporate borrowers to buy into Sonia is
not the only reason for the slow progress.
Banks face large costs for adapting systems and educating
thousands of relationship managers on the merits of Sonia over Libor.
Fourteen of the world’s top banks expect
to spend more than $1.2 billion on the Libor transition, data from Oliver
Wyman show, with the costs for the finance industry as a whole set to be
several multiples of that sum.
Much of this cost is linked to the arduous task of changing the
terms of contracts tied to Libor whose duration extend beyond the 2021
deadline. Progress has been held up not only by nervous borrowers but also by
banks in loan syndicates which may not always agree on the new wording
required to adapt existing loan agreements to the new benchmark.
“You need unanimous agreement
to change the baseline product, so what are the chances if you’ve got 10-15 participants (in a syndicate) that they will
all agree on the same thing?,” Capco’s
Longton said.
Some corporate borrowers are also playing a wait-and-see game to
see whether they can benefit financially from Libor’s
slow death spiral. But this could have costly consequences, depending on the
so-called “fallback” language
in contracts for their existing loans.
These fallbacks - originally designed to kick in if Libor was
temporarily unavailable - usually stipulate alternative rates, such as
calling other banks for a quote or using the last published Libor rate. But
the fallback clauses were not designed to cope with Libor ceasing to exist
indefinitely.
That could create big risks for borrowers, for example, by
potentially converting a “floating rate” loan, tied to the fluctuations of Libor into a fixed-rate
one.
Serge Gwynne, a partner at consultant Oliver Wyman, said
regulators could do more to help banks manage the transition away from Libor,
starting with much harder deadlines on when it would formally cease to exist.
“Libor
is embedded everywhere in the plumbing of the financial world, that’s why this is such a big challenge,”
said Longton.
“You are changing a product
that has been used to create markets for a long time. You are not just taking
one thing out and putting one thing in but changing the whole dynamic of how this
works.”
Chapter 4 Exchange Rate Determination
Part I:
What determines the strength of a currency?
Currency value is determined by demand and supply, if not
under control by the government.
What Determines The Strength Of A
Currency?
Q: What factors
determine the strength of a currency?
A: Currency
trading is complicated by the fact that there are so many factors involved.
Not only are there a number of country-specific variables that go into
determining a currency's strength, but there are also other benchmarks--other
currencies, for example, as well as commodities--against which a currency's
strength can be measured.
However, three
crucial factors are as follows:
1.
Interest rates. High
interest rates help promote a strong currency, because foreign investors can
get a higher return by investing in that country. However, the level of
interest rates is relative. You've probably noticed that interest rates on
CDs, savings accounts and money market accounts are
very low right now. So are U.S. Treasury bond rates and the U.S. federal funds rate. Ordinarily,
this would weaken the U.S. dollar, except for the fact that interest rates
behind other major world currencies are also low.
3.
Stability. A
strong government with a well-established rule of law and a history of
constructive economic policies are the type of things that attract investment
and thus promote a strong currency. In the case of the U.S. dollar, its
strength is further augmented by the fact that commodities are generally
traded in dollars, and many countries use the dollar as a reserve currency.
Speaking
of stability, that is probably what governments seek for their currencies,
more so than strength. A strong currency makes a country's exports more
expensive, hurting that nation's trade competitiveness. On the other hand, a
weak currency makes imports more expensive, boosting domestic inflation. So
the ideal course is to aim down the middle and avoid destabilizing
fluctuations.
Think about the changes in demand and supply
when the following changes occur.
· Inflation goes up (or
down)
· Real interest rate
goes up (or down)
· Domestic residents’
income goes up (or down)
· Current account goes
up (or down)
· Public debt goes up
(or down)
· Recession or crisis
· Other accidental events
· Anything else? Your
observation? Your experience?
http://www.investopedia.com/video/play/main-factors-influence-exchange-rates/ (VIDEO)
*********************
For the each of the scenarios above, can you draw the demand and supply curve?**********************
*************If
not yet, please watch the following video. **************
Supply and demand curves in foreign exchange by
Khan Academy (video)
Please also read the following article to
learn more about how changes in demand and supply work on exchange rate.
The foreign exchange market involves firms, households, and
investors who demand and supply currencies coming together through their
banks and the key foreign exchange dealers. Figure 1 (a) offers an example
for the exchange rate between the U.S. dollar and the Mexican peso. The
vertical axis shows the exchange rate for U.S. dollars, which in this case is
measured in pesos. The horizontal axis shows the quantity of U.S. dollars
being traded in the foreign exchange market each day. The demand curve (D)
for U.S. dollars intersects with the supply curve (S) of U.S. dollars at the
equilibrium point (E), which is an exchange rate of 10 pesos per dollar and a
total volume of $8.5 billion.
 Figure 1. Demand and Supply for the U.S. Dollar and Mexican Peso
Exchange Rate. (a) The quantity measured on the horizontal axis is in U.S.
dollars, and the exchange rate on the vertical axis is the price of U.S.
dollars measured in Mexican pesos. (b) The quantity measured on the
horizontal axis is in Mexican pesos, while the price on the vertical axis is
the price of pesos measured in U.S. dollars. In both graphs, the equilibrium
exchange rate occurs at point E, at the intersection of the demand curve (D)
and the supply curve (S).
Figure 1. Demand and Supply for the U.S. Dollar and Mexican Peso
Exchange Rate. (a) The quantity measured on the horizontal axis is in U.S.
dollars, and the exchange rate on the vertical axis is the price of U.S.
dollars measured in Mexican pesos. (b) The quantity measured on the
horizontal axis is in Mexican pesos, while the price on the vertical axis is
the price of pesos measured in U.S. dollars. In both graphs, the equilibrium
exchange rate occurs at point E, at the intersection of the demand curve (D)
and the supply curve (S).
Figure 1 (b)
presents the same demand and supply information from the perspective of the
Mexican peso. The vertical axis shows the exchange rate for Mexican pesos,
which is measured in U.S. dollars. The horizontal axis shows the quantity of
Mexican pesos traded in the foreign exchange market. The demand curve (D) for
Mexican pesos intersects with the supply
curve (S) of Mexican pesos at the equilibrium point (E),
which is an exchange rate of 10 cents in U.S. currency for each Mexican peso
and a total volume of 85 billion pesos. Note that the two exchange rates are
inverses: 10 pesos per dollar is the same as 10 cents per peso (or $0.10 per
peso). In the actual foreign exchange market, almost all of the trading for
Mexican pesos is done for U.S. dollars. What factors would cause the demand
or supply to shift, thus leading to a change in the equilibrium exchange rate?
The answer to this question is discussed in the following section.
Expectations
about Future Exchange Rates
One reason to demand a
currency on the foreign exchange market is the belief that the value of the
currency is about to increase. One reason to supply a currency—that is, sell it on the foreign exchange market—is the expectation that the value of the currency is about
to decline. For example, imagine that a leading business newspaper, like the Wall Street Journal or
the Financial Times,
runs an article predicting that the Mexican peso will appreciate in value.
The likely effects of such an article are illustrated in Figure 2. Demand for the Mexican peso
shifts to the right, from D0 to
D1, as investors
become eager to purchase pesos. Conversely, the supply of pesos shifts to the
left, from S0 to
S1, because
investors will be less willing to give them up. The result is that the
equilibrium exchange rate rises from 10 cents/peso to 12 cents/peso and the
equilibrium exchange rate rises from 85 billion to 90 billion pesos as the
equilibrium moves from E0 to
E1.

Figure 2. Exchange Rate Market for Mexican Peso Reacts to
Expectations about Future Exchange Rates. An announcement that the peso
exchange rate is likely to strengthen in the future will lead to greater
demand for the peso in the present from investors who wish to benefit from
the appreciation. Similarly, it will make investors less likely to supply
pesos to the foreign exchange market. Both the shift of demand to the right
and the shift of supply to the left cause an immediate appreciation in the
exchange rate.
Figure 2 also
illustrates some peculiar traits of supply and demand diagrams in the foreign
exchange market. In contrast to all the other cases of supply and demand you
have considered, in the foreign
exchange market, supply and demand typically both move at the
same time. Groups of participants in the foreign exchange market like firms
and investors include some who are buyers and some who are sellers. An
expectation of a future shift in the exchange rate affects both buyers and
sellers—that is, it affects both demand and supply
for a currency.
The shifts in demand and
supply curves both cause the exchange rate to shift in the same direction; in
this example, they both make the peso exchange rate stronger. However, the
shifts in demand and supply work in opposing directions on the quantity
traded. In this example, the rising demand for pesos is causing the quantity
to rise while the falling supply of pesos is causing quantity to fall. In
this specific example, the result is a higher quantity. But in other cases,
the result could be that quantity remains unchanged or declines.
This example also helps to
explain why exchange rates often move quite substantially in a short period
of a few weeks or months. When investors expect a country’s
currency to strengthen in the future, they buy the currency and cause it to
appreciate immediately. The appreciation of the currency can lead other
investors to believe that future appreciation is likely—and
thus lead to even further appreciation. Similarly, a fear that a currency might weaken quickly
leads to an actual weakening
of the currency, which often reinforces the belief that the currency is going
to weaken further. Thus, beliefs about the future path of exchange rates can
be self-reinforcing, at least for a time, and a large share of the trading in
foreign exchange markets involves dealers trying to outguess each other on
what direction exchange rates will move next.
Part II: Fixed exchange
rate vs. floating exchange rate
What is a {term}? Trilemma
The impossible trinity, also called the Mundell-Fleming
trilemma or simply the trilemma, expresses the limited options available to
countries in setting monetary policy. According to this theory, a country cannot achieve the free flow of
capital, a fixed exchange rate and
independent monetary policy simultaneously. By pursuing any two of these
options, it necessarily closes off the third.
BREAKING DOWN Trilemma
The theory of the policy trilemma is frequently credited
to the economists Robert Mundell and
Marcus Fleming, who independently described the relationships among exchange
rates, capital flows and monetary policy in the 1960s. Maurice Obstfeld, who
became chief economist at the IMF in
2015, presented the model they developed as a "trilemma" in a 1997
pape. According to the trilemma model, a country has three options. It can
A - set a fixed exchange rate between
its currency and another while allowing capital to flow freely
across its borders,
B - allow capital to flow freely and set its own monetary
policy, or
C - set its own monetary policy and maintain a fixed exchange
rate.

The
Impossible Trinity - 60 Second Adventures in Economics (5/6) (video)
Why Hong Kong pegs
its currency to the US dollar (video)
Currency
pegs (video)
Using
reserves to stabilize currency | Khan Academy (optional)
Speculative
attack on a currency | Khan Academy (optional)
Argentina
imposes currency controls to stem sharp drop in peso (video)
The country cannot, however, fix exchange rates, allow
capital to flow freely and
maintain monetary policy sovereignty. For example, Country X links its currency, the X pound, to the
Y franc at a one-to-one ratio. This is effective if both Country X and
Country Y's central banks maintain a policy rate of 3%. But if Country Y
raises interest rates to combat rising inflation, investors would
spot an opportunity for arbitrage. X pounds would flood over the border
to buy Y francs and earn the higher interest rate.
Y francs would in effect
become worth more than X pounds. Thus, either Country X abandons the currency
peg and allows the X pound to fall, raises its policy rate to match Country
Y's policy rate abandoning monetary policy independence or it sets
up capital controls to keep X pounds in the country.
Real-world examples of these
trade-offs include the eurozone where countries have opted for side A of
the triangle: they forfeit monetary policy control to the European
Central Bank but maintain a single currency (in effect a one-to-one peg coupled with free capital flow).
The difficulties of maintaining a monetary union across economies as
different as Germany and Greece have become clear as the latter has
repeatedly appeared poised to drop out of the currency bloc.
Following World War II, the wealthy opted for side C under the Bretton Woods
system, which pegged currencies to the dollar but allowed them to set their
own interest rates. Cross-border capital flows were so small that the system
held for a couple of decades – the exception being
Mundell's native Canada, a situation that gave him special insight into
the tensions inherent in the system. Today,
most countries allow their currencies to float, meaning they opt for side B.
The French economist Hélène Rey has argued that the
trilemma is not as simple as it appears since most countries lack
monetary policy independence whether or not they have free exchange rates and
capital flows. The reason is the overwhelming influence of
the Federal Reserve.
(https://www.investopedia.com/terms/t/trilemma.asp)
For class discussion:
·
find your country’s exchange rate system from https://en.wikipedia.org/wiki/List_of_countries_by_exchange_rate_regime
·
Explain why or why not it is a right choice based on the
“impossible trinity”.
For
fixed exchange rate regime, the country has to give up free capital flow.
For
pure floating exchange rate regime, the country has to give up fixed exchange
rate.
For
counties in the euro zone, each country has to give up its monetary policy.
·
please refer to the following paper for classifications of
exchange rate regimes
Exchange Rate Regimes from http://www.imf.org/external/np/mfd/er/2004/eng/0604.htm (IMF,
fyi)
·
Do you think that investing in
foreign currency is a good idea? ----- very risky and unpredictable, but very
liquid. What else?
·
In your view, what is the best
currency to trade this year? Why? Do you like the following recommendations?
Analysis of the Best
Currency Pairs to Trade
·
USD/EUR – This can be
considered the most popular currency pair. In addition, it has the lowest
spread among modern world Forex brokers. This currency pair is associated
with basic technical analysis. The best thing
about this currency pair is that it is not too volatile. If you are not in a position
to take any risks, you can think of selecting this as your best Forex pair to
trade, without it causing you too much doubt in your mind. You can also find
a lot of information on this currency pair, which can help prevent you from
making rookie mistakes.
·
USD/GBP – Profitable pips and possible large jumps
have contributed a lot towards the popularity of this currency pair. However,
you need to keep in mind that higher profits come along with a greater risk.
This is a currency pair that can be grouped into the volatile currencycategory. However,
many traders prefer to select this as their best currency pair to trade,
since they are able to find plenty of market analysis information
online.
·
USD/JPY – This is another
popular currency pair that can be seen regularly in the world of Forex
trading. It is associated with low spreads, and you can usually
follow a smooth trend in comparison with other currency pairs. It also has
the potential to deliver exciting, profitable opportunities for traders.
Special Pairs (Or Exotic
Currency Pairs)
Typically the
best pair for you is the one that you are most knowledgeable about. It can be
extremely useful for you to trade the currency from your own country, if it
is not included in the majors, of course. This is only true if your local
currency has some nice volatility too. In general, knowing your country's
political and economical issues results in additional knowledge which you can
base your trades on.
You can find
such information through economic announcements in our Forex calendar, which also lists
predictions and forecasts concerning these announcements. It is also
recommended to consider trading the pairs that contain your local currency
(also known as 'exotic pairs'). In most cases, your local currency pair will
be quoted against USD, so you would need to stay informed about this currency
as well.
·
·
From https://admiralmarkets.com/education/articles/forex-basics/what-are-the-best-currency-pairs-to-trade
Class Exercise1: Chicago bank expects the exchange rate of the NZ$ to appreciate
from $0.50 to $0.52 in 30 days.
— Chicago bank can borrow $20m on a short term basis.
— Currency Lending
Rate Borrowing
rate
$ 6.72% 7.20%
NZ$
6.48% 6.96%
Question: If Chicago bank anticipate NZ$ to
appreciate, how shall it trade? (refer to ppt)
Answer:
◦ NZ$
will appreciate, so you should buy NZ$ now and sell later. Borrow $à convert to NZ$
today à lend
it for 30 days à convert
to $ 30 days later àpayback
the $ loan.
◦ Convert
the borrowed $ to NZ$ today. So your NZ$ worth: $20m / 0.50 $/NZ$=40m NZ$.
◦ Lend
NZ$ for 6.48% * 30/360=0.54% and get
40m
NZ$ *(1+0.54%)=40,216,000 NZ$ 30 days lateè at new rate $0.52/1NZ$,
40,216,000 NZ$ equals t 40,216,000 NZ$*$0.52/1NZ$ = $20,912,320
◦ Your
borrowed $20m should be paid back for
20m
*(1+7.2%* 30/360)=$20.12m.
◦ So
the profit is:
$20,912,320 - $20.12m =$792,320, a pure profit from
thin air!

Class Exercise 2: Blue
Demon Bank expects that the Mexican peso
will depreciate against the dollar from its spot rate of $.15 to $.14 in 10
days. The following interbank lending and borrowing rates exist:
Lending Rate Borrowing Rate
U.S.
dollar 8.0% 8.3%
Mexican
peso 8.5% 8.7%
Assume
that Blue Demon Bank has a borrowing capacity of either $10 million or 70 million
pesos in the interbank market, depending on which currency it wants to
borrow.
a. How could Blue Demon Bank attempt to capitalize on its
expectations without using deposited funds? Estimate the profits that could
be generated from this strategy.
b. Assume all the preceding information with this exception:
Blue Demon Bank expects the peso to appreciate from its present spot rate of
$.15 to $.17 in 30 days. How could it attempt to capitalize on its
expectations without using deposited funds? Estimate the profits that could
be generated from this strategy.
Answer:
Part a: Blue
Demon Bank can capitalize on its expectations about pesos (MXP) as follows:
1. Borrow MXP70 million
2. Convert the MXP70 million
to dollars:
a. MXP70,000,000 × $.15 =
$10,500,000
3. Lend the dollars through
the interbank market at 8.0% annualized over a 10‑day period. The
amount accumulated in 10 days is:
a. $10,500,000 × [1 + (8% ×
10/360)] = $10,500,000 × [1.002222] = $10,523,333
4. Convert the Peso back to $
at $.14 / peso:
a.
$10,523,333
/ $.14 / MXP = MXP 75,166,664
5. Repay the peso loan. The
repayment amount on the peso loan is:
a. MXP70,000,000 × [1 + (8.7%
× 10/360)] = 70,000,000 × [1.002417]=MXP70,169,167
6. The arbitrage profit is:
a.
MXP
75,166,664 - MXP70,169,167 = MXP 4,997,497
7.
Convert back to at $0.14 / MXP
a.
We get back MXP 4,997,497 * $0.14 / MXP = $699,649.6 (solution)
Part b: Blue
Demon Bank can capitalize on its expectations as follows:
1.
Borrow
$10 million
2.
Convert
the $10 million to pesos (MXP):
a.
$10,000,000/$.15
= MXP66,666,667
3.
Lend
the pesos through the interbank market at 8.5% annualized over a 30‑day
period. The amount accumulated in 30 days
is:
a.
MXP66,666,667
× [1 + (8.5% × 30/360)] = 66,666,667 × [1.007083] = MXP67,138,889
4.
Repay
the dollar loan. The repayment amount on the dollar loan is:
a.
$10,000,000
× [1 + (8.3% × 30/360)] = $10,000,000 × [1.006917] = $10,069,170
5.
Convert
the pesos to dollars to repay the loan. The amount of dollars to be received in
30 days (based on the expected spot rate of $.17) is:
a.
MXP67,138,889
× $.17 = $11,413,611
HW 3 (chapter
4) (Due with first mid term)
Question 1. Choose
between increase / decrease.
US
Inflation goes up, $ will ________increase / decrease____________in value__.
US
Real interest rate goes up, $ will ________increase / decrease___________ in
value__.
US
Current account goes up, $ will ________increase / decrease________ in
value__.
US Recession
or crisis, $ will ________increase / decrease________ in value__.
For each scenario, please draw a demand
and supply curve to support your conclusion.
-
please refer to the PPT of this chapter for how to draw demand
and supply curver Chapter 4 PPT
Question
2: Suppose
you observe the following exchange rates: €1 = $.7; £1 = $1.40; and €2.20 =
£1.00. Starting with $1,000,000, how can you make money?(Answer: get £
first. Your profit is $100,000)
Question
3:
Assume
you have £1000 and bid rate is 1.60$/£ and ask rate is 1.66$/£. If you
convert it to £ and then convert it back to $, what will happen? (Answer:
$963.86 and lose $36.14. Sell low and buy high here. So sell £ at bid
and buy £ at ask )
Question
4:
Suppose
you start with $100 and buy stock for £50 when the exchange rate is £1 = $2.
One year later, the stock rises to £60. You are happy with your 20 percent
return on the stock, but when you sell the stock and exchange your £60 for
dollars, you find that the pound has fallen to £1 = $1.75. What is your
return to your initial investment of $100? (Answer: 5%)
Question
5:
Baylor Bank believes the New Zealand dollar will depreciate over the
next five days from $.52 to $.5. The following annual interest rates apply:
Currency Lending Rate Borrowing Rate
Dollars 5.50% 5.80%
New
Zealand dollar (NZ$) 4.80% 5.25%
Baylor
Bank has the capacity to borrow either NZ$11 million or $5 million. If Baylor
Bank’s forecast if correct, what will its dollar profit be from speculation
over the five‑day period (assuming it does not use any of its existing
consumer deposits to capitalize on its expectations)? (Answer: 0.44 million NZ$ profit) 5. The
profits are determined by estimating the dollars available after repaying the
loan:
$11,413,611
– $10,069,170 = $1,344,441
No legal
tender of their own
US dollar as legal tender
·
![]() Ecuador
Ecuador
·
![]() Palau
Palau
·
![]() Zimbabwe
Zimbabwe
Euro as
legal tender
·
![]() Andorra
Andorra
·
![]() Kosovo
Kosovo
·
![]() Monaco
Monaco
Australian dollar as legal tender
·
![]() Kiribati
Kiribati
·
![]() Nauru
Nauru
·
![]() Tuvalu
Tuvalu
Swiss franc as legal tender
Currency
board
US dollar as exchange rate anchor
·
![]() Saint Lucia (XCD)
Saint Lucia (XCD)
·
![]() Saint Vincent and the
Grenadines (XCD)
Saint Vincent and the
Grenadines (XCD)
Euro as exchange rate anchor
·
![]() Bosnia and
Herzegovina (BAM)
Bosnia and
Herzegovina (BAM)
Singapore dollar as exchange rate anchor
Conventional
peg
US dollar as exchange rate anchor
·
![]() The Bahamas (BSD)
The Bahamas (BSD)
·
![]() Saudi Arabia (SAR)
Saudi Arabia (SAR)
·
![]() Sint Maarten (ANG)
Sint Maarten (ANG)
·
![]() South Sudan (SSP)
South Sudan (SSP)
·
![]() Turkmenistan (TMT)
Turkmenistan (TMT)
Euro as exchange rate anchor
·
![]() Burkina Faso (XOF)
Burkina Faso (XOF)
·
![]() Cabo Verde (CVE)
Cabo Verde (CVE)
·
![]() Central African
Republic (XAF)
Central African
Republic (XAF)
·
![]() Côte d'Ivoire (XOF)
Côte d'Ivoire (XOF)
·
![]() Equatorial Guinea (XAF)
Equatorial Guinea (XAF)
·
![]() Guinea-Bissau (XOF)
Guinea-Bissau (XOF)
·
![]() Republic of Congo (XAF)
Republic of Congo (XAF)
Composite exchange rate anchor
Other currency as exchange rate anchor
Other[edit]
·
![]() Solomon Islands (SBD)
Solomon Islands (SBD)
Stabilized
arrangement
US dollar as exchange rate anchor
·
![]() Kazakhstan (KZT)
Kazakhstan (KZT)
Euro as exchange rate anchor
Composite exchange rate anchor
Monetary aggregate target
·
![]() Bangladesh (BDT)
Bangladesh (BDT)
·
![]() Democratic Republic
of the Congo (CDF)
Democratic Republic
of the Congo (CDF)
·
![]() Tajikistan (TJS)
Tajikistan (TJS)
Other
·
![]() Azerbaijan (AZN)
Azerbaijan (AZN)
Crawling
peg
US dollar as exchange rate anchor
Composite exchange rate anchor
Crawl-like
arrangement
US dollar as exchange rate anchor
Euro as exchange rate anchor
Monetary aggregate target
·
![]() Uzbekistan (UZS)
Uzbekistan (UZS)
Inflation-targeting framework
Other
·
![]() Switzerland (CHF)
Switzerland (CHF)
Pegged exchange rate within horizontal bands
Composite exchange rate anchor
Other managed arrangement
US dollar as exchange rate anchor
Composite exchange rate anchor
Monetary aggregate target
·
![]() The Gambia (GMD)
The Gambia (GMD)
Inflation-targeting framework
·
![]() Czech Republic (CZK)
Czech Republic (CZK)
Other[edit]
·
![]() Costa Rica (CRC)
Costa Rica (CRC)
·
![]() Kyrgyzstan (KGS)
Kyrgyzstan (KGS)
·
![]() Mauritania (MRO)
Mauritania (MRO)
Floating
Monetary aggregate target
·
![]() Afghanistan (AFN)
Afghanistan (AFN)
·
![]() Madagascar (MGA)
Madagascar (MGA)
·
![]() Mozambique (MZN)
Mozambique (MZN)
·
![]() Papua New Guinea (PGK)
Papua New Guinea (PGK)
·
![]() Seychelles (SCR)
Seychelles (SCR)
·
![]() Sierra Leone (SLL)
Sierra Leone (SLL)
Inflation-targeting framework
·
![]() South Korea (KRW)
South Korea (KRW)
·
![]() New Zealand (NZD)
New Zealand (NZD)
·
![]() Philippines (PHP)
Philippines (PHP)
·
![]() South Africa (ZAR)
South Africa (ZAR)
Other
Free
floating
Inflation-targeting framework
·
![]() United Kingdom (GBP)
United Kingdom (GBP)
Other
·
![]() European Union (EUR)
European Union (EUR)
·
![]() Austria
Austria
·
![]() Belgium
Belgium
·
![]() Cyprus
Cyprus
·
![]() Egypt
Egypt
·
![]() Estonia
Estonia
·
![]() Finland
Finland
·
![]() France
France
·
![]() Germany
Germany
·
![]() Greece
Greece
·
![]() Ireland
Ireland
·
![]() Italy
Italy
·
![]() Latvia
Latvia
·
![]() Malta
Malta
·
![]() Portugal
Portugal
·
![]() Slovakia
Slovakia
·
![]() Slovenia
Slovenia
·
![]() Spain
Spain
·
![]() United States (USD)
United States (USD)
https://en.wikipedia.org/wiki/List_of_countries_by_exchange_rate_regime
First mid Term exam -
2/18
Conceptual
Part (close book)
25 questions *
2 = 50 points
1-2 What is Bretton Woods system?
3-10: fixed exchange rate system vs floating
exchange rate system: pro and cons.
11: What is spot rate?
12: what is Eurodollar?
13-15: What is Euro currency?
14: what is LIBOR?
15-20: Determinants of exchange rate
21-22: what is bid price? What is ask price?
23: What is BOP?
24: What is current account? What is capital
account?
25: What is current account deficit (trade deficit)?
Calculation Questions (Total 50 points, open book)
Questions 1: Similar to in class exercise, given gold price in two countries, calculate exchange rates; And calculate arbitrage profits.
Question 2: Draw demand and supply curve and derive the changes in exchange rate. Similar to examples in PPT.
Question 3-4: Similar to in class exercise, given the bid rate, ask rate, calculate the losses if convert to foreign currency first and then convert back soon.
Question 5-6: Given you exchange rates among three countries, and calculate arbitrage profits.
Question 7:
Similar to in class exercise, given you the exchange rates of two countries
(such as EUR/USD, GBP/USD), and ask
for cross exchange rate (EUR/GBP).
Question 8:
Similar to the in class exercise:
Blue Demon Bank expects that the Mexican peso will depreciate against the
dollar from its spot rate of $.15 to $.14 in 10 days. The following interbank
lending and borrowing rates exist:
Lending Rate Borrowing Rate
U.S.
dollar 8.0% 8.3%
Mexican
peso 8.5% 8.7%
Assume that Blue Demon Bank has a
borrowing capacity of either $10 million or 70 million pesos in the interbank
market, depending on which currency it wants to borrow.
a. How
could Blue Demon Bank attempt to capitalize on its expectations without using
deposited funds? Estimate the profits that could be generated from this
strategy.
Chapter 5 Currency
Derivatives
For class discussion: Assume that you are an
importer for seafood from Japan. This special seafood is only available in
the summer. How can you hedge against the exchange rate risk?
Let’s watch the following videos to
understand how the forward and future markets work.
Forward contract introduction
(video, khan academy)
Futures introduction (video, khan
academy)
For class discussion:
1.
How can forward contract and futures contract help reduce risk?
2. What is margin?
What is initial margin? What is maintenance margin? What is a margin call?
Why is margin call important to the margin account holder? When the margin
account holder receives a margin call, what shall she do? What will happen if
she takes no actions?
3. Why does
margin account value change constantly?
4. What does “mark to market” mean?
Forward market vs. Future market
1. Difference
between the two?
Future and Forward Contracts (Video)
Forward contract:
· Privately
negotiated;
· Non-transferable;
· customized
term;
· carried
credit default risk;
· fully
dependent on counterparty;
· Unregulated.
Futures Market Explained (Video)
Future contract:
· Quoted
in public market
· Actively
traded
· Standardized
contract
· Regulated
· No
counterparty risk
 (FYI)
(FYI)
F = forward rate
S = spot rate
r1 = simple interest rate of the term currency
r2 = simple interest rate of the base currency
T = tenor (calculated to the appropriate day count conversion)
2. Future market
Margin account and margin call
Benefits of Futures: Margin (video)
What is a margin call (Video)
CME (Chicago Merchandise Exchange)
http://www.cmegroup.com/trading/fx/#majors
|
||||||||||
|
Product |
Code |
Contract |
Last |
Change |
Chart |
Open |
High |
Low |
Globex Voll |
|
|
6EH0 |
MAR 2020 |
1.0823 |
+0.00095 |
1.0822 |
1.0824 |
1.0822 |
734 |
|||
|
E7H0 |
MAR 2020 |
1.08230 |
+0.00090 |
1.08230 |
1.08250 |
1.08230 |
32 |
|||
|
6JH0 |
MAR 2020 |
0.008997 |
+0.0000225 |
0.009003 |
0.009003 |
0.0089945 |
1,688 |
|||
|
J7H0 |
MAR 2020 |
0.0089970 |
+0.0000220 |
0.0089980 |
0.0090010 |
0.0089970 |
85 |
|||
|
6AH0 |
MAR 2020 |
0.6684 |
+0.0008 |
0.6678 |
0.6686 |
0.6678 |
1,447 |
|||
|
6BH0 |
MAR 2020 |
1.2930 |
+0.0001 |
1.2929 |
1.2931 |
1.2928 |
317 |
|||
|
6CH0 |
MAR 2020 |
0.75635 |
+0.00035 |
0.7563 |
0.75645 |
0.7562 |
363 |
|||
|
6SH0 |
MAR 2020 |
1.0180 |
+0.0004 |
1.0181 |
1.0182 |
1.0180 |
132 |
|||
|
6NH0 |
MAR 2020 |
0.6384 |
+0.0009 |
0.6385 |
0.6386 |
0.6382 |
153 |
|||
|
SEKH0 |
MAR 2020 |
0.10229 |
+0.00008 |
0.10229 |
0.10229 |
0.10229 |
1 |
|||
|
NOKH0 |
MAR 2020 |
- |
- |
- |
- |
- |
||||
Euro FX Futures Prices Wednesday, Jan 23rd, 2018
https://www.barchart.com/futures/quotes/E6*0/all-futures
Euro FX Mar '20 (E6H20)
1.08230 +0.00095 (+0.09%) 17:22 CT [CME]
1.08230 x 39 1.08235 x 20
EURO FX PRICES for Thu, Feb 20th, 2020
Latest futures price
quotes as of Wed, Feb 19th, 2020.
|
|
Last |
Change |
Open |
High |
Low |
Previous |
Volume |
Open Int |
Time |
Links |
|
1.08079 |
+0.00035 |
1.08045 |
1.08085 |
1.07981 |
1.08044 |
5,310 |
N/A |
17:23
CT |
||
|
1.08230 |
+0.00095 |
1.08220 |
1.08240 |
1.08220 |
1.08135 |
808 |
600,965 |
17:22
CT |
||
|
1.08325s |
+0.00020 |
1.08350 |
1.08445 |
1.08190 |
1.08305 |
189 |
1,811 |
02/19/20 |
||
|
1.08550s |
+0.00020 |
1.08630 |
1.08630 |
1.08415 |
1.08530 |
521 |
421 |
02/19/20 |
||
|
1.08835 |
+0.00105 |
1.08835 |
1.08835 |
1.08830 |
1.08730 |
7 |
11,762 |
17:11
CT |
||
|
1.08905s |
+0.00020 |
0.00000 |
1.08905 |
1.08905 |
1.08885 |
0 |
0 |
02/19/20 |
||
|
1.09305s |
+0.00025 |
1.09285 |
1.09450 |
1.09180 |
1.09280 |
39 |
1,325 |
02/19/20 |
||
|
1.09855s |
+0.00025 |
1.09800 |
1.09855 |
1.09800 |
1.09830 |
17 |
1,181 |
02/19/20 |
||
|
1.10430s |
+0.00040 |
0.00000 |
1.10430 |
1.10430 |
1.10390 |
0 |
0 |
02/19/20 |
||
|
1.10955s |
+0.00050 |
0.00000 |
1.10955 |
1.10955 |
1.10905 |
0 |
0 |
02/19/20 |
||
|
1.11480s |
+0.00060 |
0.00000 |
1.11480 |
1.11480 |
1.11420 |
0 |
0 |
02/19 |
Euro
Future Contract Specifications
https://www.barchart.com/futures/quotes/E6H19
Euro FX Mar '20 (E6H20)
1.08230 +0.00095 (+0.09%) 17:24 CT [CME]
1.08230 x 17 1.08235 x 54
QUOTE OVERVIEW for Thu, Feb 20th, 2020
Day Low 1.08220
Day High
1.08240
Open 1.08220
Previous
Close 1.08135
Volume 829
Open
Interest 600,965
Stochastic
%K 4.92%
Weighted
Alpha -7.99
5-Day
Change -0.00650 (-0.60%)
52-Week
Range 1.07990 - 1.18170
Contract
Specifications
Contract
Euro FX
Contract Size
EUR 125,000
Tick Size 0.00005 points ($6.25 per contract)
Trading Hours
5:00p.m. - 4:00p.m. (Sun-Fri) (Settles 2:00p.m.) CST
Exchange
CME
Point Value $125,000
Margin/Maintenance $1,980/1,800
First Notice Date 03/16/20 (26 days)
Expiration Date 03/16/20 (26 days)
Short
and long position and payoff
For a long position, its payoff:
Value at
maturity (long position) = principal * ( spot exchange rate at maturity –
settlement price)
For a short position, its payoff:
Value at
maturity (short position) = -principal * ( spot exchange rate at maturity –
settlement price)
Note: In the calculator, principal is called contract size
Corrections:
“ Difference Between Spot Rate and Futures Rate
The currency spot
rate is the current quoted rate that a currency, in
exchange for another currency, can be bought or sold at. The two currencies
involved are called a "pair." If an investor or hedger conducts a
trade at the currency spot rate, the exchange of currencies takes place at
the point at which the trade took place or shortly after the trade. Since
currency forward
rates are based on the currency spot rate, currency
futures tend to change as the spot rates changes”./////
https://www.investopedia.com/terms/c/currencyfuture.asp
Exercise
1: Amber sells a
March futures contract and locks in the right to sell 500,000 Mexican pesos
at $0.10958/Ps (peso). If the spot exchange rate at maturity is $0.095/Ps,
the value of Amber’s position on settlement is? (refer to ppt)
Answer: -500000*(0.095-0.10958)
Exercise
2: Amber purchases a
March futures contract and locks in the right to sell 500,000 Mexican pesos
at $0.10958/Ps (peso). If the spot exchange rate at maturity is $0.095/Ps,
the value of Amber’s position on settlement is?
Answer: 500000*(0.095-0.10958)
Exercise
3: Amber sells a March futures contract and locks in the
right to sell 500,000 Mexican pesos at $0.10958/Ps (peso). If the spot
exchange rate at maturity is $0.11/Ps, the value of Amber’s position on
settlement is? (refer to ppt)
Answer: -500000*(0.11-0.10958)
Exercise
4: Amber purchases a
March futures contract and locks in the right to sell 500,000 Mexican pesos
at $0.10958/Ps (peso). If the spot exchange rate at maturity is $0.11/Ps, the
value of Amber’s position on settlement is? (refer to ppt)
Answer: 500000*(0.11-0.10958)
Exercise
3: You expect peso to depreciate on 4/4. So you sell peso
future contract (6/17) on 4/4 with future rate of $0.09/peso. And on 6/17,
the spot rate is $0.08/peso. Calculate the value of your position on
settlement (refer to ppt)
HW of
chapter 5 part I (Due on with
second mid-term)
1. Consider
a trader who opens a short futures position. The contract
size is £62,500; the maturity is six months, and the settlement price is
$1.60 = £1; At maturity, the price (spot rate) is $1.50 = £1. What is his
payoff at maturity?
(Answer: £6250)
2. Consider
a trader who opens a long futures position. The contract size is £62,500; the maturity
is six months, and the settlement price is $1.60 = £1; At maturity, the price
(spot rate) is $1.50 = £1. What is his payoff at maturity?
(Answer: -£6250)
3. Consider
a trader who opens a short futures position. The contract
size is £62,500, the maturity is six months, and the
settlement price is $1.40 = £1; At maturity, the price (spot rate) is $1.50 =
£1. What is his payoff at maturity?
(Answer: -£6250)
4.
Consider a
trader who opens a long futures position. The contract size is £62,500, the maturity
is six months, and the settlement price is $1.40 = £1; At
maturity, the price (spot rate) is $1.50 = £1. What is his payoff at maturity?
5. Watch this video and explain the following concepts.
Understanding
Futures Margin | Fundamentals of Futures Trading Course
·
What is margin account?
·
What is mark to market?
·
What is initial margin?
·
What is maintenance margin?
·
What is margin call?
·
How is margin call triggered?
·
What will happen after a margin
call is received?
DESCRIPTION **** GOOD ANALYSIS
IN FACTORS AFFECTING CURRENY VALUES
https://www.barchart.com/futures/quotes/E6*1/profile
DESCRIPTION
A
"currency" rate involves the price of the base currency (e.g., the
dollar) quoted in terms of another currency (e.g., the yen), or in terms of a
basket of currencies (e.g., the dollar index). The world's major currencies
have traded in a floating exchange rate regime ever since the Bretton-Woods
international payments system broke down in 1971 when President Nixon broke
the dollar's peg to gold. The two key factors affecting a currency's value
are central bank monetary policy and the trade balance. An easy monetary
policy (low interest rates) is bearish for a currency because the central
bank is aggressively pumping new currency reserves into the marketplace and
because foreign investors are not attracted to the low interest rate returns available
in the country. By contrast, a tight monetary policy (high interest rates) is
bullish for a currency because of the tight supply of new currency reserves
and attractive interest rate returns for foreign investors.
The other key factor driving currency values is the nation's current account
balance. A current account surplus is bullish for a currency due to the net
inflow of the currency, while a current account deficit is bearish for a
currency due to the net outflow of the currency. Currency values are also
affected by economic growth and investment opportunities in the country. A
country with a strong economy and lucrative investment opportunities will
typically have a strong currency because global companies and investors want
to buy into that country's investment opportunities. Futures on major
currencies and on cross-currency rates are traded primarily at the CME Group.
Dollar - The dollar index (Barchart.com symbol DXY00) rallied to a 15-year
high in January 2017 on continued support from the Republican sweep of the
White House and Congress in the November 2016 election, which bolstered
expectations that a stimulus program would produce a strong economy and
higher interest rates in 2017. Indeed, the Federal Reserve at its December
2016 FOMC meeting projected three rate hikes in 2017, up from its September
estimate of two rate hikes. However, the dollar index then sold off during
most of the remainder of 2017, closing the year down -9.9%. The dollar was
undercut during 2017 as Republicans spent most of the first half of the year
trying to repeal Obamacare, leaving aside a tax cut and dropping an
infrastructure program. Congress in December 2017 finally did pass a massive
tax cut bill, which provided some underlying support for the dollar. However,
the markets were then concerned about expectations that the tax would will
expand the U.S. budget deficit in coming years, thus increasing the need for
the U.S. to import capital and leading to a larger current account deficit.
The dollar was also undercut during 2017 by political uncertainty tied to the
investigation into Russian interference in the November 2016 election. The
dollar found only modest support during 2017 from Federal Reserve policy even
though the Fed raised its federal funds rate target three times for a total
rate hike of +75 basis points to a target range of 1.25%/1.50% by the end of
2017.
Euro - EUR/USD (Barchart.com symbol ^EURUSD) slumped to a 15-year low in
early January 2017 on dollar strength and on speculation the ECB would not
end its QE program anytime soon because ECB President Draghi said there are "no
convincing signs yet of an upward trend in underlying inflation." However,
EUR/USD then rallied sharply in the second half of 2017 on (1) relief that
populists failed to win in the French national elections, (2) strength in the
Eurozone economy, and (3) growing expectations for the European Central Bank
(ECB) to eventually start to exit its extraordinarily easy monetary policy.
The Eurozone economy in 2017 showed relatively strong real GDP growth of
+2.3% as the Eurozone sovereign debt crisis finally started to fade into
history. The ECB in October announced that its quantitative easing (QE)
program, which ran at 60 billion euros per month during 2017, would be cut in
half to 30 billion euros per month for the first nine months of 2018. EUR/USD
finished 2017 with a sharp +14% gain.
Yen - USD/JPY (Barchart.com symbol ^USDJPY) posted the high for 2017 in early
January on dollar strength prompted by the results of the U.S. November 2016
elections. However, USD/JPY then weakened during 2017 and closed the year
down by -3.7% at 112.69 yen. The yen during 2017 found safe-haven demand from
(1) trade tensions prompted by the Trump administration, and (2) North Korean
geopolitical risks as North Korea continued its nuclear weapons development
program and conducted ballistic missile tests, drawing a U.S. threat of
military action. USD/JPY moved higher into November after Japanese Prime Minister
Abe's ruling coalition retained its super-majority in the October 2017
general election. The strong mandate for Abenomics implied the BOJ would
continue its massive quantitative easing program. The yen also found support
during 2017 from the Bank of Japan's (BOJ) shift in September 2016 to a
yield-curve-control (YCC) policy whereby the BOJ started to target the
10-year Japanese government bond (JGB) yield near the level of zero percent,
potentially allowing its quantitative easing program to drop in size from its
target level of 80 trillion yen per year.
Information on commodities is courtesy of the CRB
Yearbook, the single most comprehensive source of commodity and
futures market information available. Its sources - reports from governments,
private industries, and trade and industrial associations - are
authoritative, and its historical scope for commodities information is second
to none. The CRB Yearbook is part of the cmdty product line. Please visit
cmdty for all of your commodity data needs.
Euro FX
Futures Contract Specs
(http://www.cmegroup.com/trading/fx/g10/euro-fx_contract_specifications.html)
|
Contract
Unit |
125,000 euro |
||
|
Trading
Hours |
Sunday - Friday 6:00
p.m. - 5:00 p.m. (5:00 p.m. - 4:00 p.m. Chicago Time/CT) with a 60-minute
break each day beginning at 5:00 p.m. (4:00 p.m. CT) |
||
|
Minimum
Price Fluctuation |
Outrights: .00005 USD
per EUR increments ($6.25 USD). |
||
|
Product
Code |
CME Globex: 6E |
||
|
Listed
Contracts |
Contracts listed for the
first 3 consecutive months and 20 months in the March quarterly cycle (Mar,
Jun, Sep, Dec) |
||
|
Settlement
Method |
Deliverable |
||
|
Termination
Of Trading |
9:16 a.m. Central
Time (CT) on the second business day immediately preceding the third Wednesday
of the contract month (usually Monday). |
||
|
Settlement
Procedures |
Physical Delivery |
||
|
Position
Limits |
|||
|
Exchange
Rulebook |
|||
|
Block
Minimum |
|||
|
Price
Limit Or Circuit |
|||
|
Vendor
Codes |
|||
Million
Dollar Pips The Life Of A Day
Trader
https://www.youtube.com/watch?v=unM_0Vh00K4
Foreign Exchange Market
https://www.youtube.com/watch?v=-qvrRRTBYAk
Bullish option strategies example onoptionhouse
Bearish option strategies example onoptionhouse
Option Strategy graphs
Future Trading Guide
Futures
- Mechanics of the Futures Market
Currency war explained – bear talk cartoon
https://www.youtube.com/watch?v=1jA7c1_Jtvg
Chapter 5 Part II
Currency Option market
NASDAQ OMX PHLX (Philadelphia Stock Exchange)
trades more than 2,600 equity options, sector index options and U.S.
dollar-settled options on major currencies. PHLX offers a combination of
cutting-edge electronic and floor-based options trading.
Nasdaq: http://www.nasdaq.com/includes/swiss-franc-specifications.stm
1. What is Call and put
option? Difference between the two?
American call option (video, khan academy)
American put option (video, khan academy)
Call payoff diagram (video, khan academy)
Put payoff diagram (video, khan academy)
For
discussion:
·
When shall you consider a call
option?
·
When shall you buy a put
option?
·
Can you draw a call payoff
diagram?
·
What about a put payoff
diagram?
2. Calculate the payoff for
both call and put?
· For call: Profit = Spot rate – strike
price – premium; if option is exercised (when spot rate > strike price)
Or, Profit
= -premium, if option is not exercised (expired when spot
rate < strike
price)
In general, profit = max((spot rate – strike price -
premium), -premium ) ---------- Excel syntax
Excel payoff diagram for
call and put options (very helpful)
(Thanks to Dr. Greene http://www2.gsu.edu/~fncjtg/Fi8000/dnldpayoff.htm)
Calculator of Call and
Put Option
Example: Jim is a speculator . He
buys a British pound call option with a strike of $1.4 and a December
settlement date. Current spot price as of that date is $1.39. He pays a
premium of $0.12 per unit for the call option. Just before the expiration
date, the spot rate of the British pound is $1.41.At that time, he
exercises the call option and sells the pounds at the spot rate to a bank.
One option contract specifies 31,250 units. What is Jim’s profit or loss?
Assume Linda is the seller of the call option. What is Linda’s profit or
loss?
(refer to ppt. Answer:
Spot rate is
$1.39, Jim’s total profit: -0.12*31250
Spot rate is
$1.41, Jim’s total profit: (1.41-1.4-0.12)*31250=(-0.11)*31250
Spot rate is
$1.39, Linda’s total profit: 0.12*31250
Spot rate is
$1.41, Linda’s total profit: -((1.41-1.4-0.12)*31250)=0.11*31250
*** the loss of taking the long position of the option is
just the gain of taking the short position. It is a zero sum game.
· For put: Profit = strike price - Spot rate –
premium, if option is exercised (when spot rate < strike price)
Or, Profit =
-premium, if option is not exercised (expired when spot
rate > strike price)
In general, profit = max((strike price - spot rate - premium),
-premium ) ---------- Excel syntax
Example A speculator bought a put
option (Put premium on £ = $0.04 / unit, X=$1.4, One contract specifies
£31,250 )
He exercise the
option shortly before expiration, when the spot rate of the pound was $1.30.
What is his profit? What is the profit of the seller? (refer to ppt) When spot rate was $1.5, what are the profits of
seller and buyer?
(refer to
ppt. Answer:
Spot rate is
$1.30, option buyer’s total profit: (1.4 - 1.3 – 0.04) *31250
Spot rate is
$1.50, option buyer’s total profit: -0.04*31250
Spot rate is
$1.30, option seller’s total profit: -(1.4 - 1.3 – 0.04) *31250
Spot rate is
$1.50, option seller’s total profit: 0.04*31250
*** the loss of taking the long position of the option is
just the gain of taking the short position. It is a zero sum game.
HW
Chapter 5 Part II (Due with the
second mid term exam)
(Answer: 0.05; $0)
(Answer: $0.08; $0.03)
(Answer: -$0.05; 0)
4. You purchase a put option
on Swiss francs for a premium of $.05, with an exercise price of $.50. The
option will not be exercised until the expiration date, if at all. If the
spot rate on the expiration date is $.58,
how much is the payoff of this long option? And your profit? (And
also, please draw the payoff diagram to a long put option holder, optional,
for extra credits). (Answer: -$0.05; 0)
5. Set up a practice account at https://www.cmegroup.com/education/practice.html
and click on the “trading simulator” to start trading on the future market.
Choose a specific future contract, such as euro future contract expired in
March, and you can start the game. Report your account results. The following
is the summary of my account since 2/13/2019 (last year’s. This is not
required but you can give it a try)
|
Trade |
Symbol |
Contract |
Mo |
Strike |
C/P |
Position |
Buys |
Sells |
Average PX |
Unrealized P/L |
Realized P/L |
Flatten |
||||||||
|
6JJ9 |
Japanese Yen |
Short 5 |
0 |
5 |
0.0090492 |
-362.50 |
0.00 |
|||||||||||||
|
6EH9 |
Euro FX |
Sep |
4 |
4 |
0.00 |
6.25 |
||||||||||||||

Chapter 7 International Arbitrage And
Interest Rate Parity
Here are the countries
with the highest interest rates in the world:
|
Top 10 Countries
With the Highest Savings Interest Rates |
||
|
Ranking |
Country |
Savings Interest
Rate |
|
1 |
Kyrgyz Republic |
9.59% |
|
2 |
Gambia |
8.00% |
|
3 |
Mexico |
6.15% |
|
4 |
Brazil |
5.04% |
|
5 |
South Africa |
4.88% |
|
6 |
Uganda |
3.88% |
|
7 |
Bangladesh |
3.80% |
|
8 |
Zambia |
3.13% |
|
9 |
Kingdom of Eswatini |
3.08% |
|
10 |
Seychelles |
3.03% |
https://www.gobankingrates.com/banking/which-country-interest-rates/
For class discussion:
·
Why not invest in the above countries for higher interest rates?
·
For US residents, how can you make profits from currency carry
trades?
Venezuela
Interest Rate1998-2019 Data

Venezuela Interest
Rate https://tradingeconomics.com/venezuela/interest-rate
|
Actual |
Previous |
Highest |
Lowest |
Dates |
Unit |
Frequency |
|
|
21.77 |
22.50 |
83.73 |
12.79 |
1998
- 2019 |
percent |
Daily |
The Central Bank of Venezuela (Banco Central de Venezuela, BCV) is not responsible for setting interest rates.
For class discussion:
Why did interest rates drop in Venezuela?
Part 1 of chapter 7: Currency carry trade
Currency
carry trade (investorpedia)
Carry
trade basics (Video, Khan academy)
What is a Currency Carry Trade
A currency carry
trade is a strategy in which an investor sells a certain currency with a
relatively
low interest
rate and uses the funds to purchase a different currency yielding a higher
interest rate.
A trader using
this strategy attempts to capture the difference between the rates, which can
often
be substantial,
depending on the amount of the leverage used.

Japan Interest Rate
As the Yen Carry Trade
Returns, Consider its Role in the Great Recession
By Bill Camarda @ https://www.americanexpress.com/us/foreign-exchange/articles/yen-carry-trade-role-in-recession/
Abstract:
As the global financial crisis of 2007-2008 unfolded, triggering
Herculean efforts by central banks to stabilize financial markets through
aggressive monetary and fiscal stimuli, some observers pointed to the yen
carry trade as a key driver of the bubble that led up to the crisis – and a contributor that helped deepen the crisis as the
trades unwound.
A decade later, the yen carry trade appears to
be undergoing a revival, as the interest rate spreads between the U.S. and
Japan are widening again. It's worth considering the yen carry trade's role
in the Great Recession, why it happened, and any lessons that emerge from
that episode of economic history.
What is the Yen Carry
Trade?
Carry trades involve borrowing in currencies
with low interest rates and investing the proceeds in currencies where
interest rates are higher, thereby earning relatively easy profits. The
"Law of One Price" economic theory predicts that the profit
opportunities from price differences of this kind should quickly disappear,
as arbitrage rebalances the prices of assets across markets. But carry
trade opportunities have often lingered, offering sustained opportunities for
profit, and a growing body of academic research now helps to explain that
persistence.
For nearly two decades before the global
financial crisis, the yen-dollar carry trade was often among the most
prominent carry trades. It grew because the Bank of Japan kept interest rates
extremely low from the mid-1990s onward in an attempt to reignite Japan's
stagnant economy, while the U.S. Federal Reserve generally maintained
higher interest rates. The spread between Japanese and U.S. interest rates
encouraged many foreign exchange traders to sell yen they had borrowed at low
rates and buy dollars they could lend at higher rates.
When the Fed started to raise interest rates
in the mid-2000s, the widening spread between U.S. and Japanese rates
triggered a sudden increase in the yen-dollar carry trade. The trade
grew rapidly in the run-up to the global financial crisis, as even individual
currency traders joined hedge funds, banks, and other financial institutions
in pursuit of higher returns.
How Did the Yen Carry
Trade Affect the Global Financial Crisis?
From 2004-2007, rapid growth in yen carry
trades made far more dollars available for investment in the U.S. While some
of this money was invested in U.S. Treasury bonds, much of it found its way
into higher-yielding assets such as collateralized debt obligations (CDOs)
and U.S. subprime residential mortgage backed securities (RMBS) – assets
whose prices collapsed in 2007-8.
As the bubble burst and the Great Recession began,
the Fed dropped interest rates precipitously, eliminating the differences in
rates between Japan and the U.S.; the basis for the yen carry trade
disappeared. Yen carry trades quickly unwound, reducing dollar liquidity.
Japanese investors, and yen-leveraged American and European investors, sold
RMBSes, CDOs and other diverse assets and debt, purchasing dollars which they
then sold for yen. This contributed to the collapse of those assets' prices,
which in turn added to an extraordinary demand for dollars. The Fed responded
by undertaking aggressive quantitative easing – i.e., pouring new dollars
into the economy.
The yen carry trade had worked when the
yen-dollar exchange rate was relatively stable, or when the yen declined
against the dollar – as it did by roughly 20 percent from 2004-2008. But in
the wake of Lehman Brothers' September 2008 collapse, the yen rose rapidly
along with USD while most other currencies fell by comparison. Japanese
investors sold risky dollar-denominated assets and bought yen with the
proceeds, pushing the yen up vs. the dollar. American investors who had
borrowed in cheaper yen to fund dollar-denominated investments faced rising
FX costs in carrying their yen loans. They rushed to sell dollars (and other
currencies) to buy yen they could use to repay their yen loans, pushing the
yen exchange rate even higher. These events contributed significantly to the
volatility then roiling currency markets.
What's Happened Since
A few years after the global financial crisis,
Japan's expansionary economic policies contributed to a re-emergence of the
yen carry trade, as the yen's value dropped by 26 percent and significant
differences between U.S. and Japanese interest rates reappeared. Yen
carry trades increased by 70 percent between 2010 and 2013. However,
by early 2018, yen carry trade strategies had racked up four straight
quarters of losses. The outlook for the yen carry trade seemed poor: the yen
was rising against other currencies, traders expected the Bank of Japan to
tighten the reins on economic growth and raise interest rates, and traders
anticipated higher volatility in connection with growing international trade
frictions.
But in August 2018, the Bank of Japan
announced that it would keep interest rates extremely low for an indefinite
period. Observers noted that the Fed had already raised interest rates
several times, and was projecting five rate hikes through the end of
2019. Meanwhile, in the second quarter of 2018, Bloomberg found
borrowing yen to purchase dollar assets earned investors an exceptionally
attractive return of 4.9 percent, taking into account fluctuations in
exchange rates, levels of interest, and the funding costs.
It isn't yet clear how long the recent revival
of the yen carry trade will be sustained. Historically, the yen has often
been viewed as a safe haven currency. If increased volatility drives FX
traders to safety, the yen's value could rise, making the carry trade less
profitable.
But if the yen carry trade does keep growing,
it could again impact exchange and interest rates. When spreads between
interest rates widen, traders inevitably seek to take advantage of them. The
experience of 2007-2008 teaches that this can lead to market distortions and
even bubbles.
Homework chapter 7 (Due with second
mid term exam)
1. What are the risks and
awards associated with currency carry trade?
2. Here are the countries
with the highest interest rates in the world:
|
Top 10 Countries
With the Highest Savings Interest Rates |
||
|
Ranking |
Country |
Savings Interest
Rate |
|
1 |
Kyrgyz Republic |
9.59% |
|
2 |
Gambia |
8.00% |
|
3 |
Mexico |
6.15% |
|
4 |
Brazil |
5.04% |
|
5 |
South Africa |
4.88% |
|
6 |
Uganda |
3.88% |
|
7 |
Bangladesh |
3.80% |
|
8 |
Zambia |
3.13% |
|
9 |
Kingdom of Eswatini |
3.08% |
|
10 |
Seychelles |
3.03% |
https://www.gobankingrates.com/banking/which-country-interest-rates/
· Do you suggest currency carry trade with those
countries? Why or why not?
3.
Watch this
video. What is suggested by the host? Do you think that his strategy will
work? Why or why not?
how to do the carry trade.
(VIDEO, BY Robert Booker)
4.
Do you suggest of
currency carry trade to your friends? Which pair of currencies shall you
choose from the perspective of US investorss? (hint: you want the currency to
be strong, reliable, and the country’s interest rate is high)
Example: Currency carry trade
Currency Carry Trade: CNBC Explains (video)
What
is a 'Currency Carry Trade'
A
currency carry trade is a strategy in which an investor sells a certain
currency with a relatively low interest rate and uses the funds to
purchase a different currency yielding a higher interest rate. A
trader using this strategy attempts to capture the difference between
the rates, which can often be substantial, depending on the amount of
leverage used.
BREAKING
DOWN 'Currency Carry Trade'
As
for the mechanics, a trader stands to make a profit of the difference in the
interest rates of the two countries as long as the exchange rate between
the currencies does not change. Many professional traders use this trade
because the gains can become very large when leverage is taken into
consideration. If the trader in our example uses a common leverage factor of
10:1, he can stand to make a profit of 10 times the interest rate difference
The
big risk in a carry trade is the uncertainty of exchange rates. Using
the example above, if the U.S. dollar were to
fall in value relative to the Japanese yen, the trader runs the risk of
losing money. Also, these transactions are generally done with a lot of
leverage, so a small movement in exchange rates can result in huge losses
unless the position is hedged appropriately.
Currency
Carry Trade Calculations Example
As
an example of a currency carry trade, assume that a tra der notices that rates in Japan are 0.5% while in
the United States they are 4%. This means the trader expects to profit 3.5%,
which is the difference between the two rates. The first step is to borrow
yen and convert it into dollars. The second step is to invest those dollars
into a security paying the U.S. rate. Assume the current exchange rate is 115
yen per dollar and the trader borrows 50 million yen. Once converted, the
amount that he would have is:
U.S.
dollars = 50 million yen / 115 = $434,782.61
After
a year invested at the 4% U.S. rate, the trader has:
Ending
balance = $434,782.61 x (1 + 4%) = $452,173.91
Now,
the trader owes the 50 million yen principal plus 0.5% interest for a total
of:
Amount
owed = 50 million yen + (50 million yen x (1 + 0.5%)) = 50.25 million yen
If the exchange rate stays the same over the
course of the year and ends at 115, the amount owed in U.S. dollars is:
Amount owed = 50.25 million yen / 115 =
$436,956.52
The trader profits on the difference between
the ending U.S. dollar balance and the amount owed which is:
Profit = $452,173.91 - $436,956.52 =
$15,217.39
Notice that this profit is exactly the
expected amount: $15,217.39 / $434,782.62 = 3.5%
If the exchange rate moves against the yen,
the trader would profit more. If the yen gets stronger, the trader will earn
less than 3.5% or may even experience a loss.
-------- from investopedia.com
Dollar-Yen Carry Trade Just Got More Alluring, Thanks to BOJ
By Masaki Kondo Updated on August 15, 2018, 1:40 AM EDT
The dollar-yen carry trade just got more appealing for
investors, thanks to the Bank of Japan.
The U.S.-Japan policy divergence has gained more prominence with
Governor Haruhiko Kuroda’s adoption of forward
guidance to convey that rates in the Asian nation will stay extremely low for an extended period. That burnishes
the appeal of the arbitrage trade, say Mitsubishi UFJ Kokusai Asset
Management Co. and Mizuho Securities Co., given the Federal Reserve’s projection of raising interest rates five times through
end-2019.
The carry-to-risk ratio -- which compares interest-rate
differentials with implied currency volatility to gauge attractiveness of a
carry trade -- is the best for the dollar among G-10 exchange rates versus
the yen.

“The forward guidance is a positive for carry trade,” said Kiyoshi Ishigane, chief strategist at Mitsubishi UFJ
Kokusai Asset Management Co. in Tokyo. “The BOJ has
decided not to move. The yen is unlikely to strengthen from the perspective
of monetary policy.”
Borrowing in yen to purchase dollar assets earned
investors 4.9 percent in the April-June period, the best total carry return
among the Group-of-10 nations when taking the yen as the funding currency, data
compiled by Bloomberg show. Returns take into account the change in exchange
rates, interest income and the funding costs.
The strategy lost some of its sheen in July amid widespread speculation that the BOJ will adjust its
ultra-loose policy to mitigate its side effects on bank profits and bond
trading.
Staying Put
While Kuroda made some tweaks to reduce those side
effects, he also committed to “continuous powerful monetary easing,” leaving
him at odds with counterparts at the Fed, who continue to tighten policy. A
Bloomberg survey held Aug. 3-6 shows economists now see a lower chance of any further changes to BOJ’s policy through the 2019 calendar year.
The yen has weakened 6 percent from a 2018-high of
104.56 per dollar seen in late March, as a strengthening American economy
continues to support risk sentiment despite concerns over the U.S.-China
trade spat. The Bloomberg Dollar Spot Index is up 3.1 percent this year,
following an 8.5 percent loss in 2017.
“There is almost no reason to sell the dollar and buy the yen
from the perspective of fundamentals and monetary policy,”
said Kengo Suzuki, chief foreign-exchange strategist at Mizuho Securities Co.
in Tokyo. The dollar may strengthen to 118 yen before the year-end, he said.
Carry trades take various forms. They
include life insurance companies buying foreign bonds without currency
hedging, retail investors holding foreign-currency deposits and traders
buying a high-yielding currency via forward contracts, according to a
research paper from the BOJ.

That said, the dollar’s
attractiveness for carry trade is at odds with shrinking demand for U.S.
Treasuries among Japanese investors. They have dumped the securities in seven
of the eight months through May, deterred by high currency-hedging costs that
eat into the yield pick up. That’s because policy
tightening by the Fed means borrowing the U.S. currency as part of the
hedging process is costlier.
Further, the BOJ’s move to
allow wider fluctuations in the benchmark yield has boosted talk of Japanese
investors returning home to local bonds.
“Allowing for more flexibility suggests that rate differentials
will become more balanced,” TD Securities’ strategists including Mazen Issa wrote in a note dated
Aug. 9. “Though this will be slow, it does suggest
that global capital flows will shift back in favor of inflows for Japan. We
think the JPY’s return profile should be
asymmetrically skewed to appreciation over the medium-term.”
The firm is targeting dollar-yen at 104 at the end
of 2018.
Low Volatility
Japanese investors can currently earn an
interest-rate premium of 2.95 percentage points on their one-year dollar
deposits over those in yen. With the dollar-yen exchange rate at 111.25 as of
6:23 a.m. in London, carry trade will remain profitable as long as the spot
stays stronger than around 108.
Conversely, holding 10-year U.S. Treasuries on a
currency-hedged basis for one year gives them no yield pickup whatsoever,
given that the cost of protection against weakness in the dollar stands at
2.90 percent.
The table below shows the details of the
carry-to-risk ratios. FX volatility refers to one-year implied volatility
against the yen. The data are as of Monday and from Bloomberg.
|
CURRENCY |
1 YEAR DEPOSIT RATE |
FX VOLATILITY |
CARRY-TO-RISK |
|
PERCENT |
PERCENT |
RATIO |
|
|
USD |
2.83 |
8.56 |
0.34 |
|
AUD |
2.49 |
11.61 |
0.22 |
|
NZD |
2.35 |
11.50 |
0.21 |
|
CAD |
2.29 |
10.44 |
0.23 |
|
NOK |
1.36 |
11.31 |
0.13 |
|
GBP |
1.10 |
11.63 |
0.10 |
|
SEK |
-0.21 |
11.00 |
N/A |
|
EUR |
-0.24 |
9.87 |
N/A |
|
DKK |
-0.37 |
9.90 |
N/A |
|
CHF |
-0.65 |
7.85 |
N/A |
|
JPY |
-0.12 |
N/A |
N/A |
While the turmoil in Turkey
spurred demand for haven assets and propelled the yen to a six-week high on
Monday, the Bloomberg Dollar Spot Index also rallied to its highest since
June 2017.
A gauge of the dollar-yen’s
one-year implied volatility has slipped to 8.42 percent from this year’s high of 9.73 percent in early February. The decline in
the pair’s implied volatility over the last six
months is the biggest among G-10 yen crosses.
“The dollar and yen tend to be bought during risk aversion, so
the dollar-yen could have smaller volatility than other yen crosses, which is
conducive to carry trades,’’ said Koji Fukaya, chief
executive officer at FPG Securities Co. in Tokyo. “That
underscores the unique situation that we are in where the U.S. economy is
outperforming others and has the strongest upside to interest rates.’’
Chapter 7 Part II
Interest Rate Parity
In
class exercises
1. Locational arbitrage
Exercise 1: Bank1
–
bid Bank1-ask Bank2-bid
Bank2-ask
£ in
$: $1.60 $1.61 $1.62 $1.63
How can you arbitrage?
Answer: Buy
pound at bank1’s ask price and sell pound at bank2’s bid price. Profit is
$0.01/pound
For instance, with $1,610, you can buy £ at bank 1 @
$1.61/£ and get back £1,000.
Then, you can sell £ at bank 2 @ $1.62/£ and get back
$1,620, and make a profit of $10.
Pound is cheaper in bank 1 but more expensive in bank 2.
Therefore, you can arbitrage.
Bank1
–
bid Bank1-ask Bank2-bid
Bank2-ask
£ in $: $1.6 $1.61 $1.61 $1.62
How can you arbitrage? (Answer: Buy pound at
bank1’s ask price and sell pound at bank2’s bid price. No Profit )
For instance, with $1,610, you can buy £ at bank 1 @
$1.61/£ and get back £1,000.
Then, you can sell £ at bank 2 @ $1.61/£ and get back
$1,610, and make a profit of $0.
Pound is cheaper in bank 1 but more expensive in bank 2.
However, there is a bid ask spread, or fees charged by dealers. So no
arbitrage opportunities.)
Exercise
2: If you start with $10,000
and conduct one round transaction, how many $ will you end up with ?

(Answer: ($10000
/ 0.64($/NZ$)) – the amount obtained from north bank.
($10000
/ 0.64($/NZ$)) * 0.645 ($/NZ$) = $10078.13)
2. Triangular arbitrage
Exercise
1: £ is quoted at $1.60.
Malaysian Rinnggit (MYR) is quoted at $0.20 and the cross exchange
rate is £1 = MYR 8.1. How can you arbitrage?
Answer: Either $ è MYR è £ è $,
or $ è £ è MYR è $,
one way or another, you should make money. In this case, it is the latter
one. Imagine you have $1,600 è 1,000 GBP (£1 = MYR
8.1) è MYR8,100 è $1,620 (1MYR = 0.2$, so
8,100 *0.2= 1,620$) è profit of $20 from an
initial investment of $1,600
Exercise 2:

How can you arbitrage with the above information?
Answer: Same
as above but sell at bid and buy at ask. Only two rounds: USDà GBPàMYR,
or, USD àMYRàGBP. One way make money and the other one lose
money.
We start with $1,610 è buy
GBP at ask price, so get 1,000 GBP è sell
GBP for rinngit @ 1 GBP = 8.1 MYR; so
get 8,100 MYR è sell Rinngit for $ @ bid price. 8,100 MYR
= 8,100 * 0.20 = $1,620, a profit of $10 out of $1,610 initial
investment.
The other round is: 1,610$ è 8,009.95 MYR (=1,610/0.201) è976.8GBP
(=1,610/0.201/8.2) è 1,562.9 USD
(=1,610/0.201/8.2*1.6) è a loss of 47.1 USD, so not a good deal
3. Covered Interest Arbitrage (CIA):
Exercise 1: Assume
you have $800,000 to invest. Current spot rate of pound is $1.60. 90 day
forward rate of pound is $1.60. 90 day interest rate in US is 2%. 90 day
interest rate in UK is 4%. How can you arbitrage?

Answer: Convert
at spot rate for pound and then deposit pound in UK bank. 90 days later,
convert back to $ at forward rate. Refer to the above graph for details)
Exercise 2: You have $100,000 to invest for one year. How can you
benefit from engaging in CIA?

Answer: Again,
buy at ask and sell at bid. Convert at spot rate for pound and
then deposit pound in European bank. One year later, convert back to $ at
forward rate. ($100,000 / 1.13)*(1+6.5%) *1.12 = $105,558. However, if keep
the money in US, you can get $100,000*(1+6%) = $106,000 So better to deposit
in US and do not participate in CIA)
Interest rate parity (IRP)
· The interest rate parity implies that the expected return
on domestic assets = the exchanged rate adjusted expected return on foreign
currency assets.
IRP is based on that “Investors cannot earn
arbitrage profits” by
- Borrow
an amount in a currency with a lower interest rate.
- Convert
the borrowed amount into a currency with a higher interest rate.
- Invest
the proceeds in an interest-bearing instrument in this
higher-interest-rate currency.
- Simultaneously
hedge exchange risk by buying a forward contract to convert the
investment proceeds into the first (lower interest rate) currency.
For discussion:
Assume the current spot rate of GBP is 1.5$/£. Interest rate in US is 5% and Interest rate
is UK is 10%. Shall you invest in US for 5% or shall you invest in UK for a
higher return?
***Answer***: It should make no difference at all! Please
explain.
Using interest rate parity to
trade forex (https://www.investopedia.com/articles/forex/08/interes-rate-parity.asp)
BY pdated Apr 6, 2018
Interest
rate parity is the fundamental equation that governs the relationship between
interest rates and currency exchange rates. The basic premise of interest
rate parity is that hedged returns from investing in different currencies
should be the same, regardless of the level of their interest rates.
There
are two versions of interest rate parity:
1. Covered interest rate parity video
- Uncovered Interest Rate Parity
Read on to learn what determines interest rate
parity and how to use it to trade the forex market.
Calculating Forward Rates
Forward
exchange rates for currencies are exchange rates at a future point in time,
as opposed to spot exchange rates, which are current rates. An understanding
of forward rates is fundamental to interest rate parity, especially as it
pertains to arbitrage (the simultaneous purchase and sale of an asset in
order to profit from a difference in the price).
The
basic equation for calculating forward rates with the U.S. dollar as the base
currency is:
Forward Rate = Spot Rate X [(1 + Interest
Rate of Overseas country) / (1 + Interest Rate of Domestic country)]
Forward
rates are available from banks and currency dealers for periods ranging from
less than a week to as far out as five years and beyond. As with spot
currency quotations, forwards are
quoted with a bid-ask spread.
Consider
U.S. and Canadian rates as an illustration. Suppose that the spot rate for
the Canadian dollar is presently 1 USD = 1.0650 CAD (ignoring bid-ask spreads
for the moment). Using the above formula, the one-year forward rate is
computed as follows:
1 USD = 1.0650 X [(1 +
3.64%)/(1+3.15%)] = 1.0700 CAD
The
difference between the forward rate and spot rate is known as swap points. In
the above example, the swap points amount to 50. If
this difference (forward rate minus spot rate) is positive, it is known as a forward
premium; a negative difference
is termed a forward discount.
A currency with lower interest rates will
trade at a forward premium in relation to a currency with a higher interest
rate. In the example shown above, the U.S.
dollar trades at a forward premium against the Canadian dollar; conversely,
the Canadian dollar trades at a forward discount versus the U.S.
dollar.
Can
forward rates be used to predict future spot rates or interest rates? On both
counts, the answer is no. A number of studies have confirmed that forward
rates are notoriously poor predictors of future spot rates. Given that
forward rates are merely exchange rates adjusted for interest rate
differentials, they also have little predictive power in terms of forecasting
future interest rates.
Covered Interest Rate Parity
With covered interest rate parity,
forward exchange rates should incorporate the difference in interest rates
between two countries; otherwise, an arbitrage opportunity would exist.
In other words, there is no interest
rate advantage if an investor borrows in a low-interest rate currency to
invest in a currency offering a higher interest rate. Typically, the
investor would take the following steps:
- Borrow
an amount in a currency with a lower interest rate.
- Convert
the borrowed amount into a currency with a higher interest rate.
- Invest
the proceeds in an interest-bearing instrument in this
higher-interest-rate currency.
- Simultaneously
hedge exchange risk by buying a forward contract to convert the
investment proceeds into the first (lower interest rate) currency.
The returns in this case would be the same
as those obtained from investing in interest-bearing instruments in the lower
interest rate currency. Under the covered interest rate parity
condition, the cost of hedging exchange risk negates the higher returns that
would accrue from investing in a currency that offers a higher interest rate.
Covered Interest Rate Arbitrage
Consider
the following example to illustrate covered interest rate parity. Assume that
the interest rate for borrowing funds for a one-year period in Country A is
3% per annum, and that the one-year deposit rate in Country B is 5%. Further,
assume that the currencies of the two countries are trading at par in the
spot market (i.e., Currency A = Currency B).
An
investor does the following:
- Borrows in Currency A at 3%
- Converts the borrowed amount into
Currency B at the spot rate
- Invests these proceeds in a deposit
denominated in Currency B and paying 5% per annum
The
investor can use the one-year forward rate to eliminate the exchange risk
implicit in this transaction, which arises because the investor is now
holding Currency B, but has to repay the funds borrowed in Currency A. Under
covered interest rate parity, the one-year forward rate should be
approximately equal to 1.0194 (i.e., Currency A = 1.0194 Currency B),
according to the formula discussed above.
What
if the one-year forward rate is also at parity (i.e., Currency A = Currency
B)? In this case, the investor in the above scenario could reap
risk-free profits of 2%. Here’s how it would work.
Assume the investor:
- Borrows 100,000 of Currency A at 3%
for a one-year period.
- Immediately converts the borrowed
proceeds to Currency B at the spot rate.
- Places the entire amount in a
one-year deposit at 5%.
- Simultaneously enters into a one-year
forward contract for the purchase of 103,000 Currency A.
After
one year, the investor receives 105,000 of Currency B, of which 103,000 is
used to purchase Currency A under the forward contract and repay the borrowed
amount, leaving the investor to pocket the balance –
2,000 of Currency B. This transaction is known as covered interest rate
arbitrage.
Market
forces ensure that forward exchange rates are based on the interest rate
differential between two currencies, otherwise arbitrageurs would step in to
take advantage of the opportunity for arbitrage profits. In the above
example, the one-year forward rate would therefore necessarily be close to
1.0194.
Another
Example (https://finance.zacks.com/explain-concept-interest-rate-parity-3067.html)
Assume banks in
Britain offer 10 percent annual interest on British Pound deposits, while
banks in America offer 5 percent. Further assume that right now you can buy 1
Pound for $2. According to the interest rate parity theory, it should be more
expensive to buy pounds in a one-year forward contract than it is right now.
To see why, imagine what an American bank can do if it is possible to lock in
a $2 equals 1 Pound rate in a one-year forward contract. Such a bank can
accept $1 million in one-year deposits, promising to return principal plus 5
percent in a year, which makes $1.05 million. It can then buy 500,000 Pounds
right now and invest this in a British bank. At the end of the one year, it
would have 550,000 pounds and use the forward contract to convert this into
$1.1 million. After paying the depositor $1.05 million, the bank is left with
$50,000 in easy money.
Real
Life Application
As long as bank
deposits and government bonds in a country are truly risk free, the parity
theory holds perfectly in real life. In our example, the one year future rate
cannot be equal to the present rate because American banks would make
enormous risk free profits by exploiting this abnormality. The rates thus
adjust to eliminate the possibility of such easy profits. In an economy where
the banks or the government may not be able to honor payment promises due to
severe distress, there is no truly risk free rate available and the parity
theory may not hold.
Equation of IRP:
 or
or 

S$/¥: spot rate
how many $ per ¥. ¥ is the base currency and $ is quoted currency
F$/¥: forward
rate;
So, F = S *(1+ interest
rate of quoted currency) / (1+ interest rate of base currency)
Why?
Deposit in ¥ @ the ¥’s rate
and then convert back to F (forward rate)
= Convert to $ at spot rate and deposit at
$’s rate
So, (1+rate¥)*F =
S* (1+rate$) è F
= S* (1+rate$) /((1+rate¥)
Or,

S¥/$: spot rate
how many ¥ per $. ¥ is the base $ quoted
F¥/$: forward
rate;
So, F = S *(1+ interest
rate of quoted currency) / (1+ interest rate of base currency)
Why?
Deposit in $ @ the $’s rate
and then convert back to F (forward rate)
= Convert to ¥ at spot rate and deposit at
¥’s rate
So, (1+rate$)*F =
S* (1+rate¥) è F
= S* (1+rate¥) /((1+rate$)
Or,
The basic equation for calculating forward
rates with the U.S. dollar as the base currency is:
Forward
Rate = Spot Rate * [(1 + Interest Rate of quoted currency) / (1 +
Interest Rate of based currency)]
Spot
rate: ¥/$, or USD/YEN (Yen is quoted
and $ is based)
Or,
Forward Rate = Spot Rate * ( Interest Rate of quoted currency - Interest Rate of based currency +1 )
Exercise 1: i$ is
8%; iSF is 4%; If spot rate S
=0.68 $/SF, then how much is F90 (90 day forward rate)?
Answer:
S =0.68 $/SF è
CHF/USD = 0.68, so CHF is base currency and USD is the quoted currency.
So, F = 0.68*(1+8%/4) / (1+4%/4) = 0.6867 $/CHF (or
CHF/USD = 0.6867)
Exercise 2: i$ is 8%; iyen is 4%; If
spot rate S = 0.0094 $/YEN, then how much is F180 (180 day
forward rate)?
Answer:
S = 0.0094 $/YEN, so $ is the quoted currency,
Yen is the base currency.
F = S *(1+ interest rate of
quoted currency) / (1+ interest rate of base)è F=0.0094*(1+8%/2)/(1+4%/2) = 0.0096 $/YEN
Exercise 3: i$ is
4% and i£ is 2%. S is $1.5/£ and F is $2/£. Does IRP
hold? How can you arbitrage? What is the forward rate in equilibrium?
Answer:
S = $1.5/£, so $ is the quoted currency, £ is the base currency.
F = S *(1+ interest rate of
quoted currency) / (1+ interest rate of base)è F=(1.04/1.02)*1.5 = $1.529/£, F at $2/£ is too high.
When
F=$2/£, what can US investors do to
make arbitrage profits?
For example, US investor
·
can
borrow 1,000 $, and pay back $1,040 a year later.
·
Convert to £ now at spot rate and get $1,000/1.5$/£
= 666.67 £
·
deposit in UK @ 2%
·
so one year later, get back 666.67 £*(1+2%)=680£
·
convert to $ at F rate
·
so get back 680 £ * 2$/£
= $1,360
·
So the investor can make a profit of 1,360
-1040 = $320 profit.
The forward rate is set too high. It should be set around
$1.529/£, so that the arbitrage opportunity will be eliminated.
Exercise 4: i$ is 2%
and i£ is 4%. S is $1.5/£ and F is $1.1/£.
Does IRP hold? How can you arbitrage? What is the forward rate in
equilibrium?
Answer:
S = $1.5/£, so $ is the quoted currency, £ is the base currency.
F = S *(1+ interest rate of
quoted currency) / (1+ interest rate of base)è F=(1.02/1.04)*1.5 = $1.471/£, so F at $1.1/£ is too low.
When
F=$1.1/£, what can US investors do
to make arbitrage profits?
For example, US investor
·
can
borrow 1,000 $, and pay back $1,040 a year later.
·
Convert to £ now at spot rate and get $1,000/1.5$/£
= 666.67 £
·
deposit in UK @ 4%
·
so one year later, get back 666.67 £*(1+4%)=693.33£
·
convert to $ at F rate
·
so get back 680 £ * 1.1$/£
= $762.67
·
So the investor will lose money: $762.67 -1040
= -247.33, a loss.
The forward rate is set too low. It should be set around $1.471/£.
SO US investors should let this CIA (covered interest rate
arbitrage) go, but UK investor could consider borrow money in UK to generate
risk free profits. So the trade by UK investors will force forward rate to
drop to its equilibrium price based on IRP.
Rule of Thumb:
· All that is required to make a covered
interest arbitrage profit is for interest rate parity not to hold.
· The key to determining whether to start CIA is
to compare the differences in interest rate to the forward premium (= F/S-1,
or =forward rate / spot rate -1).
|
Spot exchange rate |
S($/£) |
= |
$2.0000/£ |
|
360-day forward rate |
F360($/£) |
= |
$2.0100/£ |
|
U.S. discount rate |
i$ |
= |
3.00% |
|
British discount rate |
i£ |
= |
2.5% |
1. With above information and $1,000 in hand, any
opportunities?
2. When F360($/£) =
$2.50/£?
3. When F360($/£) =
$1.90/£
Answer:
1. Either
CIA make 3% or deposit in US also 3%. F is priced correctly.
2. F is too
high for US residents and what to do? (please refer to PPT)
3.
F is too low and what to do. (please refer to PPT)
Homework chapter 7 part II (due
with final)
1. Suppose
that the one-year interest rate is 5.0 percent in the United States and 3.5
percent in Germany, and the one-year forward exchange rate is $1.3/€. What
must the spot exchange rate be? (Hint: the question is asking for the
spot rate, given forward rate. ~~ $1.2814/€ ~~)
2. Imagine that can
borrow either $1,000,000 or €800,000 for one year. The one-year interest rate
in the U.S. is i$ = 2%
and in the euro zone the one-year interest rate is i€ =
6%. The one-year forward exchange rate is $1.20 = €1.00; what must the spot
rate be to eliminate arbitrage opportunities? (1.2471$/€. It does not
matter whether you borrow $ or euro)
3. Image that the future
contracts with a value of €10,000 are
available. The information of one year interest rates, spot rate and forward
rate available are as follows.
Question: profits that you
can make with one contract at maturity?
Exchange
rate Interest
rate APR
So($/€) $1.45=€1.00 Interest
rate of $ 4%
F360($/€) $1.48=€1.00 Interest
rate of € 3%
Hint: The future contract is available, so you
can get 10,000 euro in the future. So at
present, you can
borrow €9,708.3 (=10,000 euro / 1.03) euro and purchase the
future contract of €10,000, since €
interest rate is 3%. Let’s see you can make money or not .
Convert €9,708.3 to $ at
spot rateè get back €9,708.3 *1.45 $/€= $14,077.67 è deposit at US @4% interest rate, and get back
$14,077.67 *(1+3%) = $14,640.78 è convert at F rate, and get back $14,640.78 / 1.48 $/€ =9,892.417 euro
, less than 10,000 euro è But if you deposit the
borrowed euro in Europe, it will be 10,000 euro and you can pay back the loan
with the 10,000 euro future contract value è so this round of trading is not a good idea.
4. Image that you find
that interest rate per year is 3% in Italy. You also realize that the spot
rate is $1.2/€ and forward rate (one year maturity) is $1.18/€.
Question: Use IRP to
calculate the interest rate per year in US. (1.28%)
The followings are useful websites
Exchange
rate forecast
http://exchangerateforecast.com/
Daily
FX News(has news, technical analysis and live rates):http://www.dailyfx.com/
Technical
analysis _ chart example book
http://www.forex-charts-book.com/
Forex Trend
lines
http://www.forextrendline.com/
Historical
currency rate
http://www.xe.com/currencytables/
Historical
currency chart
http://www.xe.com/currencycharts/
Forex trading
demo
http://www.fxcm.com/forex-trading-demo/
Purchasing
power parity (cartoon)
https://www.youtube.com/watch?v=i0icL5zlQww
Uncovered Interest Rate Parity
(FYI)
Uncovered interest rate parity (UIP) states that the
difference in interest rates between two countries equals the expected change
in exchange rates between those two countries. Theoretically, if the
interest rate differential between two countries is 3%, then the currency of
the nation with the higher interest rate would be expected to depreciate 3%
against the other currency.
In reality, however, it is a
different story. Since the introduction of floating exchange rates in the
early 1970s, currencies of countries with high interest rates have tended to
appreciate, rather than depreciate, as the UIP equation states. This
well-known conundrum, also termed the “forward
premium puzzle,” has been the subject of several
academic research papers.
The anomaly may be partly
explained by the “carry trade,” whereby speculators borrow in low-interest
currencies such as the Japanese yen, sell the borrowed amount and invest the
proceeds in higher-yielding currencies and instruments. The Japanese yen was
a favorite target for this activity until mid-2007, with an estimated $1
trillion tied up in the yen carry trade by that year.
Relentless selling of the
borrowed currency has the effect of weakening it in the foreign exchange
markets. From the beginning of 2005 to mid-2007, the Japanese yen depreciated
almost 21% against the U.S. dollar. The Bank of Japan’s
target rate over that period ranged from 0 to 0.50%; if the UIP theory had
held, the yen should have appreciated against the U.S. dollar on the basis of
Japan’s lower interest rates alone.
The Difference Between Covered
Interest Rate Parity and Uncovered Interest Rate Parity (FYI)
Covered interest parity (CIP) involves using
forward or futures contracts to cover exchange rates, which can thus be
hedged in the market. Meanwhile, uncovered interest rate parity involves
forecasting rates and not covering exposure to foreign exchange risk – that is, there are no forward rate contracts, and it
uses only the expected spot rate.
There is no theoretical difference between covered and
uncovered interest rate parity when the forward and expected spot rates are
the same.
Spring Break (Have Fun but Stay Safe)
Live
Session 3/17 (On blackboard as well) Class Notes FYI
·
Locational arbitrage
·
Triangular arbitrage
·
CIA
Live
Session 3/19 (On blackboard as well) Class
notes FYI
· Chapter 7 IRP example
Live
Session 3/24 (On blackboard as well) Class
Notes FYI
· Chapter 7 IRP and homework
Chapter 8 Purchasing Power Parity,
International Fisher Effect
Part I: PPP
1) Purchasing power parity (PPP)
Purchasing power parity (cartoon) https://www.youtube.com/watch?v=i0icL5zlQww
|
|
|
· A theory which states that exchange rates between
currencies are in equilibrium when their purchasing power is the same in
each of the two countries. · This means that the exchange rate between two countries
should equal the ratio of the two countries' price level of a fixed basket
of goods and services. · When a country's domestic price level is increasing
(i.e., a country experiences inflation), that country's exchange rate must
depreciated in order to return to PPP. |
|
· The basis for PPP is the "law of one
price": In the
absence of transportation and other transaction costs, competitive markets
will equalize the price of an identical good in two countries when the
prices are expressed in the same currency. · There are some caveats with this law of one price (for
class discussion) · (1) transportation costs, barriers to trade,
and other transaction costs, can be significant. · (2) there must be competitive markets for the
goods and services in both countries. · (3) tradable goods; immobile goods such as
houses, and many services that are local, are of course not traded between
countries. What else? Your opinion? |
|
|
2) The Law of one price THEORY:
All else
being equal (no transaction costs), a product’s price should be the same in
all markets
So price in $
sold in US = price in $ sold in Japan after conversion to $ from ¥
P$ = P ¥ * Spot Rate $/¥
Where the price of the product in US dollars (P$),
multiplied by the spot exchange rate (S, dollar per yen), equals
the price of the product in Japanese yen (P¥)
Or, S = P$/ P ¥
|
|
|
· No. · Exchange rate movements in the short term are
news-driven. · Announcements about interest rate changes, changes in perception
of the growth path of economies and the like are all factors that drive
exchange rates in the short run. · PPP, by comparison, describes the long
run behaviour of exchange rates. · The economic forces behind PPP will eventually equalize
the purchasing power of currencies. This can take many years, however. A
time horizon of 4-10 years would be typical. · What else? Your opinion? |
4) How to calculate PPP? ---- Use big mac index
· PPP states that the spot exchange rate is
determined by the relative prices of similar basket of goods.
· The simplest way to calculate purchasing power
parity between two countries is to compare the price of a
"standard" good that is in fact identical across countries.
· Every year The Economist magazine
publishes a light-hearted version of PPP: its "Hamburger Index" that
compares the price of a McDonald's hamburger around the world. More
sophisticated versions of PPP look at a large number of goods and services.
· One of the key problems is that people in
different countries consumer very different sets of goods and services,
making it difficult to compare the purchasing power between countries.
· For class discussion: can we use bitcoin as another goods to calculate PPP?
Using Hamburgers to Compare Wealth
- Big mac index explained video

Question: Can you use Big Mac Index as evidence to determine whether or
not a currency is under-valued? Or over-valued? Market
Edge: Peso 'undervalued' vs dollar based on 'Big Mac Index,' says The
Economist (video)
|
|
|
The
currencies listed below are compared to the US Dollar. A green bar indicated
that the local currency is overvalued by the percentage figure shown on the
axis; the currency is thus expected to depreciate against the US Dollar in
the long run. A red bar indicates undervaluation of the local currency; the
currency is thus expected to appreciate against the US Dollar in the long
run. |

The currencies listed below are compared to the Euro.

6) Where can I get more information?
|
|
|
||||||||||||
|
• OECD National Accounts: The OECD
publishes PPPs for all OECD countries. You can
retrieve a table with the OECD's 1950-2015 PPP rates. This is a
comma-seprated file that can be easily imported into a spreadsheet
program. |
|
||||||||||||
|
Data table for: Purchasing power parities (PPP),
Total, National currency units/US dollar, 2005– 2016 |
|||||||||||||
|
▾ 2008 |
▾ 2009 |
▾ 2010 |
▾ 2011 |
▾ 2012 |
▾ 2013 |
▾ 2014 |
▾ 2015 |
||||||
|
Argentina |
1.077 |
1.188 |
1.331 |
1.607 |
1.841 |
2.199 |
2.665 |
3.201 |
3.904 |
5.38 |
6.63 |
9.217 |
|
|
Brazil |
1.06 |
1.098 |
1.139 |
1.215 |
1.294 |
1.386 |
1.471 |
1.559 |
1.65 |
1.748 |
1.866 |
1.995 |
|
|
China (People's Republic
of) |
2.821 |
2.845 |
2.987 |
3.159 |
3.131 |
3.308 |
3.506 |
3.524 |
3.546 |
3.512 |
3.478 |
3.474 |
|
|
France |
0.916 |
0.896 |
0.89 |
0.882 |
0.863 |
0.854 |
0.841 |
0.844 |
0.812 |
0.808 |
0.814 |
0.806 |
|
|
Germany |
0.873 |
0.848 |
0.838 |
0.82 |
0.811 |
0.804 |
0.789 |
0.787 |
0.775 |
0.769 |
0.779 |
0.78 |
|
|
Greece |
0.709 |
0.693 |
0.719 |
0.708 |
0.704 |
0.721 |
0.713 |
0.685 |
0.631 |
0.611 |
0.61 |
0.604 |
|
|
Italy |
0.855 |
0.824 |
0.81 |
0.784 |
0.771 |
0.772 |
0.759 |
0.748 |
0.737 |
0.74 |
0.743 |
0.722 |
|
|
Japan |
129.552 |
124.504 |
120.392 |
116.846 |
115.171 |
111.624 |
107.454 |
104.274 |
101.303 |
103.052 |
102.763 |
100.279 |
|
|
Mexico |
7.127 |
7.186 |
7.348 |
7.47 |
7.43 |
7.668 |
7.673 |
7.859 |
7.884 |
8.045 |
8.541 |
8.869 |
|
|
https://data.oecd.org/conversion/purchasing-power-parities-ppp.htm#indicator-chart Data
table for: Actual Exchange Rate,
National currency units/US dollar, 2005– 2016 |
|||||||||||||
|
▾ 2008 |
▾ 2009 |
▾ 2010 |
▾ 2011 |
▾ 2012 |
▾ 2013 |
▾ 2014 |
▾ 2015 |
||||||
|
Argentina |
2.904 |
3.054 |
3.096 |
3.144 |
3.71 |
3.896 |
4.11 |
4.537 |
5.459 |
8.075 |
9.233 |
14.758 |
|
|
Brazil |
2.434 |
2.175 |
1.947 |
1.834 |
1.999 |
1.759 |
1.673 |
1.953 |
2.156 |
2.353 |
3.327 |
3.491 |
|
|
China
(People's Republic of) |
8.194 |
7.973 |
7.608 |
6.949 |
6.831 |
6.77 |
6.461 |
6.312 |
6.196 |
6.143 |
6.227 |
6.644 |
|
|
France |
0.804 |
0.797 |
0.731 |
0.683 |
0.72 |
0.755 |
0.719 |
0.778 |
0.753 |
0.754 |
0.902 |
0.904 |
|
|
Germany |
0.804 |
0.797 |
0.731 |
0.683 |
0.72 |
0.755 |
0.719 |
0.778 |
0.753 |
0.754 |
0.902 |
0.904 |
|
|
Greece |
0.804 |
0.797 |
0.731 |
0.683 |
0.72 |
0.755 |
0.719 |
0.778 |
0.753 |
0.754 |
0.902 |
0.904 |
|
|
Italy |
0.804 |
0.797 |
0.731 |
0.683 |
0.72 |
0.755 |
0.719 |
0.778 |
0.753 |
0.754 |
0.902 |
0.904 |
|
|
Mexico |
10.898 |
10.899 |
10.928 |
11.13 |
13.513 |
12.636 |
12.423 |
13.169 |
12.772 |
13.292 |
15.848 |
18.664 |
Relative purchasing power parity: Calculate changes in
exchange rate based on inflation in two countries
◦ the relative change in prices between countries over a period of
time determines the change in exchange rates
◦ if the spot rate between 2 countries starts in equilibrium, any
change in the differential rate of inflation between them tends to be offset
over the long run by an equal but opposite change in the spot rate
Math equation: ef= Ih- If or ((1+ Ih)/(1+If)
-1= ef; ef: change in
exchange rate
(1+ 9%) /(1+5%) -1
= ef = 4% , and 1£=1.6$, so the new
rate of £ =1.6*(1+4%) = 1.66 £/$.
Example 2: 1£=1.6$. US inflation rate is 5%. UK inflation is 9%. What
will happen? Calculate the new exchange rate using the PPP equation.
ef = Ih – If, Ih=
5%, If =9%, so ef =
5%-9% = -4%, so the old rate is that 1£=1.6$. The new rate should be 4%
lower. So new rate is that 1£=1.6*(1-4%) = 1.536$
Example 3: 1£=1.2€. Inflation rate in Germany is
4%. UK inflation is 9%. What will happen? Calculate the new exchange rate
using the PPP equation.
Home currency is euro and foreign
currency is pound. ef = Ih – If, Ih= 4%, If =9%, so ef = 4%-9% = -5%, so the old
rate is that 1£=1.2€. The new rate should be 5%
lower. So new rate is that 1£=1.2*(1-5%) = 1.14€
What Is Purchasing Power Parity (PPP)?
· BY MARY HALL
Updated
Feb 24, 2019
Macroeconomic
analysis relies on several different metrics to compare economic productivity
and standards of living between countries and across time. One popular metric
is purchasing power parity (PPP).
Purchasing
power parity (PPP) is an economic theory that compares different countries'
currencies through a "basket of goods" approach. According to this
concept, two currencies are in equilibrium or at par when a basket of
goods (taking into account the exchange rate) is priced the same in both
countries. Closely related to PPP is the law of one price (LOOP), which is an
economic theory that predicts that after accounting for differences in
interest rates and exchange rates, the cost of something in country X should
be the same as that in country Y in real terms.
How to Calculate Purchasing Power Parity
The
relative version of PPP is calculated with the following formula:
Where:
S represents
the exchange rate of currency 1 to currency 2
P1 represents
the cost of good X in currency 1
P2 represents
the cost of good X in currency 2
How PPP Is Used
To
make a comparison of prices across countries that holds any type of meaning,
a wide range of goods and services must be considered. The amount of data
that must be collected and the complexity of drawing comparisons makes
this process difficult. To facilitate this, the International Comparison
Program (ICP) was established in 1968 by the University of Pennsylvania and
the United Nations. Purchasing power parities generated by the ICP are based
on a worldwide price survey comparing the prices of hundreds of various
goods. This data, in turn, helps international macroeconomists come up with
estimates of global productivity and growth.
Every
three years, the World Bank constructs and releases a report
comparing various countries in terms of PPP and U.S. dollars. Both
the International Monetary Fund (IMF) and the Organization for Economic
Cooperation and Development (OECD) use weights based on PPP metrics to make
predictions and recommend economic policy. These actions often impact
financial markets in the short run.
Some forex traders also
use PPP to find potentially overvalued or undervalued currencies. Investors
who hold stock or bonds of foreign companies may survey PPP figures to
predict the impact of exchange-rate fluctuations on a country's economy.
PPP: The Alternative to Market Exchange Rates
Using
PPPs is the alternative to using market exchange rates. The actual purchasing
power of any currency is the quantity of that currency needed to buy a
specified unit of a good or a basket of common goods and services. Purchasing
power is determined in each country based on its relative cost of living
and inflation rates. Purchasing power plus parity equalizes the
purchasing power of two differing currencies by accounting for differences in
inflation rates and cost of living.
The Big Mac Index: An Example of PPP
As
a light-hearted annual test of PPP, The Economist has tracked the price of
McDonald's Corp.’s (MCD) Big Mac burger in many countries since 1986. The
highly publicized Big Mac index measures the purchasing power parity
(PPP) between nations using the price of a Big Mac as the benchmark. The
Big Mac index suggests, in theory, changes in exchange rates between
currencies should affect the price consumers pay for a Big Mac in a
particular nation, replacing the "basket" with the famous hamburger.
This is a prime example of how the "law" of one price fails in
practice.
For
example, if the price of a Big Mac is $4.00 in the U.S. and 2.5 pounds
sterling in Britain, we would expect the exchange rate to be
1.60 (4/2.5 = 1.60). If the exchange rate of dollars to pounds is any
greater, the Big Mac index would state the pound was overvalued, any
lower and it would be undervalued.
That
said, the index has its flaws. First, the Big Mac's price is decided by
McDonald's Corp., which can significantly affect the Big Mac index.
Also, the Big Mac differs across the world in size, ingredients and
availability. That being said, the index is meant to be light-hearted and is
a great example used by many schools and universities to teach students
about PPP.
GDP and PPP
In
contemporary macroeconomics, gross
domestic product (GDP) refers to
the total monetary value of the goods and services produced within one
country. Nominal GDP calculates the monetary value in current, absolute
terms. Real GDP takes the nominal GDP and adjusts it for
inflation. Further, some accounts of GDP are adjusted for PPP. This
adjustment attempts to convert nominal GDP into a number more easily
comparable between countries with different currencies.
One
way to think of what GDP with PPP represents is to imagine the total
collective purchasing power of Japan if it were used to make the same
purchases in U.S. markets. This only works after all yen are exchanged for
dollars. Otherwise, the comparison does not make sense.
The
following example illustrates this point. Suppose it costs $10
to buy a shirt in the U.S., and it costs €8.00 to buy the same shirt in
Germany. To make an apples-to-apples comparison, the €8.00 in Germany needs
to be converted into U.S. dollars. If the exchange rate was such that the
shirt in Germany costs $15.00, the PPP would be 15/10, or 1.5. For every
$1.00 spent on the shirt in the U.S., it takes $1.50 to obtain the same shirt
in Germany.
Which Nations Have the Highest Purchasing Power?
The
five nations with the highest GDP in market exchange terms are the U.S.,
China, India, Japan and Germany. This comparison changes when PPP is
used. According to 2017 data from the International Monetary Fund (IMF),
China has overtaken the U.S. as the world's largest economy based on purchasing
power with 23,122 billion current international dollars. The U.S. comes in
second with 19,362 billion. India, Japan and Germany follow with 9,447
billion, 5,405 billion, and 4,150 billion, respectively.
The Downfalls of PPP: Short-Term vs. Long-Term Parity
Empirical
evidence has shown that for many goods and baskets of goods, PPP is not
observed in the short-term, and there is uncertainty over whether it applies
in the long-term. In “Burgernomics,” (2003) a prominent paper that explores
the Big Mac Index and PPP, authors Michael R. Pakko and Patricia S. Pollard
cite several factors as to why PPP theory does not line up with reality:
- Transport costs: Goods that are not
available locally will need to be imported, resulting in transport
costs. Imported goods will consequently sell at a relatively higher
price than the same goods available from local sources.
While
not perfect, purchase power parity does allow one to compare pricing
between countries with differing currencies. Just don't try to buy a hamburger
in Luxembourg if you plan on exchanging for Russian rubles!
(https://www.investopedia.com/updates/purchasing-power-parity-ppp/)
HOW TO CALCUALTE PPP
Step 1
Determine which two
currencies you would like to compare for purchasing power parity. The formula
for purchasing power parity requires two prices in different currencies to
calculate the price ratio:
S (purchase power parity
ratio) = Price 1/Price 2
In this case, P1 refers to
one price in a specific currency, and P2 refers to another price in a
different currency.
For instance, suppose you
want to calculate the purchasing price parity between the United States and
Mexico. Your comparison prices will be in U.S. dollars and Mexican pesos.
Step 2
Determine which product is
commonly available in both the United States and Mexico. For simplicity,
we'll compare the price of Coca Cola in both countries. Although comparing
one common product is one strategy, economic analysts may also select a group
of common products to calculate a more broad measure of purchasing power
parity. This group of products is commonly called a basket of goods and may
include food staples such as bread, milk and other related items. Although
the basket approach may be broader, the single item method helps illustrate
the calculation in simpler terms.
Step 3
Research the prices of Coca
Cola in Mexico and the United States. The purchasing power parity formula
requires you to know the price of the item you are comparing. Assume for this
example that a 12-ounce can of Coca Cola costs $1.50 in U.S. dollars and $9
Mexican pesos. Divide the $9 pesos by $1.50. The result is the price ratio
for purchasing power parity. To illustrate the calculation refer to the
following:
S = P1/P2
S = 9/1.50
S = 6
Step 4
Compare the result of the
purchasing power parity to the currency exchange rate between the United
States and Mexico. Assume that the exchange rate between the Mexican peso and
U.S. dollar is 5.7 pesos for every dollar. Recall that for purchasing power
parity to exist, the exchange rate and the purchasing power parity ratio must
be equal. The purchasing power parity ratio of 6 and a $5.7 peso per dollar
exchange rate between the currencies in Mexico and the United States
indicates that the purchasing power of the peso and the dollar are similar
but not exact. This means that Mexican and U.S. consumers have similar
purchasing power with their respective currencies.
However, if the exchange
rate between the dollar and the peso suddenly changed to $17 pesos per dollar
and the purchasing power parity ratio remained at 6, the purchasing power
parity calculation shows a loss of purchasing power for Mexican consumers
relative to the U.S. consumers. ?
----- FROM WWW.SAMPLING.COM
Part II:
International Fisher Effect
7) International Fisher Effect
Fisher Effect: Nominal
interest rate (R) = real interest rate (r) + inflation (I)
By assuming real interest rates
in two countries are the same, we conclude that inflation moves along with
the nominal interest rate which is observable and reported.
The international
Fisher effect (sometimes
referred to as Fisher's open hypothesis) is a hypothesis in international finance that suggests differences
in nominal
interest rates reflect expected changes in the
spot exchange rate between countries. The
hypothesis specifically states that a spot exchange rate is expected to
change equally in the opposite direction of the interest rate differential;
thus, the currency of the country with
the higher nominal interest rate is expected to depreciate against the
currency of the country with the lower nominal interest rate, as higher
nominal interest rates reflect an expectation of inflation.
Example
Suppose the current spot exchange
rate between the United States and the United Kingdom is 1.4339 GBP/USD.
Also suppose the current interest rates are 5 percent in the U.S. and 7
percent in the U.K. What is the expected spot exchange rate 12 months from
now according to the international Fisher effect?
Solution: The effect estimates future exchange
rates based on the relationship between nominal interest rates. Multiplying the
current spot exchange rate by the nominal annual U.S. interest rate and
dividing by the nominal annual U.K. interest rate yields the estimate of the
spot exchange rate 12 months from now.
$1.4339*(1+5%)/(1+7%)
= $1.4071
The expected percentage change in the exchange rate is a
depreciation of 1.87% for the GBP (it now only costs $1.4071 to purchase 1
GBP rather than $1.4339), which is consistent with the expectation that the
value of the currency in the country with a higher interest rate will depreciate.
https://en.wikipedia.org/wiki/International_Fisher_effect
Calculator for
IFE and relative PPP
Example 4: If the interest rate of US is 10% and that of UK is 5%, which country’s currency will appreciate, by how much? Imagine 1£=1.6$.
Home currency is $ and foreign currency is €. ef = Rh – Rf, Rh=
10%, Rf =5%, so ef = 10%-5% = 5%, so the old
rate is that 1£=1.6$. The new rate should be 5% higher. So new rate is
that 1£=1.6*(1+5%) = 1.68$
Example
5: If the interest rate of US is 5% and
that of UK is 10%, which country’s
currency will appreciate, by how much? Imagine 1£=1.6$.
Home currency is $ and foreign currency is £. ef = Rh – Rf, Rh=
5%, Rf =10%, so ef = 5%-10% = -5%, so the old
rate is that 1£=1.6$. The new rate should be 5% lower. So new rate is that 1£=1.6*(1-5%)
Homework chapter 8 (due with Final)
1. If
a Big Mac costs $2 in the United States and 300 yen in Japan, what is the
estimated exchange rate of yen/ $ as hypothesized by the Big Mac index? (Answer:
150 yen /$)
2. Interest
rates are currently 2% in the US and 3% in Germany. The current
spot rate between the € and $ is $1.5/€. What is the expected spot rate in
one year if the international Fisher effect holds? (Answer:1.4854$/€)
3. You
find that inflation in Japan just reduced to 1.3%, while in US, the inflation
rate just increased to 3%. You also observed that the spot rate for yen was
$0.0075 before the adjustment by economists. With new inflation released, the
demand and supply for currencies will drive the exchange rate to a new
equilibrium price.
Question: Use
PPP to estimate the new exchange rate for yen. (Answer:0.0076$/yen)
4. You
observed the nominal interest rate (annual) just increased to 6% in China,
while the nominal annual interest rate is 3% in US. The spot rate for Chinese
Yuan is $6.8 before the adjustment.
Question: Use
IFE to estimate the new spot rate for Chinese Yuan after the interest rate changes. (Answer:6.6075$/RMB. Note: Dollar is more valuable. In this
example, RMB becomes the more valuable currency. Sorry for the mistake)
Live
Session 3/26 (On blackboard as well) Class
notes 3-26
· Homework of Chapter 7
· Chapter 8 part I -
PPP
Live
Session 3/31 (On blackboard as well)
· Chapter 8 part II –
Relative PPP, IFE
Live
Session 4/2 (On blackboard as well)
· Term project Part II:
Excel assignment
· Term project I:
Q&A
Chapter 11: Managing Transaction
Exposure
What Is Transaction Exposure?
Transaction
exposure is the level of uncertainty businesses involved in international
trade face. Specifically, it is the risk that currency exchange rates
will fluctuate after a firm has already undertaken a financial obligation. A
high level of vulnerability to shifting exchange rates can lead to major
capital losses for these international businesses. One way that firms can
limit their exposure to changes in the exchange rate is to implement
a hedging strategy. Through hedging using forward rates, they
may lock in a favorable rate of currency exchange and avoid exposure to risk.
Risks
of Transaction Exposure
The danger of
transaction exposure is typically one-sided. Only the business that completes
a transaction in a foreign currency may feel the vulnerability. The entity
that is receiving or paying a bill using its home currency is not subjected
to the same risk. Usually, the buyer agrees to buy the product using foreign
money. If this is the case, the hazard comes it that foreign currency should
appreciate, costing the buyer to spend more than they had budgeted for the
goods.
Key
Takeaways
- The
level of risk companies involved in international trade face.
- A
high level of exposure to fluctuating exchange rates can lead to major
losses for firms.
- The
risk of transaction exposure is typically one-sided.
Real
World Example of Transaction Exposure
Suppose that a
United States-based company is looking to purchase a product from a company
in Germany. The American company agrees to negotiate the deal and pay for the
goods using the German company's currency, the euro. Assume that when
the U.S. firm begins the process of negotiation, the value of the euro/dollar
exchange is a 1-to-1.5 ratio. This rate of exchange equates to one euro being
equivalent to 1.50 U.S. dollars (USD).
Once the
agreement is complete, the sale might not take place immediately. Meanwhile,
the exchange rate may change before the sale is final. This risk of change is
transaction exposure. While it is possible that the values of the dollar and
the euro may not change, it is also possible that the rates could become more
or less favorable for the U.S. company, depending on factors affecting the
currency marketplace. More or less favorable rates could result in changes to
the exchange rate ratio, such as a more favorable 1-to-1.25 rate or
a less favorable 1-to-2 rate.
Regardless of
the change in the value of the dollar relative to the euro, the Belgian
company experiences no transaction exposure because the deal took
place in its local currency. The Belgian company is not affected if it
costs the U.S. company more dollars to complete the transaction because the
price was set as an amount in euros as dictated by the sales agreement.
(https://www.investopedia.com/terms/t/transactionexposure.asp)
Types of foreign exchange exposure
Transaction Exposure – measures changes in the
value of outstanding financial obligations incurred prior to a change in
exchange rates but not to be settled until after the exchange rate changes
Operating (Economic)Exposure – also called economic exposure,
measures the change in the present value of the firm resulting from any
change in expected future operating cash flows caused by an unexpected change
in exchange rates
Translation Exposure – also called accounting
exposure, is the potential for accounting derived changes in owner’s
equity to occur because of the need to “translate” financial statements of
foreign subsidiaries into a single reporting currency for consolidated
financial statements
Tax Exposure – the tax consequence of foreign
exchange exposure varies by country, however as a general rule only realized foreign
losses are deductible for purposes of calculating income taxes
\
What is transaction exposure

Example of transaction exposure
— Purchasing or selling on credit goods or services when
prices are stated in foreign currencies
— Borrowing or lending funds when repayment is to be made
in a foreign currency
— Being a party to an unperformed forward contract and
— Otherwise acquiring assets or incurring liabilities
denominated in foreign currencies
How to reduce the transaction exposure risk?
1. 1. Forward
(Future) Market Hedge
2. 2.
Money Market Hedge
3. 3.
Options Market Hedge: call and put
· To
hedge a foreign currency payable buy calls on the currency.
· To
hedge a foreign currency receivable buy puts on the currency.
Exercise 1: Hedging
currency payable (refer to the PPT of chapter 11 for
answers)
A U.S.–based importer of Italian
bicycles
· In
one year owes €100,000 to an Italian supplier.
· The
spot exchange rate is $1.18 = €1.00
· The
one year forward rate is $1.20 = €1.00
· The
one-year interest rate in Italy is i€ =
5%
· The
one-year interest rate in US is i$ = 8%
— Call option
exercise price is $1.2/ € with premium of $0.03.
How to hedge the currency payable risk
a. With
forward contract?
b. With
money market?
c. With
call option? Can we use put option?
Answer: Need €100,000
one year from now to pay the payable and plan to hedge the risk of overpaying
for the payable one year from now.
1) With
forward contract:
Buy the
one year forward contract @$1.20 = €1.00. So need
100,000€*1.2$/€ = $120,000
one year from now. So the company needs to come up with $120k for this
payable obligation.
2) With
money market:
Need €100,000 one year from now, and the rate is 5% in Italy, so
can deposit €100,000/(1+5%) = €95238.10
now.
For
this purpose, need to convert from € to
$: €95238.10*$1.18 /€=$112380.98.
Imagine
the company does not have that much of cash and it borrows @8%. So one year
from now, the total $ required to pay back to the banks is: $112380.98
*(1+8%) = $121371.43. So the company needs to come up
with $121371.43for this payable obligation.
Summary: Borrow
$112380.98 @8% and convert to €95238.10 at present;
One year later, the company can get the €100,000 and
needs to pay back to the bank a total of $121371.43.
3) With
call option:
Imagine
the rate one year later is $1.25/€. So should
exercise the call option and the cost one year later should be
€100,000
*(1.2+0.03) $/€ = $123000, lower than the actual cost
without the call option. So $123k is the most that the company needs to
prepare for this payable obligation. USING CALL OPTION, THE ACTAUL PAYMENT
COULD BE A LOT LESS, DEPENDING ON THE ACTAUL EXCHANGE RATE ONE YEAT LATER.
Exercise
2: Hedging currency receivable
(refer to the PPT of chapter 11 for answers)
· A
U.S.–based exporter of US bicycles to Swiss
distributors
· In
6 months receive SF200,000 from an Swiss distributor
· The
spot exchange rate is $0.71 = SF1.00
· The
6 month forward rate is $0.71 = SF1.00
· The
one-year interest rate in Swiss is iSF = 5%
· The
one-year interest rate in US is i$ = 8%
· Put
option exercise price is $0.72/ SF with premium of $0.02.
How to
hedge the currency payable risk
a. With
forward contract?
b. With
money market?
c. With
call option? Can we use put option?
Answer: Will
receive SF200000 six month from now as receivable and plan to
hedge the risk of losing value in the receivable six month from now.
1) With
forward contract:
Sell
the one year forward contract @$0.71 = €1.00. So get
200,000SF * 0.71$/SF = $142,000 six month from now. So the company could
receive $142k with forward contract.
2) With
money market:
Get
SF200000 six month from now, and the rate is 5% in Swiss (or 2.5% for six
months), so can borrow SF 200,000/(1+2.5%) = SF195121.95 now.
And can
convert @ spot rate to SF195121.95 * 0.71$/SF = $138536.59. This is
the money you have now.
So six
month from now, the total you have in the bank is: $138536.59*(1+4%) =
$144078.05. And you can use the SF200000 receivable to pay back the
loan. So the company could receive $144078.05 with money
market.
Summary: Borrow SF195121.95
@5% at present; six month later, the company can get
the SF200,000 receivable and payback the loan. Meanwhile, convert
the borrowed SF to $ and deposit in US banks @ 8%.
3) With
put option: With SF200000 received six month later, need
to converting it back to $. So can buy put option which allows to sell SF for
$ at the exercise price $0.72/ SF.
Imagine
the rate one year later is $0.66/ SF. So should exercise the put option and the total amount
of $ six month later should be SF 200,000 *(0.72-0.02) $/ SF =
$140000. So $140k is the LEAST that the company CAN OBTAIN. USING
PUT OPTION, THE ACTAUL INCOME COULD BE A LOT MORE, DEPENDING ON THE
ACTAUL EXCHANGE RATE ONE YEAT LATER.
Homework of
Chapter 11 (due with final)
1. Suppose that your
company will be billed £10 million payable in one year. The money
market interest rates and foreign exchange rates are given as follows. How to
hedge the risk for parable using forward contract. How to hedge the risk
using money market? How to hedge risk using call option?
|
Call option exercise price The U.S. one-year interest
rate: |
$1.46/ €
with premium of $0.03 6.10% per annum |
|
The U.K. one-year interest rate: |
9.00% per annum |
|
The spot exchange rate: |
$1.50/£ |
|
The one-year forward exchange rate |
$1.46/£ |
(Answer: With forward
contract: $14.6 million; Money market: $14.6million; Call option:
$14.9million)
2. Suppose that your
company will be billed £10 million receivable in one year. The
money market interest rates and foreign exchange rates are given as follows.
How to hedge the risk for parable using forward contract. How to hedge the
risk using money market? How to hedge risk using put option?
|
put option exercise price The U.S. one-year interest
rate: |
$1.46/ €
with premium of $0.03 6.10% per annum |
|
The U.K. one-year interest rate: |
9.00% per annum |
|
The spot exchange rate: |
$1.50/£ |
|
The one-year forward exchange rate |
$1.46/£ |
(Answer: With forward contract: $14.6
million; Money market: $14.6million; Put option: $14.3million)
Live
Session 4/7 (On blackboard as well)
· Chapter 11
Live
Session 4/9 (On blackboard as well)
· Chapter 11 Homework
explained
Live
Session 4/14 (On blackboard as well)
· Chapter 18
Chapter 18 Interest rate swap
Requirement: Concepts only. Calculation not required
ppt
Intro:
• All firms—domestic or multinational,
small or large, leveraged, or unleveraged—are sensitive to interest rate
movements in one way or another.
• The single largest interest
rate risk of the nonfinancial firm (our focus in this discussion) is debt
service
– The multicurrency dimension
of interest rate risk for the MNE is a complicating concern.
• The second most prevalent
source of interest rate risk for the MNE lies in its portfolio holdings
of interest-sensitive securities
Interest
rate swap 1 | Finance & Capital Markets | Khan Academy
Interest rate swap 2 | Finance & Capital Markets |
Khan Academy
Example: Consider a firm
facing three debt strategies
– Strategy #1: Borrow $1
million for 3 years at a fixed rate
– Strategy #2: Borrow $1
million for 3 years at a floating rate, LIBOR + 2% to be reset annually
(LIBOR: London Interbank Offered Rate,)
– Strategy #3: Borrow $1
million for 1 year at a fixed rate, then renew the credit annually
– Although the lowest cost of
funds is always a major criterion, it is not the only one
• Strategy #1 assures itself
of funding at a known rate for the three years
– Sacrifices the ability to
enjoy a fall in future interest rates for the security of a fixed rate of
interest should future interest rates rise
• Strategy #2 offers what #1
didn’t, flexibility (and, therefore, repricing risk)
– It too assures funding for
the three years but offersrepricing risk
when LIBOR changes
– Eliminates credit risk as
its spread remains fixed
• Strategy #3 offers more
flexibility but more risk;
– In the second year the firm
faces repricing and credit
risk, thus the funds are not guaranteed for the three years and neither is
the price
– Also, firm is borrowing on
the “short-end” of the yield curve which is typically upward sloping—hence,
the firm likely borrows at a lower rate than in Strategy #1
Volatility, however, is far greater on the short-end
than on the long-end of the yield curve.
What is
interest rate swap?
Swaps are contractual agreements to exchange or swap a
series of cash flows
– Whereas a forward rate agreement
or currency forward leads to the exchange of cash flows on just one future
date, swaps lead to cash flow exchanges on several future dates
• If the agreement is to swap
interest payments—say, fixed for a floating—it is termed an interest
rate swap
– Most commonly,
interest rate swaps are associated with a debt service, such
as the floating-rate loan described earlier
– An agreement between two
parties to exchange fixed-rate for floating-rate financial obligations is often
termed a plain vanilla swap
– This type of swap forms
the largest single financial derivative market in the world.

Why
Interest-rate Swaps Exist
• If company A (B) wants a floating- (fixed-) rate loan, why
doesn’t it just do it from the start? An explanation commonly put forward
is comparative advantage!
• Example: Suppose that two
companies, A and B, both wish to borrow $10MM for 5 years and have been offered
the following rates:
Fixed Floating
Company
A 10% 6
month LIBOR+0.3%
Company
B 11.2% 6month
LIBOR+1.0%
– The difference between the two
fixed rates (1.2%) is greater than the difference between the two floating
rates (0.7%)
• Company B has a comparative
advantage in floating-rate markets
• Company A has a comparative
advantage in fixed-rate markets
• In fact, the combined
savings for both firms is 1.2% - 0.70% = 0.50%

Plain vanilla swap: An agreement between two parties
to exchange fixed-rate for floating-rate financial obligations

No Homework for this chapter
4/16 – No class
4/17
·
Final-will be posted on blackboard
at 8am, due at 11:59 pm
·
Homework due
·
Term project due
Winner!
Hossam Alomim
|
NET WORTH |
LAST |
TRADES |
TOTAL RETURNS |
|||||
|
$2,565,781.72 |
0.00% |
8 |
$1,565,781.72 |
|||||
|
NAME |
NET WORTH |
LAST |
TRADES |
TOTAL RETURNS |
||||
|
2 |
$1,358,362.52 |
0.00% |
72 |
$358,362.52 |
||||
|
3 |
$1,339,092.74 |
0.00% |
6 |
$339,092.74 |
||||
|
4 |
$1,107,582.06 |
6.98% |
117 |
$107,582.06 |
||||
|
5 |
$1,097,027.07 |
1.66% |
7 |
$97,027.07 |
||||
Warmest congratulations on your graduation!
