FIN415 Class Web
Page, Spring '22
Jacksonville
University
Instructor:
Maggie Foley
Term Project Part I (due with
final)
Term project part II (excel
questions) (due with final)
Weekly SCHEDULE,
LINKS, FILES and Questions
|
Week |
Coverage, HW, Supplements -
Required |
|
Videos (optional) |
|||||||||||||||||||||||||||||||||||||||||||||||||||||||||||||||||||||||||||||||||||||||||||||||||||||||||||||||||||||||||||||||||||||||||||||||||||||||||||||||||||||||||||||||||||||||||||||||||||||||||||||||||||||||||||||||||||||||||||||||||||||||||||||||||||||||||||||||||||||||||||||||||||||||||||||||||||||||||||||||||||||||||||||||||||||||||||||||||||||||||||||||||||||||||||||||||||||||||||||||||||||||||||||||||||||||||||||||||||||||||||||||||||||||||||||||||||||||||||||||||||||||||||||||||||||||||||||||||||
|
Week 1 |
Marketwatch Stock Trading Game (Pass
code: havefun) 1. URL for your game: 2. Password for this private
game: havefun. 3. Click on the 'Join Now'
button to get started. 4. If you are an
existing MarketWatch member, login. If you are a new user, follow
the link for a Free account - it's easy! 5. Follow the instructions and
start trading! 6. Game will be over
on 4/17/2019 How to Use
Finviz Stock Screener (youtube, FYI)
How To Win
The MarketWatch Stock Market Game (youtube, FYI)
How Short
Selling Works (Short Selling for Beginners) (youtube,
FYI)
|
|
1/11Class
video:
syllabus and market watch game 1/13 class
video: 2021 global review – world bank; Currency
conversion exercise 1/18 Class
video: Bi-lateral vs. Multi-lateral trading system;
RCEP 1/20 class
video: Balance of payment, current account 1/25 Class
video:
International monetary system, Bretton Woods aggrement, gold standard,
digital currency 1/27 class
video: Global financial market, Brexit, LIBOR and
SOFR 2/1 Class
video: Exchange rates determinants; Impossible
trinity; Dollar appreciation 2022 2/3 class
video: Currency conversion; Bid-Ask spread; 2/8 Class
video:
Eurocurrency, Naples waste
management & Italy’s first bank (PPT, by Theodore and Christian. Thank
you) 2/10 class
video: class
is cancelled --- instructor needs to attend AEF
conference 2/15 Class
video:
Exchange rates determinants revisited; Argentina’s hyperinflation 2/17 class
video:
will $ collapse? Yen carry trade; in class exercise 2/22 Class
video: First Mid Term Exam 2/24 class
video:
Futures contract 3/1
Class video: call & put option 3/3
Class video: currency carry trade examples 3/8
Class video: interest rate parity 3/10
Class video: Ukraine War (Thanks, Theodore and Christian), and IRP 3/15 Class video Spring Break 3/17 Class video Spring Break 3/22
Class video IRP 3/24
Class video PPP, Big Mac Index 3/29
Class video International Fisher Effect, exam review 3/31 Class video Second Midterm exam (on blackboard, under second
midterm exam folder) 4/5 Class video chapter 11: Transaction Exposure, part I 4/7
Class video class is cancelled --- instructor needs to attend EFA conference
4/12 Class video chapter 18: interest rate swap, exercise of
interest rate swap 4/14
Class video Happy Charter Day 4/19 Class video
chapter 18: currency swap, Goldman sacks and Greece Debt crisis 4/21 Class video
term project Excel Final
Exam on 4/28/2022 on blackboard |
|||||||||||||||||||||||||||||||||||||||||||||||||||||||||||||||||||||||||||||||||||||||||||||||||||||||||||||||||||||||||||||||||||||||||||||||||||||||||||||||||||||||||||||||||||||||||||||||||||||||||||||||||||||||||||||||||||||||||||||||||||||||||||||||||||||||||||||||||||||||||||||||||||||||||||||||||||||||||||||||||||||||||||||||||||||||||||||||||||||||||||||||||||||||||||||||||||||||||||||||||||||||||||||||||||||||||||||||||||||||||||||||||||||||||||||||||||||||||||||||||||||||||||||||||||||||||||||||||||
|
Part I: 2021 Review (from worldbank.com) https://www.worldbank.org/en/news/feature/2021/12/20/year-2021-in-review-the-inequality-pandemic 2021
has shown that the impact of the pandemic is far-reaching and has touched
every possible area of development. With the poor and the vulnerable bearing
the brunt of it, the pandemic is dealing a severe setback to ending poverty
and boosting shared prosperity. But it isn’t all doom and gloom. As the year went on, there were some
positive developments — global economy grew, goods trade rebounded, food
commodity prices have begun to stabilize, and remittances registered a robust
recovery. However, with newer
variants and unequal access to vaccines, there is still more to work to be
done. At
the same time, as some countries are beginning to chart their recovery, it is also an opportunity for them to
achieve lasting economic growth without degrading the environment or
aggravating inequality. The Bank Group is helping countries chart a
recovery that is green, resilient, and inclusive through achieving economic
stability and growth, leveraging the digital revolution, making development
greener and more sustainable, and investing in people. For discussion: ·
Do you think that
the Covid-19 crisis is a temporary shock, or a permanent one? ·
How soon can we
recover from this crisis? ·
Comparing with
financial crisis of 2008, which one is more severe? Uneven Global Recovery
As is the case
with access to vaccines, there is an emerging gap in the economic recovery
between high-income and low- and
middle-income economies. The June edition of the
Global Economic Prospects noted that while the global economy is set to
expand 5.6 percent in 2021—its strongest post-recession pace in 80 years, the
recovery will be uneven. Low-income economies are forecast to expand by only
2.9 percent in 2021, the slowest growth in the past 20 years, other than
2020, partly due to the slow pace of vaccination. An update to the Global
Economic Prospects is expected in January.
High Energy Prices Fueling Rise in
Other Commodity Costs
The picture of
commodity prices isn’t rosy either. According to the latest Commodity Markets
Outlook, energy prices are expected to average more than 80 percent higher in
2021 compared to the previous year.
Since energy
is a critical commodity for food production and heating, these soaring prices
can have downstream implications. Higher energy prices have already affected
fertilizer prices, in turn increasing the cost of food production. However, in
the latter half of 2021, food commodity prices have begun to stabilize in
response to favorable global supply outlook, but they are still above
pre-pandemic levels. Moreover, domestic food price inflation is rising in
most countries, reducing poor people’s ability to afford healthy food. This
can exacerbate food insecurity in developing countries. Unequal Vaccines Access
The quickest
way to end the pandemic is by vaccinating the world. However, with just over 7 percent of people in low-income
countries receiving a dose of the vaccines compared to over 75 percent in
high-income countries, we need fair and broad access to effective and safe
COVID-19 vaccines to save lives and strengthen global economic recovery. World Bank slashes global growth forecast and warns about
growing inequality PUBLISHED TUE, JAN 11
202211:42 PM EST, Saheli Roy Choudhury https://www.cnbc.com/2022/01/12/world-bank-slashes-2022-global-growth-forecast.html
(video as well) KEY POINTS ·
The World Bank
slashed its global growth forecast on Tuesday and cautioned that a rise in inflation, debt and income
inequality could jeopardize the recovery in emerging and developing
economies. ·
Global growth is
expected to slow to 4.1% in 2022 and
3.2% in 2023 as more nations start unwinding unprecedented levels of
fiscal and monetary policy support, the bank said in its latest “Global
Economic Prospects” report. ·
Growth in China is
set to ease to 5.1% this year, partly due to the lingering effects of the
pandemic as well as additional regulatory tightening from Beijing, according
to the report. The World Bank slashed its
global growth forecast for 2022 and 2023, and cautioned that a rise in
inflation, debt and income inequality could jeopardize the recovery in
emerging and developing economies. Global growth is expected to slow to 4.1% in 2022 and 3.2% in
2023 as more nations start unwinding unprecedented levels of fiscal and
monetary policy support to tackle the fallout from the coronavirus pandemic,
the bank said in its “Global Economic Prospects” report on Tuesday. The projections follow a
strong rebound in global growth as demand soared after Covid-related
lockdowns lifted. The World Bank estimated that the world economy grew 5.5%
in 2021. Major economies including the United States, China and countries
in the euro zone are expected to slow down this year,
the bank said. It added that a resurgence in Covid infections, due to the
highly contagious omicron variant, will likely disrupt economic activity in
the near term and could worsen growth projections if it persists. Ongoing supply-chain
bottlenecks, rising inflationary pressures and elevated levels of financial
vulnerability in large parts of the world could increase the risks of a “hard
landing,” the World Bank warned. A hard landing refers to a sharp economic
slowdown following a period of rapid growth. There’s a growing canyon
between [emerging economies’] growth rates and those in advanced economies. The World Bank is the
first major global institution this year to come out with growth projections.
The International Monetary Fund is expected to release its World Economic
Outlook update on Jan. 25, Reuters reported. Growth projections Growth in China is set to ease from an estimated 8% in 2021 to
5.1% this year, partly due to the lingering effects of the pandemic as well as
additional regulatory tightening from Beijing, according to the World Bank. Advanced economies are predicted to slow from 5% in 2021 to 3.8%
in 2022, which the World Bank said will be “sufficient to return
aggregate advanced-economy output to its prepandemic trend in 2023 and thus
complete its cyclical recovery.” On the other hand,
emerging markets and developing economies (EMDEs) are expected to “suffer
substantial scarring to output from the pandemic.” Their growth trajectories
would not be strong enough to return investment or output to pre-pandemic
levels by 2023, according to the report. Developing countries are
struggling with inflation and rising rates, says World Bank President Broadly, EMDEs are predicted to slow from an
estimated 6.3% last year to 4.6% in 2022. For some smaller nations or
even countries that rely heavily on tourism, the economic output is expected
to stay below pre-pandemic levels, the bank said. Worsening inequality The coronavirus pandemic has worsened income inequality,
particularly between countries, the World Bank said. It referred to data that
showed 60% of households surveyed in
EMDEs experienced a loss of income in 2020, while those in low-income
countries and in sub-Saharan Africa were hit the hardest. Inflation, which tends to
hit low-income workers the hardest, is running at levels not seen since 2008,
the bank said. Rising prices will constrain monetary policy where many
emerging and developing economies are withdrawing support to contain
inflation before the growth recovery is complete, it added. The pandemic also pushed
total global debt to the highest level in half a century and it could
complicate future coordinated debt relief efforts, the report said. The World
Bank called for “global cooperation” to help developing economies expand
their financial resources needed for sustainable development. Covid risks Covid-19 continues to cast
a shadow over growth prospects. If variants like omicron persist, it could
further reduce the bank’s global growth projections, according to World Bank
President David Malpass. “Developing countries are
facing severe long-term problems related to lower vaccination rates, global
macro policies and the debt burden,” he said in opening remarks during the
report’s launch. “There’s a growing canyon
between their growth rates and those in advanced economies. This inequality
is even more dramatic in per capita and median income terms, with people in
the developing world left behind and poverty rates rising,” he added. Moderna CEO: We can supply
up to 3 billion Covid vaccine booster doses this year “We’re seeing troubling
reversals in poverty, nutrition, and health.” Malpass also pointed out
that a reversal in education from school closures will have a permanent,
outsized impact on low and middle-income countries. Since early 2020, there
have been more than 300 million reported cases of Covid infections and over
5.5 million people have died. Vaccine rollout has been less than equitable,
with poorer countries struggling to get an adequate supply of doses. Information published by
Our World In Data showed that while 9.49 billion vaccine doses have so far
been administered worldwide, only 8.9% of people in low-income countries have
received at least one dose. Many international
institutions, including the World Bank as well as the World Health
Organization, have called for wider and more equitable distribution of
vaccines in order to bring the pandemic under control. Watch this video on
Netflix Death to 2020 https://www.youtube.com/watch?v=PZjLujzc858 |
|
IMF / World Economic Outlook October
2021 Forecast
https://mediacenter.imf.org/NEWS/imf---world-economic-outlook-october-2021-forecast/s/b81600f3-cb01-47c0-8751-7a10690341af
World
Economic Outlook, October 2021 (video)
The IMF is lowering its global growth
projection for 2021 slightly to 5.9 percent while keeping it unchanged for
2022 at 4.9 percent. However, this modest headline revision masks large
downgrades for some countries the Fund reports in its World Economic Outlook
released Tuesday (October 12) in Washington, DC. “The global recovery continues, but momentum
has weakened, hobbled by the pandemic. We have a slight downward revision for
global growth for this year to 5.9 percent for next year, our projection
remains unchanged at 4.9 percent. The divergences in growth prospects across
countries, however, persist and remains a major concern,” said Gita Gopinath,
Economic Counsellor and Director of the Research Department at the
International Monetary Fund Gopinath added that risks to economic
prospects have increased and policy trade-offs have become more complex in
the ongoing Covid-19 pandemic. Monetary policy will need to walk a fine line
between tackling inflation and financial risks and supporting the economic
recovery. “One of the major risks remains that there
could be new variants of the virus that could further slow back the recovery.
We're seeing major supply disruptions around the world that are also feeding
inflationary pressures, which are quite high and financial risk taking also is
increasing, which poses an additional risk to the outlook,” explained
Gopinath. The dangerous divergence in economic prospects
across countries remains a major concern. These divergences are a consequence
of the ‘great vaccine divide’ and large disparities in policy support. “The foremost priority is to vaccinate the
world. Much greater multilateral action is needed to vaccinate at least 40
percent of the population in every country by the end of this year and 70
percent by the middle of next year. We also need much greater action to
address climate change. Individual countries will need to tailor their fiscal
and monetary policy to the country's specific conditions, to the health
conditions in their country, to their economic conditions, while also maintaining
the credibility of their fiscal and monetary frameworks,” said Gopinath. |
||||||||||||||||||||||||||||||||||||||||||||||||||||||||||||||||||||||||||||||||||||||||||||||||||||||||||||||||||||||||||||||||||||||||||||||||||||||||||||||||||||||||||||||||||||||||||||||||||||||||||||||||||||||||||||||||||||||||||||||||||||||||||||||||||||||||||||||||||||||||||||||||||||||||||||||||||||||||||||||||||||||||||||||||||||||||||||||||||||||||||||||||||||||||||||||||||||||||||||||||||||||||||||||||||||||||||||||||||||||||||||||||||||||||||||||||||||||||||||||||||||||||||||||||||||||||||||||||||||
|
Part II In class exercise – convert currencies
back and forth If the dollar is pegged to gold at US $1800 = 1
ounce of gold and the British pound is pegged to gold at £1200 = 1 ounce of
gold. What should be the exchange rate between US$ and British £? How much
can you make without any risk if the exchange rate is 1£ = 2$? Assume that
your initial investment is $1800. What about the exchange rate set
at 1£ = 1.2$? What about your initial investment is £1200? Solution: 1£ = 2$ (note
that the exchange rate is set at 1£ = 1.5$ since $1800 = £1500=1 ounce of
gold $1.5=1£). With $1800, you can buy 1 ounce of gold at US $1800
= 1 ounce of gold. With one ounce of gold, you can sell
it in UK at £1200 = 1 ounce of gold, so you can get back £1200 convert
£ to $ at $2=1£ as given get back £1200 * 2$/£ = $2400
> $1800, initial investment you
could make a profit of $600 ($2400 - $1800=$600) Yes. 1£ = 1.2$ (note
that the exchange rate is set at 1£ = 1.5$ since $1800 = £1500=1 ounce of
gold $1.5=1£). With
$1800, you can buy either 1 ounce of gold at US $1800 = 1 ounce of
gold. With
one ounce of gold, you can sell it in UK at £1200 = 1 ounce of gold, so you
can get back £1200 convert £ to $ at $1.2=1£ as
given get
back £1200 * 1.2$/£ = $1440 < $1800 you
will lose $360 ($1440 - $1800=$-360) No. So
should convert to £ first and then buy gold in UK With
$1800, you can convert to £1500 ($1800 / (1.2$/£ = £1500 ). buy
gold in UK at £1200 = 1 ounce of gold, so you can get back £1500/£1200 = 1.25
ounce of gold Sell gold in US
at US $1800 = 1 ounce of gold So
get back 1.25 ounce of gold * $1800 = $2250 > $1800 you
will make a profit of $450 ($2250 - $1800=$450) Yes. Homework chapter1-1 (due with first
midterm exam) 1. If
the dollar is pegged to gold at US $1800 = 1 ounce of gold and the British
pound is pegged to gold at €1500 = 1 ounce of gold. What should be the
exchange rate between US$ and Euro €? How much can you make without any risk
if the exchange rate is 1€ = 1.5$? (hint: $1800 è get gold è sell gold for euro è convert euro back to
$) How much can you make without any
risk if the exchange rate is 1€ = 0.8$? (hint: $1800 è get euro è buy gold using euro è sell gold for $) Assume
that your initial investment is $1800. (answer: $1.2/euro,
$450, $900) |
|
|
||||||||||||||||||||||||||||||||||||||||||||||||||||||||||||||||||||||||||||||||||||||||||||||||||||||||||||||||||||||||||||||||||||||||||||||||||||||||||||||||||||||||||||||||||||||||||||||||||||||||||||||||||||||||||||||||||||||||||||||||||||||||||||||||||||||||||||||||||||||||||||||||||||||||||||||||||||||||||||||||||||||||||||||||||||||||||||||||||||||||||||||||||||||||||||||||||||||||||||||||||||||||||||||||||||||||||||||||||||||||||||||||||||||||||||||||||||||||||||||||||||||||||||||||||||||||||||||||||||
|
Part
III: Multilateral Trade vs. Bilateral Trade What is
MULTILATERALISM? What does MULTILATERALISM mean? MULTILATERALISM meaning
& explanation (youtube)
What is
BILATERAL TRADE? What does BILATERAL TRADE mean? BILATERAL TRADE meaning
& explanation (youtube)
Take
away: Multilateral
trade agreements strengthen the global economy by making developing countries
competitive. They
standardize import and export procedures giving economic benefits to all
member nations. Their
complexity helps those that can take advantage of globalization, while those
who cannot often face hardships. For
class discussion: Do you agree with the above points?
Why or why not? Multilateral Trade Agreements With Their Pros, Cons and
Examples
5 Pros and 4 Cons to the World's
Largest Trade Agreements https://www.thebalance.com/multilateral-trade-agreements-pros-cons-and-examples-3305949 BY REVIEWED BY Updated October 28, 2020 Multilateral trade
agreements are commerce treaties among three or more nations. The
agreements reduce tariffs and make
it easier for businesses to import and export. Since they are
among many countries, they are difficult to negotiate. That same broad scope makes them more
robust than other types of trade agreements once all
parties sign. Bilateral agreements are
easier to negotiate but these are only between two countries. They don't
have as big an impact on economic growth as does a multilateral
agreement. 5 Advantages of multilateral
agreements · Multilateral
agreements make all signatories treat each other equally. No country can
give better trade deals to one country than it does to another. That
levels the playing field. It's especially critical for emerging
market countries. Many of them are smaller in
size, making them less competitive. The Most
Favored Nation Status confers the
best trading terms a nation can get from a trading partner. Developing
countries benefit the most from this trading status. · The
second benefit is that it increases trade for every participant. Their
companies enjoy low tariffs. That makes their exports
cheaper. · The
third benefit is it standardizes commerce regulations for
all the trade partners. Companies save legal costs since they follow the same
rules for each country. · The
fourth benefit is that countries can negotiate trade deals with
more than one country at a time. Trade agreements undergo
a detailed approval process. Most countries would prefer to get one
agreement ratified covering many countries at once. · The
fifth benefit applies to emerging markets. Bilateral trade agreements
tend to favor the country with the best economy. That puts the weaker nation
at a disadvantage. But making emerging markets stronger helps the developed
economy over time. As those emerging markets become
developed, their middle class population increases. That creates
new affluent customers for everyone. 4 Disadvantages of multilateral
trading · The
biggest disadvantage of multilateral agreements is that they are
complex. That makes them difficult and time consuming to
negotiate. Sometimes the length of negotiation means it won't take place
at all. · Second,
the details of the negotiations are particular to trade and business practices.
The public often misunderstands them. As a result, they receive lots of
press, controversy, and protests. · The
third disadvantage is common to any trade agreement. Some companies and
regions of the country suffer when trade borders disappear. · The
fourth disadvantage falls on a country's small businesses. A
multilateral agreement gives a competitive advantage to giant
multi-nationals. They are already familiar with operating in a
global environment. As a result, the small firms can't compete. They lay off
workers to cut costs. Others move their factories to countries with a
lower standard of living. If a region depended on that industry, it
would experience high unemployment rates. That makes multilateral
agreements unpopular. Pros
Cons
Examples Some regional trade
agreements are multilateral. The largest had been the North American
Free Trade Agreement (NAFTA), which was ratified on
January 1, 1994. NAFTA quadrupled trade between the United
States, Canada, and Mexico from its 1993 level to
2018. On July 1, 2020, the U.S.-Mexico-Canada Agreement (USMCA) went
into effect. The USMCA was a new trade agreement between the three countries
that was negotiated under President Donald Trump. The Central American-Dominican
Republic Free Trade Agreement was signed on August 5, 2004. CAFTA-DR
eliminated tariffs on more than 80% of U.S. exports to six countries: Costa
Rica, the Dominican Republic, Guatemala, Honduras, Nicaragua, and El
Salvador. As of November 2019, it had increased trade by 104%, from
$2.44 billion in January 2005 to $4.97 billion. The Trans-Pacific
Partnership would have been bigger than NAFTA.
Negotiations concluded on October 4, 2015. After becoming
president, Donald Trump withdrew from the agreement. He promised to
replace it with bilateral agreements. The TPP was between
the United States and 11 other countries bordering the Pacific
Ocean. It would have removed tariffs and standardized business
practices. All global trade agreements
are multilateral. The most successful one is the General
Agreement on Trade and Tariffs. Twenty-three countries signed GATT in
1947. Its goal was to reduce tariffs and other trade barriers. In September 1986, the Uruguay
Round began in Punta del Este, Uruguay. It centered on extending
trade agreements to several new areas. These included services and
intellectual property. It also improved trade in agriculture and
textiles. The Uruguay Round led to the creation of the World Trade
Organization. On April 15, 1994, the 123 participating governments
signed the agreement creating the WTO in Marrakesh, Morocco. The
WTO assumed management of future global multilateral negotiations. The WTO's first project
was the Doha round of
trade agreements in 2001. That was a
multilateral trade agreement among all WTO members. Developing countries
would allow imports of financial services, particularly banking. In so
doing, they would have to modernize their markets. In return, the developed
countries would reduce farm subsidies. That would boost the growth
of developing countries that were good at producing food. Farm lobbies in the United States and
the European Union doomed
Doha negotiations. They refused to agree to lower subsidies or accept
increased foreign competition. The WTO abandoned the Doha round in July 2008. On December 7, 2013, WTO
representatives agreed to the so-called Bali package. All countries
agreed to streamline customs standards and reduce red tape to expedite
trade flows. Food security is an issue. India wants to subsidize food so
it could stockpile it to distribute in case of famine. Other countries worry
that India may dump the cheap food in the global market to gain market
share. Bilateral
Trade By JULIA KAGAN Updated December 21,
2020, Reviewed by TOBY WALTERS, Fact checked by ARIEL COURAGE https://www.investopedia.com/terms/b/bilateral-trade.asp What Is Bilateral Trade? Bilateral
trade is the exchange of goods between two nations promoting trade and
investment. The two countries will
reduce or eliminate tariffs, import quotas, export restraints, and other
trade barriers to encourage trade and investment. In the United States, the Office of
Bilateral Trade Affairs minimizes trade deficits through negotiating free
trade agreements with new countries, supporting and improving existing trade
agreements, promoting economic development abroad, and other actions. KEY TAKEAWAYS ·
Bilateral trade
agreements are agreements between countries to promote trade and commerce. ·
They eliminate trade
barriers such as tariffs, import quotas, and export restraints in order to
encourage trade and investment. ·
The main advantage
of bilateral trade agreements is an expansion of the market for a country's
goods through concerted negotiation between two countries. ·
Bilateral trade agreements can also result in the closing
down of smaller companies unable to compete with large multinational
corporations. Understanding Bilateral Trade The goals of bilateral trade
agreements are to expand access between two countries’ markets and increase
their economic growth. Standardized business operations in five general areas
prevent one country from stealing another’s innovative products, dumping
goods at a small cost, or using unfair subsidies. Bilateral
trade agreements standardize regulations, labor standards, and environmental
protections. The
United States has signed bilateral trade agreements with 20 countries,
some of which include Israel, Jordan, Australia, Chile, Singapore, Bahrain,
Morocco, Oman, Peru, Panama, and Colombia. The Dominican Republic-Central America
FTR (CAFTA-DR) is a free trade agreement signed between the United States and
smaller economies of Central America, as well as the Dominican Republic.
The Central American countries are El Salvador, Guatemala, Costa Rica,
Nicaragua, and Honduras. NAFTA replaced the bilateral agreements with Canada
and Mexico in 1994. The U.S. renegotiated NAFTA under the United
States-Mexico-Canada Agreement, which went into effect in 2020.2 Advantages and Disadvantages of
Bilateral Trade Compared to multilateral trade
agreements, bilateral trade agreements
are negotiated more easily, because only two nations are party to the
agreement. Bilateral trade agreements initiate and reap trade benefits faster
than multilateral agreements. When negotiations for a multilateral
trade agreement are unsuccessful, many nations will negotiate bilateral
treaties instead. However, new agreements often result in competing
agreements between other countries, eliminating the advantages the Free Trade
Agreement (FTA) confers between the original two nations. Bilateral trade agreements also expand
the market for a country's goods. The United States vigorously pursued free
trade agreements with a number of countries under the Bush administration
during the early 2000s. In addition to creating a market for
U.S. goods, the expansion helped spread the mantra of trade liberalization
and encouraged open borders for trade. However, bilateral trade agreements can skew a country's markets when large
multinational corporations, which have significant capital and resources to
operate at scale, enter a market dominated by smaller players. As a
result, the latter might need to close shop when they are competed out of
existence. Examples of Bilateral Trade In October 2014, the United States and
Brazil settled a longstanding cotton dispute in the World Trade Organization
(WTO). Brazil terminated the
case, relinquishing its rights to countermeasures against U.S. trade or
further proceedings in the dispute. Brazil also agreed to not bring new
WTO actions against U.S. cotton support programs while the current U.S. Farm
Bill was in force, or against agricultural export credit guarantees under the
GSM-102 program. Because of the agreement, American businesses were no longer
subject to countermeasures such as increased tariffs totaling hundreds of
millions of dollars annually. In March 2016, the U.S. government and
the government of Peru reached an agreement removing barriers for U.S. beef
exports to Peru that had been in effect since 2003. The agreement opened one of the
fastest-growing markets in Latin America. In 2015, the United States exported
$25.4 million in beef and beef products to Peru. Removal of Peru’s
certification requirements, known as the export verification program, assured
American ranchers expanded market access. The agreement reflected the U.S.
negligible risk classification for bovine spongiform encephalopathy (BSE) by
the World Organization for Animal Health (OIE). The United States and Peru agreed to
amendments in certification statements making beef and beef products from
federally inspected U.S. establishments eligible for export to Peru, rather
than just beef and beef products from establishments participating in the
USDA Agricultural Marketing Service (AMS) Export Verification (EV) programs
under previous certification requirements. Homework chapter1-2 (due with first
midterm exam) 1)
Do you support
bilateral trading or multi-lateral trading? Why? 2)
What is your opinion
about RCEP? Do you think that the member countries can benefit from RCEP? Why
or why not? |
|
What is the
RCEP? | CNBC Explains (youtube)
China and 14
partners sign world's biggest trade deal without US | DW News (video)
RCEP Trade Deal: Significance of Massive Asia
Pacific Pact Sometimes who is not at the party matters as
much as who is By JAMES CHEN Published November 25, 2020 https://www.investopedia.com/rcep-trade-deal-significance-of-massive-asia-pacific-pact-5088935 Trade deals are
economically significant and have a real impact when companies use them to
access previously limited markets, but they are a political creation with
economic implications that are not usually seen immediately after
implementation. The Regional Comprehensive Economic Partnership (RCEP) is no
different in that it will take years to know which countries and companies
have benefited most from this political deal. What is important to
investors to note, however, is that RCEP is now the second major trade
deal focusing on Asia being signed without the United States. In this
article, we'll look at RCEP, why it matters, and what it may be signaling for
the future of global trade. KEY TAKEAWAYS · RCEP is the second major trade deal in Asia to take place without any
U.S. involvement. · China is seen as the crown jewel of the RCEP and is the largest economy
among the signatories. · The RCEP agreement is not as comprehensive as the Comprehensive and
Progressive Agreement for Trans-Pacific Partnership (CPTPP) in harmonizing
economic philosophies on issues like labor and environment. Overview of RCEP The RCEP comprises
15 countries, including seven that were part of the CPTPP. The countries that
signed the deal on Nov. 15 are: Australia (CPTPP
member) Brunei (CPTPP
member) Cambodia China Indonesia Japan (CPTPP member) Laos Malaysia (CPTPP
member) Myanmar New Zealand (CPTPP
member) Philippines Singapore (CPTPP
member) South Korea Thailand Vietnam (CPTPP
member) India was
initially part of the RCEP but has since pulled out. It should be noted that the
door is open for the country to join later. The deal covers roughly one-third
of the world's population and just under one-third of global GDP. The
Brookings Institute estimates that the deal will increase global GDP by $500
billion in the next 10 years, but estimates vary widely as with all trade
deals. Most agree that the RCEP has the potential to add well over $100
billion to national incomes within the trading block. What Makes RCEP
Different Despite having seven
CPTPP members as part of the RCEP, the RCEP is a different type of trade
deal. The CPTPP went a long way to harmonize key points such as intellectual
property, environment, labor, and rules around state-owned enterprises. All
these areas in the CPTPP required higher standards among many signatories in
order to enjoy freer trade with other members. The RCEP is silent on almost
all of these points, which has been spun as a direct influence of having
China involved as the largest, and arguably key, economy. Even if this is a
sign of China's influence, the biggest win for members of the RCEP is
having reduced tariffs on products that are sourced within the trading
block. This means, for example, that a Japanese-designed car pulling in parts
from South Korea and assembled in China can be sold in Australia without
triggering tariffs based on third-country content. This sets up an incentive
for the RCEP members to source more freely within their region, which should
result in them trading more freely in general. The Layers of Trade
Agreements in Asia Pacific The world of
bilateral and multilateral trade agreements requires more than a few
whiteboards to map out. The RCEP is China's first multilateral agreement, but
the country has a number of bilateral trade agreements, including with
Australia – a country that, along with New Zealand, has a deal with every
other country in the RCEP. In these cases, the
countries with more developed bilateral agreements generally keep the deeper
trade ties but respect the new unified sourcing rules under the RCEP. In this
sense, the RCEP still removes a country-of-origin headache from regionally
sourced supply chains. Leadership May be
Shifting East The CPTPP and RCEP
are both deals that, judging solely on membership location, tilt toward Asia.
Most importantly, these do not involve the United States. The United States
has signed the United-States-Mexico-Canada Agreement (USMCA) that replaced
NAFTA recently, but the last free trade agreement other than that was signed
with Panama in 2007. The United States' 14 free trade
agreements encompass 20 countries, but only three of these countries are also
members of RCEP. The exit of the United States from the CPTPP
represented a pull back for a country that once was a global champion of free
trade. The inclusion of China in RCEP and the absence of the United States
suggests that the Asia Pacific region is moving ahead on its own. The deals may be
less comprehensive, but they are still getting done. The Bottom Line RCEP members will benefit from lower tariffs
on products sourced and traded in the region, making the ties between these
countries deeper. The larger economies like China, Japan, South Korea, and
Australia will likely benefit the most at first, but the whole region will
see more income over time in the form of regional sourcing. The most important
takeaway, however, is that the United States may be losing its global
leadership on trade to nations within the Asia Pacific region. Of course,
this situation can be reversed – the door is still open for the United States
on the CPTPP, for example – and the hopes are high that an incoming Biden
administration will do just that. Whether that reversal takes place or not is
another loaded question facing the global economy in 2021. Rust Belt https://www.investopedia.com/terms/r/rust-belt.asp (FYI) By JAMES CHEN Updated Aug 25, 2020 What Is the Rust Belt? The Rust Belt is a colloquial term used to
describe the geographic region stretching from New York through the Midwest
that was once dominated by the coal industry, steel production,
and manufacturing. The Rust Belt became an industrial hub due to its proximity to
the Great Lakes, canals, and rivers, which allowed companies to
access raw materials and ship out finished products. The region received the name Rust Belt in the
late 1970s, after a sharp decline in industrial work left many
factories abandoned and desolate, causing increased rust from exposure to the
elements. It is also referred to as the Manufacturing Belt and the
Factory Belt. KEY TAKEAWAYS
Understanding the Rust Belt The term Rust Belt is often used in a derogatory sense to
describe parts of the country that have seen an economic decline—typically
very drastic. The rust belt region
represents the deindustrialization of an area, which is often accompanied
by fewer high-paying jobs and high poverty rates. The result has been a
change in the urban landscape as the local population has moved to other
areas of the country in search of work. Although there is no definitive boundary, the states that are
considered in the Rust Belt–at least partly–include the following:
There are other states in the U.S. that have also experienced
declines in manufacturing, such as states in the deep south, but they are not
usually considered part of the Rust Belt. The region was home to some of
America's most prominent industries, such as steel production
and automobile manufacturing. Once recognized as the industrial
heartland, the region has experienced a sharp downturn in industrial activity
from the increased cost of domestic labor, competition from overseas,
technology advancements replacing workers, and the capital
intensive nature of manufacturing. Poverty in the Rust Belt Blue-collar jobs have increasingly moved
overseas, forcing local governments to rethink the type of manufacturing
businesses that can succeed in the area. While some cities managed to adopt new technologies, others
still struggle with rising poverty levels and declining populations. Below are the poverty rates from the U.S. Census
Bureau as of 2018 for each of the Rust Belt states listed above. Poverty Rates in the Rust Belt. There are other U.S. states that have high poverty rates, such
as Kentucky (16.9%), Louisiana (18.6%), and Alabama (16.8%). However, the
rust belt states have–at a minimum–a double-digit percentage of their
population in poverty.1 History of the Rust Belt Before being known as the Rust Belt, the area was generally
known as the country's Factory, Steel, or Manufacturing Belt. This area, once
a booming hub of economic activity, represented a great portion of U.S.
industrial growth and development. The natural resources that were found in the area led to its
prosperity—namely coal and iron ore—along with labor and ready access to
transport by available waterways. This led to the rise in coal and steel
plants, which later spawned the weapons, automotive, and auto parts
industries. People seeking employment began moving to the area, which was
dominated by both the coal and steel industries, changing the overall
landscape of the region. But that began to change between the 1950s and 1970s. Many
manufacturers were still using expensive and outdated equipment and
machinery and were saddled with the high costs of domestic labor and
materials. To compensate, a good portion of them began looking elsewhere for
cheaper steel and labor—namely from foreign sources—which would ultimately
lead to the collapse of the region. There is no definitive boundary for the Rust
Belt, but it generally includes the area from New York through the Midwest. Decline of the Rust Belt Most research suggests the Rust Belt started to falter in the
late 1970s, but the decline may have started earlier, notably in the 1950s,
when the region's dominant industries faced minimal competition.
Powerful labor unions in the automotive and steel manufacturing
sectors ensured labor competition stayed to a minimum. As a result, many of
the established companies had very little incentive to innovate or expand
productivity. This came back to haunt the region when the United States
opened trade overseas and shifted manufacturing production to the south. By the 1980s, the Rust Belt faced competitive
pressure—domestically and overseas—and had to ratchet down wages and prices. Operating in
a monopolistic fashion for an extended period of time played an
instrumental role in the downfall of the Rust Belt. This shows that
competitive pressure in productivity and labor markets are important to
incentivize firms to innovate. However, when those incentives are weak,
it can drive resources to more prosperous regions of the country. The region's population also showed a rapid
decline. What was once a hub
for immigrants from the rest of the country and abroad, led to an exodus of
people out of the area. Thousands of
well-paying blue-collar jobs were eliminated, forcing people to move away in
search of employment and better living conditions. Politics and the Rust Belt The term Rust Belt is generally attributed to Walter Mondale,
who referred to this part of the country when he was the Democratic
presidential candidate in 1984. Attacking President Ronald Reagan, Mondale
claimed his opponent's policies were ruining what he called the Rust
Bowl. He was misquoted by the media as saying the rust belt, and the term
stuck. Since then, the term has consistently been used to describe the area's
economic decline. From a policy perspective, addressing the specific needs of the
Rust Belt states was a political imperative for both parties during the 2016
election. Many believe the national
government can find a solution to help this failing region succeed again. |
||||||||||||||||||||||||||||||||||||||||||||||||||||||||||||||||||||||||||||||||||||||||||||||||||||||||||||||||||||||||||||||||||||||||||||||||||||||||||||||||||||||||||||||||||||||||||||||||||||||||||||||||||||||||||||||||||||||||||||||||||||||||||||||||||||||||||||||||||||||||||||||||||||||||||||||||||||||||||||||||||||||||||||||||||||||||||||||||||||||||||||||||||||||||||||||||||||||||||||||||||||||||||||||||||||||||||||||||||||||||||||||||||||||||||||||||||||||||||||||||||||||||||||||||||||||||||||||||||||
|
Chapter 2 Let’s watch this video together. Imports, Exports,
and Exchange Rates: Crash Course Economics #15 Topic
1- What is BOP? The balance of payment of a country contains two
accounts: current and capital. The current account records exports and imports of goods and services
as well as unilateral transfers, whereas the capital account records purchase and sale transactions of foreign
assets and liabilities during a particular year. What
is the current account? Balance
of payments: Current account (video, Khan academy)
From
khan academy
Current vs. Capital Accounts: What's the
Difference? By
THE INVESTOPEDIA TEAM, Updated June
29, 2021, Reviewed by ROBERT C. KELLY Current
vs. Capital Accounts: An Overview The
current and capital accounts represent two halves of a nation's balance of
payments. The current account
represents a country's net income over a period of time, while the capital
account records the net change of assets and liabilities during a particular
year. In
economic terms, the current account deals with the receipt and payment in
cash as well as non-capital items, while the capital account reflects sources
and utilization of capital. The sum of
the current account and capital account reflected in the balance of payments
will always be zero. Any surplus or deficit in the current account is matched
and canceled out by an equal surplus or deficit in the capital account. KEY
TAKEAWAYS ·
The current and
capital accounts are two components of a nation's balance of payments. ·
The current account
is the difference between a country's savings and investments. ·
A country's capital
account records the net change of assets and liabilities during a certain
period of time. Current Account The
current account deals with a country's short-term transactions or the
difference between its savings and investments. These are also referred to as
actual transactions (as they have a real impact on income), output and
employment levels through the movement of goods and services in the economy. The current account consists of visible trade
(export and import of goods), invisible trade (export and import of services),
unilateral transfers, and investment income (income from factors such as land
or foreign shares). The credit and debit of foreign exchange from these
transactions are also recorded in the balance of the current account. The
resulting balance of the current account is approximated as the sum total of
the balance of trade. Current Account vs. Capital Account Transactions
are recorded in the current account in the following ways: Exports are noted as credits in the balance
of payments Imports are recorded as debits in the
balance of payments The
current account gives economists and other analysts an idea of how the country
is faring economically. The difference
between exports and imports, or the trade balance, will determine whether a
country's current balance is positive or negative. When it is positive, the
current account has a surplus, making the country a "net lender" to
the rest of the world. A deficit means the current account balance is
negative. In this case, that country is considered a net borrower. If
imports decline and exports increase to stronger economies during a
recession, the country's current account deficit drops. But if exports
stagnate as imports grow when the economy grows, the current account deficit
grows. Capital Account The capital account is a record of the
inflows and outflows of capital that directly affect a nation’s foreign
assets and liabilities. It is concerned
with all international trade transactions between citizens of one country and
those in other countries. The
components of the capital account include foreign investment and loans,
banking, and other forms of capital, as well as monetary movements or changes
in the foreign exchange reserve. The capital account flow reflects factors
such as commercial borrowings, banking, investments, loans, and capital. A surplus in the capital account means
there is an inflow of money into the country, while a deficit indicates money
moving out of the country. In this case,
the country may be increasing its foreign holdings. In
other words, the capital account is concerned with payments of debts and
claims, regardless of the time period. The balance of the capital account
also includes all items reflecting changes in stocks. The
International Monetary Fund divides capital account into two categories: The
financial account and the capital account. The term capital account is also used in accounting. It
is a general ledger account used to record the contributed capital of
corporate owners as well as their retained earnings. These balances are
reported in a balance sheet's shareholder's equity section. https://www.bea.gov/data/intl-trade-investment/international-transactions U.S. Current-Account Deficit Widens in Third
Quarter 2021 https://www.bea.gov/news/blog/2021-12-20/us-current-account-deficit-widens-third-quarter-2021#:~:text=The%20U.S.%20current%2Daccount%20deficit,the%20third%20quarter%20of%202021 December 20,
2021 The U.S. current-account deficit, which reflects
the combined balances on trade in goods and services and income flows between
U.S. residents and residents of other countries, widened by $16.5 billion, or
8.3 percent, to $214.8 billion in the third quarter of 2021. The widening
reflected a reduced surplus on services and expanded deficits on secondary
income and on goods that were partly offset by an expanded surplus on primary
income. The
third-quarter deficit was 3.7 percent of current-dollar gross domestic
product, up from 3.5 percent in the second quarter.
COVID-19 Impact on Third-Quarter 2021 International
Transactions (FYI) https://www.bea.gov/news/2021/us-international-transactions-third-quarter-2021 Current-Account Transactions Exports of goods and services to, and income
received from, foreign residents increased $22.8 billion to $955.9 billion in
the third quarter. Imports of goods and services from, and income paid to,
foreign residents increased $39.3 billion to $1.17 trillion.
Trade in goods Exports of goods increased $4.8 billion to
$441.6 billion, mainly reflecting increases in industrial supplies and
materials, mostly natural gas and petroleum and products, and in consumer
goods, mostly medicinal, dental, and pharmaceutical products. A decrease in
foods, feeds, and beverages, mostly corn and soybeans, partly offset these
increases. Imports of goods increased $10.0 billion to $716.4 billion,
primarily reflecting an increase in industrial supplies and materials, mostly
petroleum and products and chemicals. Trade in services Exports of services decreased $0.1 billion
to $190.8 billion, primarily reflecting decreases in charges for the use of
intellectual property, mostly licenses for the use of outcomes of research
and development (such as patents and trade secrets), and in
telecommunications, computer, and information services, mostly computer
services. An increase in other business services, mostly professional and
management consulting services, partly offset these decreases. Imports of
services increased $12.6 billion to $141.0 billion, mostly reflecting
increases in travel, primarily other personal travel, and in transport,
primarily sea freight and air passenger transport. Primary income Receipts of primary income increased $17.9
billion to $281.9 billion, mainly reflecting increases in direct investment
income, primarily earnings, and in portfolio investment income, mostly equity
securities. Payments of primary income increased $8.6 billion to $233.7
billion, primarily reflecting an increase in portfolio investment income,
mostly interest on long-term debt securities. Secondary income Receipts of secondary income increased $0.1
billion to $41.6 billion, reflecting an increase in general government
transfers, mainly taxes on income and wealth. Payments of secondary income
increased $8.0 billion to $79.6 billion, mainly reflecting an increase in
general government transfers, mostly international cooperation. Capital-Account Transactions Capital-transfer receipts were $3.8 billion
in the third quarter. The transactions reflected receipts from foreign
insurance companies for losses resulting from Hurricane Ida Financial-Account Transactions Net financial-account transactions were
–$127.2 billion in the third quarter, reflecting net U.S. borrowing from
foreign residents. Financial assets Third-quarter transactions increased U.S. residents’
foreign financial assets by $494.1 billion. Transactions increased portfolio
investment assets, mainly debt securities, by $311.7 billion; reserve assets,
primarily special drawing rights (SDRs), by $112.6 billion; and direct
investment assets, mostly equity, by $98.2 billion. Transactions decreased
other investment assets, mostly deposits, by $28.5 billion. The increase in
SDRs reflects the U.S. share of the $650 billion SDR allocation approved by
the Board of Governors of the International Monetary Fund (IMF). The SDR is
an international reserve asset created by the IMF to supplement its member
countries’ official reserves; it can be exchanged between members for
currencies, such as the U.S. dollar, the euro, or the yen. The allocation in
the third quarter was the largest in the history of the IMF. Liabilities Third-quarter transactions increased U.S.
liabilities to foreign residents by $613.3 billion. Transactions increased
other investment liabilities, mostly deposits and SDR allocations, by $318.0
billion; direct investment liabilities, mostly equity, by $149.1 billion; and
portfolio investment liabilities, primarily equity, by $146.2 billion. The
SDR allocation liability represents the long-term obligation of each IMF
member country holding SDRs to all other members. In an SDR allocation, the
incurrence of U.S. liabilities offsets the acquisition of U.S. assets so the
SDR allocation has no impact on the net financial-account transactions.
What is the Capital Account
Balance of
payments: Capital account (video, Khan Academy) https://fred.stlouisfed.org/tags/series?t=capital+account Top Trading Partners - November 2021 https://www.census.gov/foreign-trade/statistics/highlights/toppartners.html
Year-to-Date Surpluses
Year-to-Date Deficit
Topic 2: Trade war with China to
reduce trade deficit (current account deficit) For Class Discussion: Has the US won the trade war against
China? Can trade war help reduce the US current account deficit? America v China: why the trade war won't end soon | The Economist (youtube)
Has the US lost the trade war with China? (youtube)
US-China trade deficit skyrockets | DW News (youtube)
2021
: U.S. trade in goods with China
NOTE:
All figures are in millions of U.S. dollars on a nominal basis. https://www.census.gov/foreign-trade/balance/c5700.html
U.S. tariffs on
Chinese goods didn’t bring companies back to the U.S., new research finds These tariffs instead resulted in collateral damage to the
U.S. economy By Jiakun Jack Zhang and Samantha A. Vortherms, September
22, 2021 at 5:00 a.m. EDT Treasury Secretary Janet L. Yellen recently argued that tariffs from the U.S.-China trade war —
covering more than $307 billion worth of goods — “hurt American consumers,”
yet the negotiations “really didn’t address in many ways the fundamental
problems we have with China.” U.S. tariffs on
Chinese exports jumped sixfold between 2018 and 2020, but tariffs failed to decouple the two economies. As the Biden
administration conducts its comprehensive review of China trade policy and
contemplates new tariffs, our research helps explain whether existing tariffs
achieved their policy objective. Tariffs increase the
cost of doing business overseas by making those goods more expensive to
import. The Trump administration’s logic was that tariffs would hurt U.S. and
other multinational corporations engaged in U.S.-China trade — and push more
companies to divest from China and shift supply chains to the United States. Tariff proponents
argued the Chinese economy would suffer, giving U.S. negotiators more
leverage over China at the negotiating table. Fear of ‘terrorism’ shaped U.S. foreign policy after 9/11.
Will the U.S. make China the next big obsession? In fact, these
tariffs resulted in collateral damage to the U.S. economy without pressuring
China to change its economic policies. Here’s why. The U.S. hoped to see
multinationals walk away from China. In a recent working paper, we built a new data set on foreign-invested
enterprises registered in China to identify multinationals that choose to
divest each year. We found that new
U.S. tariffs in 2018 and 2019 had a minimal effect on divestment. More
than 1,800 U.S.-funded subsidiaries closed in the first year of the trade
war, a 46 percent increase over the previous year. U.S. company exits
immediately after the onset of the trade war were not concentrated in
manufacturing or information technology, two sectors most directly affected
by the trade war. We estimate that
less than 1 percent of the increase in U.S. firm exits during this period was
due to U.S. tariffs. And U.S. firms were no more likely to divest than
firms from Europe or Asia. Instead, company exits were driven more by the
company’s capacity to mitigate political risk. Larger and older multinational were significantly less likely to exit
China after the onset of the trade war. These findings may surprise politicians, but are fully in
line with recent research explaining how tariffs pass through to U.S.
consumers. Rather than leaving China
or finding alternative suppliers, U.S. firms simply raised prices for their
customers. Survey data show large
U.S. businesses remain optimistic about the Chinese market and plan to
increase their investments there. Most of these firms are already “In
China, for China” — those that are exposed to tariffs are taking advantage of
workarounds such as the first sale rule or passing on costs to suppliers. Tariffs provided little leverage — for either country If U.S. multinationals aren’t rushing to exit China, are
they pressuring the U.S. government for tariff relief, as the Chinese
government hoped? Many analysts believed the U.S. business community would
push back, and stop the trade war from escalating. We investigated the
political behavior of a sample of 500 large U.S. multinationals with
subsidiaries in China to see if they engaged in political activities such as
commenting, testifying or lobbying in opposition to the U.S. Section 301
tariffs. We found that most U.S. companies adopted an apolitical
strategy. They didn’t exit China, but
also didn’t put public pressure on Washington to roll back the tariffs.
Even though 63 percent of U.S. multinationals in our sample were adversely
impacted by the trade war, only 22 percent chose to voice opposition and 7
percent chose to exit China. The majority (65 percent) did neither. The U.S. and China finally signed a trade agreement. Who
won? Many of the
multinationals we coded as “voicing opposition” did so through associations
such as the US-China Business Council rather than under their own name. An even larger number unsuccessfully lobbied for tariff
exclusion for specific products, rather than a more general rollback of
Section 301 tariffs. Smaller businesses saw greater collateral damage Our findings suggest
that U.S. companies aren’t divesting from China as much as U.S. policymakers
would like — or pushing back against tariffs as much as Chinese policymakers
had hoped. Instead, large
companies responded to the increased cost of business by passing the cost of
tariffs on to their customers. And individual consumers in the United States
paid higher prices for imports from China. Smaller companies and
those newer to China were more likely to exit. Firms with older and larger
subsidiaries in China face higher sunk costs from leaving China altogether,
which makes them more likely to continue China operations. This finding parallels reports about small businesses in
the United States who were unable to find alternative suppliers or afford
expensive lobbyists during the trade war. The higher tariffs on raw materials imported from China made it
tougher for some small businesses, particularly if they lacked the leverage
to pass these costs on to customers or the resources to mitigate them. Would other trade tools work? Despite intensifying political hostility between Beijing
and Washington and the mounting economic cost of tariffs, Chinese and U.S.
businesses remain deeply integrated in terms of financial, knowledge and
production networks. And despite the trade war, foreign investment inflows
into China grew by 4.5 percent from 2019 — and hit a record $144.37 billion
in 2020. There‘s little sign that U.S. multinationals have embraced the idea
of decoupling from China. While U.S. Trade
Representative Katherine Tai justified the Biden administration’s hesitancy
to remove tariffs on the grounds that tariffs provide leverage against China,
our research demonstrates that U.S. tariffs haven’t produced the intended
results. Instead, multinationals continue to navigate the uncertain
U.S.-China relationship and related political risks. Smaller firms, in
particular, may find it difficult to absorb the costs generated by the trade
war. The lack of U.S. leverage resulting from the trade war may
dispel the notion that tariffs are “tough on China” and may help focus the
policy debate on the harm to U.S. consumers from tariffs that remain in
place. The Biden administration has at its disposal an array of alternative
tools besides tariffs for economic competition with China that may result in
less collateral damage on the U.S. economy. After all, economic coercion can be a double-edged sword:
These tools tend to inflict collateral damage on one’s economy while hurting
that of the target, but tariffs are the bluntest tool of all. Chapter 2
(Due with first mid term exam) 1.
Based on the classroom discussion, and documents posted and
available online, do you think that the trade war against China could help US
to reduce its trade deficit (or current account deficit)? Please be specific. 2.
What is your opinion about the increasing current account
deficit during Covid 19 pandemic? Is the current account deficit a problem?
Why or why not? For reference, please
visit https://www.imf.org/external/pubs/ft/fandd/basics/current.htm 3. Internet
exercises (not required, information for intereted students only) a. IMF,
world bank and UN are only a few of the major organizations that
track, report and aid international economic and financial
development. Based on information provided in those websites, you could learn
about a country’s economic outlook. IMF: www.imf.org/external/index.htm UN: www.un.org/databases/index.htm World
bank: www.worldbank.org’ Bank
of international settlement: www.bis.org/index.htm b. St. Louis
Federal Reserve provides a large amount of recent open economy macroeconomic
data online. You can track down BOP and GDP data for the major industrial
countries. Recent
international economic data: research.stlouisfed.org/publications Balance of Payments
statistics: research.stlouisfed.org/fred2/categories/125 |
|
Balance
of payments: Current account (video, Khan academy) (FYI)
Balance of payments:
Capital account (video, Khan Academy) (FYI) Current vs.
capital accounts: what is the difference (youtube)? Reference
of useful websites for global economy International Trade
Statistics (PDF) Current
Account (BOP) Data – World Bank http://data.worldbank.org/indicator/BN.CAB.XOKA.CD IMF,
world bank and UN are only a few of the major organizations that track, report and aid
international economic and financial development.
Using these website, you can summarize the economic outlook for
each country. IMF: www.imf.org/external/index.htm UN: www.un.org/databases/index.htm World
bank: www.worldbank.org Bank
of international settlement: www.bis.org/index.htm St.
Louis Federal Reserve provides a large amount of recent open economy
macroeconomic data online. You can track down BOP and GDP data for the major
industrial countries. Recent international
economic data: research.stlouisfed.org/publicaitons/ie Rolling back U.S.-China tariffs would ease
inflation in the U.S., former Treasury secretary says PUBLISHED TUE, NOV 30
2021, Weizhen Tan https://www.cnbc.com/2021/11/30/removing-us-china-trade-tariffs-would-ease-inflation-jacob-lew.html KEY POINTS ·
Eliminating tariffs imposed on goods during
the worst of the trade war would help ease inflation in the U.S., former
Treasury Secretary Jacob Lew told CNBC. ·
But there’s currently “no political space”
to do so, he said on CNBC’s “Street Signs Asia.” ·
Worries over inflation have shot up this
year, as energy prices spiked and the ongoing supply chain crisis led to
shortages of goods. But Lew said there’s been “a bit of excess nervousness
about inflation.” U.S. fiscal stimulus
package is unlikely despite omicron: Ex-Treasury Secretary Eliminating tariffs
imposed on goods during the worst of the trade war would help ease inflation
in the U.S., former Treasury Secretary Jacob Lew told CNBC on Tuesday. But there’s currently
“no political space” to do so, he said on CNBC’s “Street Signs Asia.” “I think that the
United States and China have deep differences. I’ve never thought it should
just be about negotiating the exchange of one good or another on one side or
the other. It should be about a level playing field,” Lew said. He served as
treasury secretary from 2013 to 2017 during the Obama administration. He continued: “I’ve thought
from the beginning that the tariffs were an ineffective way to deal with
their attacks on American consumers. And right now, with inflation being an
issue, rolling back tariffs would actually reduce inflation in the United
States.” Relations between
Washington and Beijing took a turn for the worse in 2018, when the Trump
administration imposed tariffs on billions of dollars worth of Chinese goods
and Beijing retaliated with similar punitive measures, drawing both sides
into a protracted trade war. U.S. tariffs on Chinese goods stood at an average
of 19.3% on a trade-weighted basis in early 2021, while Chinese tariffs on
American products were at about 20.7%, according to data compiled by think tank
Peterson Institute for International Economics earlier this year. Before the trade war, U.S. tariffs on Chinese
goods were on average 3.1% in early 2018 while China’s tariffs on American
goods were at 8%, the data
showed. Referring to rolling
back tariffs, Lew said: “Both the leaders have to, I think, create political
space in our two countries for these issues to be issues where you can move
and make progress, because otherwise we either stay where we are. It gets
worse. I think we can do better.” American businesses are bearing most of the cost
burden from the elevated tariffs imposed at the height of the U.S.-China
trade war, according
to a report from Moody’s Investors Service earlier this year. The ratings agency said
that U.S. importers absorbed more than 90% of additional costs resulting
from the 20% U.S. tariff on Chinese goods. That means U.S. importers pay
around 18.5% more in price for a Chinese product subject to that 20% tariff
rate, while Chinese exporters receive 1.5% less for the same product,
according to the report. ‘Excess nervousness’
about inflation Worries over inflation
have shot up this year, as energy prices spiked and the ongoing supply chain
crisis led to shortages of goods. The U.S. consumer price
index, which tracks a basket of products ranging from gasoline and health
care to groceries and rent, rose 6.2% in October from a year ago, the highest
in 30 years. But Lew told CNBC it’s
likely “much of the inflation that we’re seeing will work its way through.” “I don’t think anyone
is predicting hyperinflation,” he said. “But I think there’s been a bit of
excess nervousness about inflation. And candidly, the public reaction to
inflation is very strong.” But Lew warned that
policymakers have to walk a fine line and ensure that measures used to combat
inflation don’t slow the economy down so much that they dampen growth. — CNBC’s Yen Nee Lee,
Jeff Cox contributed to this report. Khan Academy’s
view of the trade deficit with China (video) |
||||||||||||||||||||||||||||||||||||||||||||||||||||||||||||||||||||||||||||||||||||||||||||||||||||||||||||||||||||||||||||||||||||||||||||||||||||||||||||||||||||||||||||||||||||||||||||||||||||||||||||||||||||||||||||||||||||||||||||||||||||||||||||||||||||||||||||||||||||||||||||||||||||||||||||||||||||||||||||||||||||||||||||||||||||||||||||||||||||||||||||||||||||||||||||||||||||||||||||||||||||||||||||||||||||||||||||||||||||||||||||||||||||||||||||||||||||||||||||||||||||||||||||||||||||||||||||||||||||
|
In class exercise: 1.
If U.S. imports > exports, then the supply of
dollars > the demand of the dollars in the foreign exchange market, ceteris
paribus. True/False? Solution: Import
means using $ (spending $, or out flow of $) to buy foreign goods In
the FX market, supply of $ increases So
when supply increases and assume that demand is unchanged, the
value of $ will drop 2. If Japan exports
> imports, then yen would appreciate against other
currencies. True/False? Solution: Export
means selling domestic products for yen ( in flow of yen from importers who
will pay yen for the goods made in Japan; there is an increased demand for
yen) In
the FX market, demand of yen increases So
when demand increases and assume that supply is unchanged, the
value of yen will rise. 3. If the interest rate
rises in the U.S., ceteris paribus, then capital will flow out of
the U.S. True/False? Solution: Interest
rate rises financial market will become
more attractive to foreign investors capital
will flow in, not out of the U.S. |
|
|||||||||||||||||||||||||||||||||||||||||||||||||||||||||||||||||||||||||||||||||||||||||||||||||||||||||||||||||||||||||||||||||||||||||||||||||||||||||||||||||||||||||||||||||||||||||||||||||||||||||||||||||||||||||||||||||||||||||||||||||||||||||||||||||||||||||||||||||||||||||||||||||||||||||||||||||||||||||||||||||||||||||||||||||||||||||||||||||||||||||||||||||||||||||||||||||||||||||||||||||||||||||||||||||||||||||||||||||||||||||||||||||||||||||||||||||||||||||||||||||||||||||||||||||||||||||||||||||||||
|
Part II of Chapter 2 --- Evolution
of international monetary system Finance: The History of Money (combined) (video,
fan to watch)
Review of history of money: A brief
history of money - From gold to bitcoin and cryptocurrencies (video)
· Bimetallism:
Before 1875 · Classical
Gold Standard: 1875-1914 The Gold Standard Explained in One
Minute (video)
§ International
value of currency was determined by its fixed relationship to gold. § Gold
was used to settle international accounts, so the risk of trading with other
countries could be reduced. · Interwar
Period: 1915-1944 § Countries
suspended gold standard during the WWI, to increase money supply and pay for
the war. § Countries
relied on a partial gold standard and partly other countries’ currencies during the WWII · Bretton Woods System: 1945-1972 The Bretton Woods Monetary
System (1944 - 1971) Explained in One Minute (video)
§ All
currencies were pegged to US$. § US$ was
the only currency that was backed by gold. § US$ was
world currency at that time. · The
Flexible Exchange Rate Regime: 1973-Present FLOATING AND FIXED EXCHANGE RATE (video)
For class discussion: Read
the following. Is there any knowledge that is new to you? Bretton Woods Agreement and System By
JAMES CHEN Updated April 28, 2021, Reviewed by SOMER ANDERSON What
Was the Bretton Woods Agreement and System? The Bretton Woods Agreement was
negotiated in July 1944 by delegates from 44 countries
at the United Nations Monetary and Financial Conference held in Bretton
Woods, New Hampshire. Thus, the name “Bretton Woods Agreement.” Under
the Bretton Woods System, gold was the
basis for the U.S. dollar and other currencies were pegged to the U.S.
dollar’s value. The Bretton Woods
System effectively came to an end in the early 1970s when President Richard
M. Nixon announced that the U.S. would no longer exchange gold for U.S.
currency. The
Bretton Woods Agreement and System Explained Approximately
730 delegates representing 44 countries met in Bretton Woods in July 1944 with the principal goals of creating an
efficient foreign exchange system, preventing competitive devaluations of
currencies, and promoting international economic growth. The Bretton Woods
Agreement and System were central to these goals. The Bretton Woods Agreement
also created two important organizations—the International Monetary Fund
(IMF) and the World Bank. While the Bretton Woods System was dissolved in
the 1970s, both the IMF and World Bank have remained strong pillars for the
exchange of international currencies. Though
the Bretton Woods conference itself took place over just three weeks, the
preparations for it had been going on for several years. The primary
designers of the Bretton Woods System were the famous British economist John
Maynard Keynes and American Chief International Economist of the U.S.
Treasury Department Harry Dexter White. Keynes’ hope was to establish a
powerful global central bank to be called the Clearing Union and issue a new
international reserve currency called the bancor. White’s plan envisioned a
more modest lending fund and a greater role for the U.S. dollar, rather than
the creation of a new currency. In the end, the adopted plan took ideas from
both, leaning more toward White’s plan. It wasn't until 1958 that the Bretton
Woods System became fully functional. Once implemented, its
provisions called for the U.S. dollar to be pegged to the value of gold.
Moreover, all other currencies in the system were then pegged to the U.S.
dollar’s value. The exchange rate applied
at the time set the price of gold at $35 an ounce. KEY
TAKEAWAYS ·
The Bretton Woods
Agreement and System created a collective international currency exchange
regime that lasted from the mid-1940s to the early 1970s. ·
The Bretton Woods
System required a currency peg to the U.S. dollar which was in turn pegged to
the price of gold. ·
The Bretton Woods
System collapsed in the 1970s but created a lasting influence on
international currency exchange and trade through its development of the IMF
and World Bank. Benefits
of Bretton Woods Currency Pegging The
Bretton Woods System included 44 countries. These countries were brought
together to help regulate and promote international trade across borders. As
with the benefits of all currency pegging regimes, currency pegs are expected
to provide currency stabilization for
trade of goods and services as well as financing. All
of the countries in the Bretton Woods System agreed to a fixed peg against
the U.S. dollar with diversions of only 1% allowed. Countries were required
to monitor and maintain their currency pegs which they achieved primarily by
using their currency to buy or sell U.S. dollars as needed. The Bretton Woods System, therefore,
minimized international currency exchange rate volatility which helped international
trade relations. More stability in foreign currency exchange was also a
factor for the successful support of loans and grants internationally from
the World Bank. The
IMF and World Bank The
Bretton Woods Agreement created two Bretton Woods Institutions, the IMF and
the World Bank. Formally introduced in December 1945 both institutions have
withstood the test of time, globally serving as important pillars for
international capital financing and trade activities. The
purpose of the IMF was to monitor exchange rates and identify nations that
needed global monetary support. The World Bank, initially called the
International Bank for Reconstruction and Development, was established to
manage funds available for providing assistance to countries that had been
physically and financially devastated by World War II.1
In the twenty-first century, the IMF has 189 member countries and still
continues to support global monetary cooperation. Tandemly, the World Bank
helps to promote these efforts through its loans and grants to governments.2 The Bretton Woods System’s Collapse In 1971, concerned that the U.S. gold
supply was no longer adequate to cover the number of dollars in circulation,
President Richard M. Nixon devalued the U.S. dollar relative to gold. After a
run on gold reserve, he declared a temporary suspension of the dollar’s
convertibility into gold. By 1973 the Bretton Woods System had collapsed. Countries
were then free to choose any exchange arrangement for their currency, except
pegging its value to the price of gold. They could, for example, link its
value to another country's currency, or a basket of currencies, or simply let
it float freely and allow market forces to determine its value relative to
other countries' currencies. The
Bretton Woods Agreement remains a significant event in world financial
history. The two Bretton Woods Institutions it created in the International
Monetary Fund and the World Bank played an important part in helping to
rebuild Europe in the aftermath of World War II.
Subsequently, both institutions have continued to maintain their founding
goals while also transitioning to serve global government interests in the
modern-day. The Evolution of US Currency
At times, America
may not be the most popular nation in the world, but one thing is for sure:
it is famous for its green. The greenback has been iconic since its
inception. This infographic
above misses a few key instances in US currency history – namely the birth of
the Federal Reserve in 1913 and Nixon ending convertibility to gold in
1971. Both events were catalysts to massive money printing which leaves
the USD with only a fraction of the purchasing power that it once had.
Mar 27, 2020,04:54pm EDT|30,167 views What If We Had A Gold Standard System, Right Now? Nathan LewisContributor https://www.forbes.com/sites/nathanlewis/2020/03/27/what-if-we-had-a-gold-standard-right-now/?sh=1bfba3313e58 For most of the 182 years between 1789 and 1971, the United
States embraced the principle of a dollar linked to gold — at first, at
$20.67/oz., and then, after 1933, $35/oz. Nearly every economist today will
tell you that was a terrible policy. We can tell it was a disaster because,
during that time, the United States became the wealthiest and most prosperous country in the
history of the world. This is economist logic. But, even if some economists might agree with the general
principle, they might be particularly hesitant to apply such monetary
discipline right now, in the midst of economic and financial turmoil. This
kind of event is the whole reason why we put up with all the chronic
difficulties of floating currencies, and economic manipulation by central
banks. Isn't it? So, let's ask: What if we were on a gold standard system, right
now? Or, to be a little more specific, what if we had been on a gold standard
system for the last ten years, and continued on one right now, in the midst
of the COVID-19 panic and economic turmoil? In the end, a gold standard system is just a fixed-value
system. The International Monetary Fund tells us that more than half the
countries in the world, today, have some kind of fixed-value system —
they link the value of their currency to some external standard, typically
the dollar, euro, or some other international currency. They have fixed exchange
rates, compared to this external benchmark. The best of these systems are
currency boards, such as is used by Hong Kong vs. the U.S. dollar, or
Bulgaria vs. the euro. If you think of a gold standard as just a "currency board linked to gold," you would have the general idea. These
currency boards are functioning right now to keep monetary stability in the
midst of a lot of other turmoil. If you had all the problems of today, plus
additional monetary instability as Russia or Turkey or Korea has been
experiencing (or the euro ...), it just piles more problems on top of each
other. Actually, it would probably be easier to link to gold
than the dollar or euro, because gold's value tends to be stable, while the
floating fiat dollar and euro obviously have floating values, by design. If
you are going to link your currency to something, it is easier to link it to
something that moves little, rather than something that moves a lot. Big
dollar moves, such as in 1982, 1985, 1997-98 and 2008, tend to be accompanied
by currency turmoil around the world. But, even within the discipline of a gold standard system, you
could still have a fair amount of leeway regarding central bank activity, and
also various financial supports that arise via the Treasury and Congress. Basically, you could do just about anything that is compatible
with keeping the value of the dollar stable vs. gold. In the pre-1914 era, there was a suite of policies to this
effect, generally known as the "lender of last resort," and
described in Walter Bagehot's book Lombard Street (1873).
Another set of solutions resolved the Panic of 1907, without ever leaving the
gold standard. The Federal Reserve was explicitly designed to operate on a
gold standard system; and mostly did so for the first 58 years of its
existence, until 1971. Others have argued that a functional "free
banking" system, as Canada had in the pre-1914 era, would allow private
banks to take on a lot of these functions, without the need for a central
bank to do so. What could the Federal Reserve do today, while still adhering to
the gold standard? First: It could expand the monetary base, by any amount
necessary, that meets an increase in demand to hold cash (base money). Quite commonly, when
things get dicey, people want to hold more cash. Individuals might withdraw
banknotes from banks. Banks themselves tend to hold more "bank
reserves" (deposits) at the Federal Reserve — the banker's equivalent of
a safe full of banknotes. This has happened, for example, during every major
war. During the Great Depression, the Federal Reserve expanded its balance
sheet by a huge amount, as banks increased their bank reserve holdings in the
face of uncertainty. Nevertheless, the dollar's value remained at its $35/oz.
parity.
Federal Reserve Liabilities 1917-1941. NATHAN LEWIS Second: The Federal Reserve could extend loans to certain
entities - banks, or corporations - as long as this lending is consistent with
the maintenance of the currency's value at its gold parity. In the pre-1914 era, this was done via
the "discount window." One way this could come about is by swapping
government debt for direct lending. For example, the Federal Reserve could
extend $1.0 trillion of loans to banks and corporations, and also reduce its
Treasury bond holdings by $1.0 trillion. This would not expand the monetary
base. But, it might do a lot to help corporations with funding issues. What the Federal Reserve would not be able to do is: expand the
"money supply" (monetary base) to an excessive amount — an amount
that tended to cause the currency's value to fall due to oversupply, compared
to its gold parity. Now we come to a wide variety of actions that are not really
related to the Federal Reserve, but rather, to the Treasury and Congress. In 1933, a big change was Deposit Insurance. The Federal
Government insured bank accounts. It helped stop a banking panic at the time.
This is a controversial policy even today, and some think it exacerbated the
Savings and Loan Crisis of the 1980s, not to mention more issues in 2008.
But, nevertheless, it didn't have anything to do with the Federal Reserve. In 2009, the stock market bottomed when there was a rule change
that allowed banks to "mark to model" rather than "mark to
market." Banks could just say: "We are solvent, we promise."
It worked. Today, Congress has been making funds available to guarantee
business lending, and for a wide variety of purposes that should help
maintain financial calm. Whether this is a good idea or not will be debated
for a long time I am sure. But, it has nothing to do with the Federal
Reserve. All of these actions are entirely compatible with the gold standard. What about interest rates? Don't we want the Federal Reserve to
cut rates when things get iffy? In the 1930s, interest rates were set by
market forces. Given the economic turmoil of the time, government bond rates,
and especially bill rates, were very low. The yield on government bills
spent nearly the whole decade of the 1930s near 0%. Markets lower "risk-free" rates
automatically, during times of economic distress, when you just allow them to
function without molestation. Every bond trader already knows this.
U.S. interest rates, 1919-1941 NATHAN LEWIS When we go down the list of all the things that the Federal
Reserve, the Treasury, Congress and other regulatory bodies could do, while
also adhering to the gold standard, we find that there is really not much
left. It turns out that many of the things that supposedly justify floating
currencies, are also possible with a gold standard system. Homework of chapter 2 part ii (due with the
first midterm exam) Do
you support returning to gold standard? Why or why not? Do you believe that bitcoin would be the future
currency? Why or why not? |
|
Bitcoin poses no threat to the dollar as the
world’s currency leader, Fed’s Bullard says PUBLISHED
TUE, FEB 16 202112:45 PM ESTUPDATED TUE, FEB 16 20213:42 PM EST Kevin
Stankiewicz Bitcoin
does not present a serious threat to U.S. dollar’s status as the world’s
reserve currency, according to St. Louis Federal Reserve President James
Bullard. “I just
think for Fed policy, it’s going to be a dollar economy as far as the eye can
see,” Bullard told CNBC on Tuesday. The
central banker expressed concerns about the proliferation of privately issued
digital currencies. ‘You
don’t want to go to a non-uniform with currency,’ says Fed’s Jim Bullard St.
Louis Federal Reserve President James Bullard told CNBC on Tuesday he
believes increasing interest in
bitcoin does not pose a serious threat to the U.S. dollar as the world’s
reserve currency. “I just
think for Fed policy, it’s going to be a dollar economy as far as the eye can
see — a dollar global economy really
as far as the eye can see — and whether the gold price goes up or down, or
the bitcoin price goes up or down, doesn’t really affect that,” Bullard
said on “Squawk Box.” Bitcoin,
in particular, has been championed by crypto bulls as a store of value that
can be used to hedge against inflation or the debasement of fiat currencies
like the dollar. Some have touted it as “digital gold.” In addition, bitcoin
and other cryptocurrencies also present themselves as a way to buy goods and
services like actual money. Bullard,
who has led the St. Louis Fed since 2008, expressed concerns about widespread
transactions using a range of cryptocurrencies that are not issued by
governments. “Dollars can be traded electronically already, so I’m not sure
that’s really the issue here. The issue is privately issued currency,” he
said. Before
the Civil War, it was common for banks to issue their own notes, Bullard
said. He likened it to Bank of America, JPMorgan and Wells Fargo all having
distinct brands of dollars. “They were all trading around and they traded at
different discounts to each other, and people did not like it at all,” he
said. “I
think the same thing would occur with bitcoin here,” Bullard said. “You don’t want to go to a nonuniform
currency where you’re walking into Starbucks and maybe you’ll pay with
ethereum, maybe you’ll pay with ripple, maybe you’ll pay with bitcoin, maybe
you’ll pay with a dollar. That isn’t how we do this. We have a uniform
currency that came in at the Civil War time.” Bullard’s
comments happened shortly after the price of bitcoin eclipsed $50,000 per
coin for the first time. The latest leg higher for bitcoin follows moves into
the crypto space by established financial firms such as BNY Mellon and
Mastercard. Tesla
also announced last week it bought $1.5 billion worth of bitcoin using cash
on its balance sheet and planned to accept the digital coin as payment for
its products. The electric vehicle maker’s action was viewed by some as
another major step toward broad acceptance of bitcoin, which is the world’s
largest digital currency by market value. While Uber doesn’t plan to buy bitcoin as an
investment, CEO Dara Khosrowshahi said it’s possible the ride hailing and
food delivery company would eventually allow customers to pay with digital
coins. “Just like we accept all kinds of local
currency, we are going to look at cryptocurrency and/or bitcoin in terms of
currency to transact,” Khosrowshahi told CNBC on Thursday. “That we’ll
certainly look at and if there’s a benefit there, if there’s a need there,
we’ll do it. We’re just not going to do it as part of a promotion.” When
considering whether cryptocurrencies present a threat to the dollar, Bullard
stressed there’s nothing new about competition. It’s something that has gone
on for centuries, he said. “It is a
currency competition, and investors want a safe haven. They want a stable
store of value, and then they want to conduct their investments in that
currency,” the St. Louis Fed president said. For
example, he contended both the euro and the yen are strong currencies.
However, “neither of those is going to replace the dollar,” he said. “It’d be
very hard to get a private currency that’s really more like gold to play that
role so I don’t think we’re going to see any changes in the future.” Bitcoin Could Become World Reserve Currency,
Says Senator Rand Paul CONTRIBUTOR
Namcios Bitcoin Magazine, PUBLISHED
OCT 25, 2021 1:55PM EDT Bitcoin could rise to that spot as people
keep losing faith and confidence in governments and their policies, Paul said. As
people lose confidence in the government institutions, bitcoin could benefit
and rise to become the world's reserve currency, Senator Rand Paul said. "I've
started to question now whether or not cryptocurrency could actually become
the reserve currency of the world as more and more people lose confidence in
the government," he said. Senator
Paul has never publicly endorsed any cryptocurrency other than Bitcoin. Bitcoin
could become the world's reserve currency if more people lose trust in the
government, said Senator Rand Paul, who accepted BTC donations in its 2016
campaign. The Republican Senator was interviewed on Axios, discussing the
future of bitcoin and fiat currency in the U.S. "The government currencies are so
unreliable — they're also fiat currencies. They're not backed by
anything," Sen. Paul said. A
Gallup poll published on September 30 highlighted how Americans' trust in
government remains low. The survey found that overall trust in the federal
government to handle international problems sits at a record-low 39%, whereas
confidence in the judicial branch is at 54%, down 13 points since 2020. U.S.
citizens' trust in their state (57%) and local (66%) governments continues to
be higher than trust in the federal government. As
people keep losing faith in their government's ability to handle problems and
best represent their interests, Bitcoin and cryptocurrencies are set to
benefit and be even more embraced, Senator Paul highlighted. "I've
started to question now whether or not cryptocurrency could actually become
the reserve currency of the world as more and more people lose confidence in
the government," he said. The
Senator has touted cryptocurrency before. During his presidential campaign in
2016, in addition to donations in U.S. dollars, Paul accepted donations in
bitcoin. Even
though the Republican Senator was not specific about which cryptocurrency he
was referring to in the interview, he has not publicly endorsed any
cryptocurrency other than BTC, indicating he was likely referring to bitcoin
itself. Which shouldn't come as a surprise, given that BTC is the only
cryptocurrency suitable to function as currency. Central Bank Digital Currency (CBDC) By
SHOBHIT SETH Updated August 25, 2021, Reviewed by ERIKA RASURE https://www.investopedia.com/terms/c/central-bank-digital-currency-cbdc.asp What Is
a Central Bank Digital Currency (CBDC)? The term central bank digital currency (CBDC)
refers to the virtual form of a fiat currency. A CBDC is an electronic record
or digital token of a country's official currency. As such, it is issued and regulated by the nation's monetary
authority or central bank. As such, they
are backed by the full faith and credit of the issuing government. CBDCs
can simplify the implementation of monetary and fiscal policy and promote
financial inclusion in an economy by bringing the unbanked into the financial
system. Because they are a centralized
form of currency, they may erode the privacy of citizens. CBDCs are in
various stages of development around the world. KEY
TAKEAWAYS ·
A
central bank digital currency is the virtual form of a country's fiat
currency. ·
A
CBDC is issued and regulated by a nation's monetary authority or central
bank. ·
CBDCs
promote financial inclusion and simplify the implementation of monetary and
fiscal policy. ·
As
a centralized form of currency, they may erode the privacy of citizens. Although
they aren't formally being used, many countries are exploring the
introduction and use of CBDCs in their economy. How
Central Bank Digital Currencies (CBDCs) Work Fiat
money is the term that refers to currency issued by a country's government.
It comes in the form of banknotes and coins. It is considered a form of legal
tender that can be used for the sale and purchase of goods and services along
with kinds of transactions. A central bank digital currency is the virtual
form of fiat money. As such, it has the full faith and backing of the issuing
government, just like fiat money does. CBDCs are meant to represent fiat currency.
The goal is to provide users with convenience and security of digital as well
as the regulated, reserve-backed circulation of the traditional banking
system. They are designed to function as a unit of
account, store of value, and medium of exchange for daily transactions. CBDCs
will be backed by the full faith of the issuing government—just like fiat
currency. Central banks or monetary authorities will be solely liable for
their operations. There were 83 countries around the world
pursuing CBDC development as of October 2021.Their reasons for pursuing this venture varied. For example: Sweden's
Riksbank began developing an electronic version of the krona (called e-krona)
after the country experienced a decline in the use of cash. The
United States wants to introduce CBDCs in its monetary system to improve the
domestic payments system. Developing
countries may have other reasons. For instance, a significant number of
people in India are unbanked. Setting up the physical infrastructure to bring
the unbanked into the financial ecosystem is costly. But establishing a CBDC
can promote financial inclusion in the country's economy. CBDCs are not meant to be interchangeable
with the national currency (fiat or otherwise) of a country or region. Types
of CBDCs There
are two types of CBDCs: Wholesale and retail central bank digital currencies.
We've listed some of the main features of each below. Wholesale
CBDCs Wholesale
CBDCs use the existing tier of banking and financial institutions to conduct
and settle transactions. These types of CBDCs are just like traditional
central bank reserves. One
type of wholesale CBDC transaction is the interbank payment. It involves the
transfer of assets or money between two banks and is subject to certain
conditions. This transfer comes with considerable counterparty risk, which
can be magnified in a real-time gross settlement (RTGS) payment system. A
digital currency's ledger-based system enables the setting of conditions, so
a transfer won't occur if these conditions are not satisfied. Wholesale CBDCs
can also expedite and automate the process for cross-border transfers. Current
real-time settlement systems mostly work in single jurisdictions or with a
single currency. The distributed ledger technology (DLT) available in
wholesale CBDCs can extend the concept to cross-border transfers and expedite
the process to transfer money across borders.5 Retail
CBDCs Wholesale
CBDCs improve upon a system of transfers between banks. Retail CBDCs, on the other hand, involve the transfer of central
government-backed digital currency directly to consumers. They eliminate the intermediary risk or
the risk that banking institutions might become illiquid and sink depositor
funds. There
are two possible variants of retail CBDCs are possible, depending on the type
of access they provide: Value- or cash-based access: This system involves
CBDCs that are passed onto the recipient through a pseudonymous digital
wallet. The
wallet will be identifiable on a public blockchain and, much like cash
transactions, will be difficult to identify parties in such transactions.
According to Riksbank, the development of a value- or cash-based access
system is easier and quicker compared to token-based access. Token- or account-based access: This is
similar to the access provided by a bank account. Thus, an intermediary will
be responsible for verifying the identity of the recipient and monitoring
illicit activity and payments between accounts. It provides for more privacy.
Personal transaction data is shielded from commercial parties and public
authorities through a private authentication process. he two types of CBDCs are not mutually
exclusive. It is possible to develop a combination of both and have them
function in the same economy. Advantages
and Disadvantages of CBDCs Advantages CBDCs simplify the process of implementing
monetary policy and government functions. They automate the process between
banks through wholesale CBDCs and establish a direct connection between
consumers and central banks through retail CBDCs. These digital currencies can also minimize the effort and processes
for other government functions, such as distribution of benefits or
calculation and collection of taxes. Disbursement
of money through intermediaries introduces third-party risk to the process.
What if the bank runs out of cash deposits? What if there is a bank run due
to a rumor or an external event? Events like these have the potential to
upset the delicate balance of a monetary system. A CBDC eliminates
third-party risk. Any residual risk that remains in the system rests with the
central bank. One of
the roadblocks to financial inclusion for large parts of the unbanked
population, especially in developing and poor countries, is the cost
associated with developing the banking infrastructure needed to provide them
with access to the financial system. CBDCs
can establish a direct connection between consumers and central banks, thus
eliminating the need for expensive infrastructure. CBDCs can prevent illicit activity because
they exist in a digital format and do not require serial numbers for
tracking. Cryptography and a public ledger make it
easy for a central bank to track money throughout its jurisdiction, thereby
preventing illicit activity and illegal transactions using CBDCs. Disadvantages CBDCs don't necessarily solve the problem of
centralization. A central authority (the central bank) is still responsible
for and invested with the authority to conduct transactions. Therefore, it still controls data and the levers of transactions
between citizens and banks. Users would have to give up some degree of
privacy since the administrator is responsible to collect and disseminate
digital identifications. The provider
would become privy to every transaction conducted. This can lead to privacy
issues, similar to the ones that plague tech behemoths and internet service
providers (ISPs). For example, criminals could hack and misuse information,
or central banks could disallow transactions between citizens. The legal and regulatory issues pertaining to
CBDCs are a black hole. What will be the role of these currencies and who
will regulate them? Considering their benefits in cross-border
transfers, should they be regulated across borders? Experiments in CBDCs are
ongoing, and this could translate to a long-term frame. The portability of these systems means that a
strong CBDC issued by a foreign country could end up substituting a weaker
country's currency. A digital U.S. dollar could substitute the
local currency of a smaller country or a failing state. Let's look at
Ecuador, which replaced its official currency (the sucre) with the U.S.
dollar in 2000 after high inflation forced citizens to convert their money to
U.S. dollars. CBDCs
vs. Cryptocurrencies The
idea for central bank digital currencies owes its origins to the introduction
of cryptocurrencies which are digital currencies secured by cryptography.
This makes them hard to duplicate or counterfeit. They are decentralized networks that are based on blockchain
technology. The invention of a secure and immutable ledger allows
transactions to be tracked. It also enables seamless and direct
transfers, without intermediaries and between recipients simplifies the
implementation of monetary policy in an economy. The
cryptocurrency ecosystem also provides a glimpse of an alternate currency
system in which cumbersome regulation does not dictate the terms of each
transaction. Established in 2009, Bitcoin is one of the world's most popular
cryptocurrencies. No physical coins actually trade hands. Instead,
transactions are traded and recorded on a public, encrypted ledger, which can
be accessed by anyone. The process of mining allows all transactions to be
verified. No governments or banks back Bitcoin. Though
the current cryptocurrency ecosystem does not pose a threat to the existing
financial infrastructure, it has the potential to disrupt and simplify the
existing system. Some experts believe the moves by central banks to design
and develop their own digital currencies will act as a measure to pre-empt
such an eventuality. Facebook's, now
Meta's (FB), proposed cryptocurrency, formerly known as Libra, was an example
of such a system, one that existed beyond borders and was not regulated by a
single regime. Examples
of CBDCs Central-bank-backed
digital currencies haven't been formally established yet. Many central banks
have pilot programs and research projects in place that are aimed at
determining the viability and usability of a CBDC in their economy. China is the furthest along this route,
having already laid down the groundwork and initiated a pilot project for the
introduction of a digital yuan. Russia's plan to create the CryptoRuble was
announced by Vladimir Putin in 2017. Speculators suggest that one of the main
reasons for Putin's interest in blockchain is that transactions are
encrypted, making it easier to discreetly send money without worrying about
sanctions placed on the country by the international community. A
number of other central banks have been researching the implementation of a
CBDC, including: Sweden's
Riksbank, which began exploring the issuance of a digital currency in its
economy in 2017 and has published a series of papers exploring the topic. The
Bank of England (BoE), which is among the pioneers to initiate the CBDC
proposal. The
Bank of Canada (BOC). The
central banks of Uruguay, Thailand, Venezuela, and Singapore.1 |
||||||||||||||||||||||||||||||||||||||||||||||||||||||||||||||||||||||||||||||||||||||||||||||||||||||||||||||||||||||||||||||||||||||||||||||||||||||||||||||||||||||||||||||||||||||||||||||||||||||||||||||||||||||||||||||||||||||||||||||||||||||||||||||||||||||||||||||||||||||||||||||||||||||||||||||||||||||||||||||||||||||||||||||||||||||||||||||||||||||||||||||||||||||||||||||||||||||||||||||||||||||||||||||||||||||||||||||||||||||||||||||||||||||||||||||||||||||||||||||||||||||||||||||||||||||||||||||||||||
Why central banks want to
launch digital currencies | CNBC Reports (video)
https://www.youtube.com/watch?v=Qrx_FnjRnfI |
|
|
||||||||||||||||||||||||||||||||||||||||||||||||||||||||||||||||||||||||||||||||||||||||||||||||||||||||||||||||||||||||||||||||||||||||||||||||||||||||||||||||||||||||||||||||||||||||||||||||||||||||||||||||||||||||||||||||||||||||||||||||||||||||||||||||||||||||||||||||||||||||||||||||||||||||||||||||||||||||||||||||||||||||||||||||||||||||||||||||||||||||||||||||||||||||||||||||||||||||||||||||||||||||||||||||||||||||||||||||||||||||||||||||||||||||||||||||||||||||||||||||||||||||||||||||||||||||||||||||||||
|
Chapter 3 International
Financial Market/ References: Go to www.forex.com and set up a practice account
and you can trade with $50,000 virtue money. Visit http://www.dailyfx.com/to get daily foreign
exchange market news. Part I: international financial centers Ranking The ranking is an aggregate of indices
from five key areas: "business environment", "financial sector
development", "infrastructure factors", "human
capital", "reputation and general factors". As of September
24, 2021, the top centres worldwide are:
Top 15 centres by industry
sector This creates separate sub-indices: banking, investment
management, insurance, professional services, and government and regulatory
sectors for GFCI 25 (2019 March)
What Makes a City a
Financial Hub? https://www.investopedia.com/articles/investing/091114/worlds-top-financial-cities.asp A financial center, or a financial hub,
refers to a city with a strategic location, leading financial institutions,
reputed stock exchanges, a dense concentration of public and private banks
and trading and insurance companies. In addition, these hubs are equipped with
first-class infrastructure, communications and commercial systems, and there
is a transparent and sound legal and regulatory regime backed by a stable
political system. Such cities are favorable destinations for
professionals because of the high living standards they offer along with
immense growth opportunities. Here
is a look at the top financial hubs across the globe, in no particular order. KEY
TAKEAWAYS ·
Cities that are
concentrations of commerce, trading, real estate, and banking tend to become
global financial hubs. ·
These important
cities employ a large number of financial professionals and are home to stock
exchanges and corporate headquarters for investment banks. ·
Found around the
world, examples include New York City, Frankfurt, and Tokyo. London Since
the middle ages, London has been one of the most prominent trade and business
centers. The city is one of the most visited places on earth and is among the
most preferred places to do business. London is a well-known center for
foreign exchange and bond trading in addition to banking activities and
insurance services. The city is a
trading hub for bonds, futures, foreign exchange and insurance. The United
Kingdom’s central bank, the Bank of England, is the second oldest central
bank in the world and is located in London. The bank controls the
monetary system and regulates the issue of currency notes in the United
Kingdom. London is also the seat of
the London Stock Exchange, which is the second largest stock exchange in
Europe. Another financial paragon is The London bullion market, managed
by London Bullion Market Association (LBMA), which is the world's largest
market for gold and silver bullion trading. Due to Brexit uncertainty,
London may ultimately lose its stature as a global financial hub. Singapore From
a business perspective, Singapore's attractiveness lies in its transparent
and sound legal framework complementing its economic and political stability.
The small island located in the Southeast Asia region has emerged as one of
the Four Asian Tigers and established itself as a major financial center.
Singapore has transformed its economy despite the disadvantages of limited
land and resources. Singapore is both
diversified and specialized across industries such as chemicals, biomedical
sciences, petroleum refining, mechanical engineering and electronics.
Singapore has deep capital markets and is a leading insurance and wealth
management marketplace. It has a disciplined and efficient workforce with
a population made up of people of Chinese, Malay and Indian origin. Zurich Zurich,
the largest city in Switzerland, is recognized as a financial center
globally. The city has a disproportionately large presence of financial
institutions and banks and has developed into a hub for insurance and asset
management companies. The low tax regime makes Zurich a good investment
destination, and the city attracts a large number of international companies.
Switzerland’s primary stock exchange, the SIX Swiss Exchange, is in Zurich
and is one of the largest in the world, with a market capitalization of $1.4
trillion as of July 2021. The city has a robust business environment and
offers many finance sector jobs. Zurich is one of the cleanest, most
beautiful and crime free places to live and work. New
York City New
York, commonly regarded as the finance capital of the world, has been ranked
first in the World’s Financial Centers by the Global Financial Centres
Index.9 New York is famous for Wall Street, the most happening stock market
and the New York Stock Exchange (NYSE), the largest stock exchange by market
capitalization. The city is a mix of various cultures from across the globe
providing a diverse population and workforce. It plays host to some of the
largest and finest companies (Fortune 500 and Fortune 1000), biggest banks
(Goldman Sachs, Morgan Stanley, and Merrill Lynch, JP Morgan) and industries.
It is difficult to find a big name in the world of business that does not
have a presence in the city. Hong
Kong Hong
Kong is a key financial hub with a high number of banking institutions. The
former British colony also has a sound legal system for both residents and
companies and is the home of many fund management companies. Hong Kong has
benefited from its strategic location. For
more than a century, the city has been a conduit of trade between China and
the world. Hence, Hong Kong is China's second largest trading partner
after the United States. Its proximity to other countries in the region has
also worked in its favor. Hong Kong has an efficient and transparent judicial
and legal system with excellent infrastructure and telecommunication
services. It has a favorable tax
system in place with very few and low tax rates, which adds to its
attractiveness. The Hong Kong Stock Exchange is the fourth largest in the
world. Chicago Chicago owes its fame to the derivative
market (CME group), which started at the Chicago Board of Trade (CBOT) in
1848 with commodity futures trading. It is the oldest futures exchange in
the world and the second largest by volume, behind the National Stock
Exchange of India. The Chicago-based
Options Clearing Corporation (OCC) clears all U.S. option contracts.
Chicago is the headquarters of over 400 major corporations, and the state of
Illinois has more than 30 Fortune 500 companies, most of which are located in
Chicago. These companies include State Farm Insurance, Boeing, Archer Daniels
Midland and Caterpillar. Chicago also one of the most diverse economies
excelling from innovation in risk management to information technology to
manufacturing to health. Another
financial notable is the Federal Reserve Bank of Chicago. Tokyo Tokyo
is the capital of the third-largest economy in the world and a major
financial center.16 The city is the headquarters of many of the world’s
largest investment banks and insurance companies. It is also the hub for the
country’s telecommunications, electronic, broadcasting and publishing
industries. The Japan Exchange Group
(JPX) was established January 1, 2013, by combining the Tokyo Stock Exchange
(TSE) Group and the Osaka Securities Exchange. The exchange had a market
capitalization of $5.9 trillion as of July 2021. The Nikkei 225 and the TOPIX are the main indices tracking the buzz
at the TSE. Tokyo has time and
again been rated among the most expensive cities in the world. Frankfurt
Frankfurt is home to the European Central
Bank (ECB) and the Deutsche Bundesbank, the central bank of Germany. It has one of the busiest airports in the world and is
the address of many top companies, national and international banks. In 2014,
Frankfurt became Europe's first renminbi payment hub. Frankfurter
Wertpapierbörse, the Frankfurt Stock Exchange, is among the world’s largest
stock exchanges. It had a $2.65 trillion market capitalization as of July
2021. Deutsche Börse Group operates the Frankfurt Stock Exchange. Shanghai Shanghai
is the world's third most populous city, behind Tokyo and Delhi. The Chinese government
in early 2009 announced its ambition of turning Shanghai into an
international financial center by 2020. The
Shanghai Stock Exchange (SSE) is mainland China’s most preeminent market for
stocks in terms of turnover, tradable market value and total market value.
The SSE had a market capitalization of $7.63 trillion as of July 2021.
The China Securities Regulatory Commission (CSRC) directly governs the SSE.
The exchange is considered restrictive in terms of trading and listing
criteria. For Discussion: What makes an
international financial centre? (video)
Is China threatening Asia's financial center? |
CNBC Explains (video)
Do we need so many financial
centers in Asia? |
|
How Will Britain Defend Its Financial Fief After Brexit? How will Brexit
reshape the City of London? | Lex Megatrends (youtube)
Brexit Will
Boost U.K.'s Financial Services Industry: Sunak (youtube)
Other European cities are eating away
at Britain’s edge in financial services. The government is trying to find
ways to keep it. https://www.nytimes.com/2021/04/16/business/london-financial-hub-worries.html By Eshe Nelson, Published April 16,
2021, Updated April 28, 2021 LONDON — Coming out of Brexit this year, Britain’s government needed a new
blueprint for the future of the nation’s financial services as cities like
Amsterdam and Paris vied to become Europe’s next capital of investment and
banking. For some, the answer was Deliveroo, a London-based
food delivery company with 100,000 riders on motor scooters and bicycles.
Although it lost more than 226 million pounds (nearly $310 million) last
year, Deliveroo offered the raw promise of many fast-growing tech start-ups —
and it became a symbol of Britain’s new ambitions by deciding to go public
and list its shares not in New York but on the London Stock Exchange. Deliveroo is a “true British tech
success story,” Rishi Sunak, Britain’s top finance official, said last month. It was a false start. Deliveroo has
since been called “the worst I.P.O. in London’s history.” On the first day of
trading, March 31, the shares dropped 26 percent below the initial public
offering price. (It has gotten worse.) The flop has put a dent in the image
of the City of London — the geographical and metaphorical name for Britain’s
financial hub — as it tries to recover
from the country’s departure from the European Union. Some impacts from
Brexit were immediate: On the
first working day of 2021, trading in European shares shifted from venues in
London to major cities in the bloc. Then London’s share of euro-denominated
derivatives trading dropped sharply. There’s anxiety over what could go
next. Financial services are a vital
component of Britain’s economy, making up 7 percent of gross domestic product
— £132 billion in 2019, or some $170 billion. Exporting financial and other
professional services is something Britain excels at. Membership in the European Union allowed London to serve as a
financial base for the rest of the continent, and the City’s business
ballooned. Four-tenths of financial services exports go to the European
Union. The government has begun hunting for
ideas to bolster London’s reputation as a global finance center, in a series
of reviews and consultations on a variety of issues, including I.P.O.s and
trading regulations. For many, the changes can’t come soon
enough. “The United Kingdom is not going to
sit still and watch its financial services move across” to other European
cities, said Alasdair Haynes, the founder of Aquis, a trading venue and stock
exchange for equities in London. This will make the next three or four years
exciting, he said. But this optimism isn’t universal. The prospects of a warm and close
relationship between Britain and the European Union have considerably dimmed.
The two sides recently finished negotiations on a memorandum of understanding
to establish a forum to discuss financial regulation, but the forum is
voluntary, and the document has yet to be signed. The European Union has made no secret
of its plans to build up its own capital markets, which could flourish if
London is denied access. The “mood music in the E.U.,” said Andrew Pilgrim,
who leads the U.K. government and financial services team at EY, is focused
on having autonomy over its own financial services and not being reliant on
Britain. For Britain, the appeal of writing its own financial rules is
growing. The trick is luring more business without lowering London’s
regulatory standards,
which many consider a powerful draw. A recent survey of global senior
financial executives by Duff & Phelps found that fewer see London as the
world’s leading financial center but that it topped the leader board for
regulatory environment. Here are some of the plans. Taking companies public “I want to make the United Kingdom the best place in the world for
high-growth, innovative companies,” Mr. Sunak told Parliament on March 3,
the same day a review commissioned by
the government recommended changes designed to encourage tech companies to go
public in London. It proposed ideas, common in New York, that would let
founders keep more control of their company after they began selling shares. For example: allowing companies with two classes of shares and different voting
rights (like Facebook) to list in the “premium” section of the London Stock
Exchange, which could pave the way for them to be included in benchmark
indexes. Or: allowing a company to go public while selling a smaller
proportion of its shares than the current rules require. The timing of Deliveroo’s I.P.O. wasn’t a coincidence. It listed with
dual-class shares that give its co-founder William Shu more than half of the
voting rights for three years — a structure set to “closely align” with the
review’s recommendations, the company said. But the idea may be a nonstarter among
some of London’s institutional investors. Deliveroo flopped partly because
they balked at the offer of shares with minimal voting rights. But others are excited by the ideas in
the review, which was conducted by Jonathan Hill, a former European
commissioner for financial services. Among them are Mr. Haynes, whose
company, Aquis, acquired a stock exchange last year to compete with the
London Stock Exchange. “I’m hugely supportive of what Lord Hill
has done,” said Mr. Haynes, who wants his exchange to one day become “the
Nasdaq of Europe.” It is trying to entice companies with benefits such as a
ban on short-selling (a practice in which investors bet against the price of
a stock) on some of the larger companies that list with it. The Nasdaq has a
coveted reputation for listing tech giants, including Microsoft, Apple and
Facebook. London doesn’t have “that alternative for fast-growing companies,” Mr. Haynes said. Mr. Hill’s review also urges London to become a more inviting home
for special purpose acquisition companies, or blank-check companies, the
latest craze in financial markets, having taken off with investors and
celebrities alike. SPACs are public shell companies that list
on an exchange and then hunt for private companies to buy. London has been left behind in the SPAC fervor. Last year, 248 SPACs
listed in New York, and just four in London, according to data by Dealogic. In
March, Cazoo, a British used car retailer, announced that it was going public
via a SPAC in New York. Already there are signs that Amsterdam could steal the lead in this
booming business for Europe. There have been two SPACs each in London and
Amsterdam this year, but the value of the listings in Amsterdam are five
times that of London. Britain’s financial regulatory agency
said it would start consultations on SPACs soon and aim to have new rules in
place by the summer. A future in fintech London already has a reputation for producing high-flying financial
technology companies such as Revolut and Monzo, which both expanded into the United
States, and Wise (formerly Transferwise), which was valued at $5 billion last
year. All three are so-called challenger banks, which offer financial
services through apps without the need for brick-and-mortar branches. The government clearly wants to build
on this momentum. In February, it published an independent review of the
fintech industry, and it is already acting on some of its recommendations,
including setting up a fast-track visa process for people interested in
coming to Britain to work for fintech companies. The review also recommended
a program that would give regulatory blessing to small companies
experimenting with new fintech offerings and services. As Britain gears up to host the United Nations Climate Change
Conference in November, the government wants to transform London into a
global center for investors who want their money to go into green and
sustainable initiatives. Already, Mr. Sunak has said the
Treasury will require large companies and financial firms to disclose, by
2025, any risks to their businesses associated with climate change and is
working on a taxonomy to define what really counts as “green.” Next, millions
of pounds will be invested in new research centers to provide climate and
environmental data to financial companies. The government is also seeking to regain ground lost to Germany,
France and other European countries on the issuing of green bonds to finance
projects to tackle climate change. The City’s future London’s finance industry isn’t in danger of imminent collapse, but
because of Brexit a cornerstone of the British economy isn’t looking as
formidable as it once did. And as London tries to keep up with New York, it
is looking over its shoulders at the financial technology coming out of Asia. The government has continuously billed
Brexit as an opportunity to do more business with countries outside the
European Union. This will be essential as international companies begin to
ask whether they want to base their European business in London or elsewhere. When it comes to the future of
Britain, it’s “almost a back-to-the-future approach of London as an
international center as opposed to being an international and European
center,” said Miles Celic, the chief executive of the CityUK, which
represents the industry. “It’s doubling down on that international business.” What
Is Libor And Why Is It Being Abandoned? Here's What
Went Wrong With Libor (youtube)
Transitioning
from LIBOR to SOFR (youtube)
Miranda Marquit, Benjamin Curry,Miranda
Marquit, Benjamin Curry https://www.forbes.com/advisor/investing/what-is-libor/ Updated: Dec 21, 2021, 11:20am What Is Libor And Why Is It Being
Abandoned? For more than 40 years, the London Interbank Offered Rate—commonly known as Libor—was a key benchmark for setting
the interest rates charged on adjustable-rate loans, mortgages and corporate
debt. Over the last decade, Libor has been
burdened by scandals and crises. Effective
December 31, 2021, Libor will no longer be used to issue new loans in the
U.S. It is being replaced by the Secured Overnight Financing Rate (SOFR),
which many experts consider a more accurate and more secure pricing benchmark. Understanding Libor Libor provided loan
issuers with a benchmark for setting interest rates on different financial
products. It was set each day by collecting estimates from up to 18 global
banks on the interest rates they would charge for different loan maturities,
given their outlook on local economic conditions. Libor was calculated in
five currencies: UK Pound Sterling, the Swiss Franc, the Euro, Japanese Yen
and the U.S. Dollar. The London Interbank
Offered Rate was used to price adjustable-rate mortgages, asset-backed
securities, municipal bonds, credit default swaps, private student loans and
other types of debt. As of 2019, $1.2
trillion worth of residential mortgage loans and $1.3 trillion of consumer
loans had been priced using Libor. When you applied for a
loan based on Libor, a financial firm would take a Libor rate and then tack
on an additional percentage.
Here’s how it worked for a private student
loan, based on the Libor three-month rate plus 2%. If the Libor three-month
rate was 0.22%, the base rate for the loan would be 2.22%. Other factors,
such as your credit score, income and the loan term, are also factored in. While Libor will no longer be used to
price new loans starting in 2022, it will formally stick around until at
least 2023. One-week and two-month Libor will cease being published at the
end of 2021, while overnight, 1-month, 3-month, 6-month, and 12-month
maturities will continue to be published through June 2023. With an adjustable-rate loan, your lender
sets regular periods where it makes changes to the rate you’re
being charged. The lender referenced Libor when adjusting the interest rate on
your loan, changing how much you pay each month. How Is Libor Calculated? Each day, 18
international banks submit their ideas of the rates they think they would pay
if they had to borrow money from another bank on the interbank lending market
in London. To help guard against extreme highs or lows that might skew the
calculation, the Intercontinental Exchange (ICE) Benchmark Administration
strips out the four highest submissions and the four lowest submissions
before calculating an average. It’s important to note that Libor isn’t
set on what banks actually pay to borrow funds from each other. Instead, it’s
based on their submissions related to what they think they would pay. As a
result, it’s possible for banks to submit lower rates and manipulate Libor fairly
easily. In the past, a panel of bankers oversaw
Libor in each currency, but scandals exposing manipulation of Libor has led
many national regulators to identify alternatives to Libor. Libor Scandals and the
2008 Financial Crisis Libor is being phased out as a loan
benchmark because of the role it played in worsening the 2008 financial
crisis as well as scandals involving Libor manipulation among the
rate-setting banks. Libor and the 2008 Financial Crisis The use and abuse of
credit default swaps (CDS) was one of the major drivers of the 2008 financial
crisis. A very wide range of interrelated financial companies insured risky
mortgages and other questionable financial products using CDS. Rates for CDS
were set using Libor, and these derivative investments were used to insure
against defaults on subprime mortgages. American International
Group (AIG) was the biggest player in the CDS disaster. The firm issued vast
quantities of CDS on subprime mortgages and countless other financial
products, like mortgaged-backed securities. The crash of the real estate
market in 2007, followed by the even larger market meltdown in 2008, forced
AIG into bankruptcy, resulting in one of the largest government bailouts in
history. Once AIG started falling apart, it became
clear that failing subprime mortgages and the securities built on top of them
weren’t properly insured, many banks became reluctant to lend to each other. Libor transmitted the crisis far and wide
since every day Libor rate-setting banks estimated higher and higher interest
rates. Libor rose, making loans more expensive, even as global central banks
rushed to slash interest rates. With rates on trillions of dollars of
financial products soaring day after day, and fears about stunted bank
lending reducing the flow of money through the economy, markets crashed. Libor was only one of the many factors
that created the financial industry disasters of 2008, but its key role in
transmitting the crisis to all parts of the global economy has driven many
nations to seek safer alternatives. Libor Manipulation In 2012, extensive
investigations into the way Libor was set uncovered a widespread,
long-lasting scheme among multiple banks—including Barclays, Deutsche
Bank, Rabobank, UBS and the Royal Bank of Scotland—to manipulate Libor
rates for profit. Barclays was a key player in this
complicated scam. Barclays would submit its Libor estimates, claiming that it
was lower than what other banks actually charged it. Because a lower rate
supposedly indicates a smaller risk of default, it is considered a sign that
a bank is in better shape than another bank with a higher rate. It wasn’t just Barclays, though. At UBS,
one trader involved in Libor setting, Thomas Hayes, managed to rake in
hundreds of millions of dollars for the bank over the course of three years.
Hayes also colluded with traders at the Royal Bank of Scotland on rigging
Libor. UBS executives denied all knowledge of what had been going on,
although the ring managed to manipulate rate submissions across multiple
institutions. SOFR Is Replacing Libor in the U.S. It’s not just these scandals that undercut
Libor. According to ICE, banks have been changing the way they transact
business, and, as a result, Libor rate became a less reliable benchmark. SOFR will be the main
replacement for Libor in the United States. This benchmark is based on the
rates U.S. financial institutions pay each other for overnight loans. These transactions take the
form of Treasury bond repurchase agreements, otherwise known as repos
agreements. They allow banks to to meet liquidity and reserve requirements,
using Treasurys as collateral. SOFR comprises the weighted averages of the
rates charged in these repo transactions. |
||||||||||||||||||||||||||||||||||||||||||||||||||||||||||||||||||||||||||||||||||||||||||||||||||||||||||||||||||||||||||||||||||||||||||||||||||||||||||||||||||||||||||||||||||||||||||||||||||||||||||||||||||||||||||||||||||||||||||||||||||||||||||||||||||||||||||||||||||||||||||||||||||||||||||||||||||||||||||||||||||||||||||||||||||||||||||||||||||||||||||||||||||||||||||||||||||||||||||||||||||||||||||||||||||||||||||||||||||||||||||||||||||||||||||||||||||||||||||||||||||||||||||||||||||||||||||||||||||||
|
Part II: Floating
exchange rate system vs. fixed exchange rate system Currency
exchange introduction (khan acadymy)
Supply
and demand curves in foreign exchange (khan academy)
Floating and
Fixed Exchange Rates- Macroeconomics (youtube)
How Are International
Exchange Rates Set? https://www.investopedia.com/ask/answers/forex/how-forex-exchange-rates-set.asp By
CAROLINE BANTON Updated March 04, 2021, Reviewed by GORDON SCOTT, Fact
checked by YARILET PEREZ International
currency exchange rates display how much one unit of a currency can be
exchanged for another currency. Currency
exchange rates can be floating, in which case they change continually based
on a multitude of factors, or they can be pegged (or fixed) to another
currency, in which case they still float, but they move in tandem with the
currency to which they are pegged. Knowing
the value of a home currency in relation to different foreign currencies
helps investors to analyze assets priced in foreign dollars. For example, for
a U.S. investor, knowing the dollar to euro exchange rate is valuable when
selecting European investments. A declining U.S. dollar could increase the
value of foreign investments just as an increasing U.S. dollar value could
hurt the value of your foreign investments. KEY
TAKEAWAYS ·
Fixed exchange rate regimes are set to a
pre-established peg with another currency or basket of currencies. ·
A floating exchange rate is one that is
determined by supply and demand on the open market as well as macro factors. ·
A floating exchange rate doesn't mean
countries don't try to intervene and manipulate their currency's price, since
governments and central banks regularly attempt to keep their currency price
favorable for international trade. ·
Floating exchange rates are the most
common and became popular after the failure of the gold standard and the
Bretton Woods agreement. Floating vs. Fixed Exchange
Rates Currency
prices can be determined in two main ways: a floating rate or a fixed rate. A floating rate is determined by the open
market through supply and demand on global currency markets. Therefore, if the
demand for the currency is high, the value will increase. If demand is low,
this will drive that currency price lower. Of course, several technical
and fundamental factors will determine what people perceive is a fair
exchange rate and alter their supply and demand accordingly. The currencies of most of
the world's major economies were allowed to float freely following the
collapse of the Bretton Woods system between 1968 and 1973. Therefore, most
exchange rates are not set but are determined by on-going trading activity in
the world's currency markets. Factors That Influence
Exchange Rates Floating rates are
determined by the market forces of supply and demand.
How much demand there is in relation to supply of a currency will determine
that currency's value in relation to another currency. For example, if the
demand for U.S. dollars by Europeans increases, the supply-demand
relationship will cause an increase in the price of the U.S. dollar in
relation to the euro. There are countless geopolitical and economic
announcements that affect the exchange rates between two countries, but a few of the most common include interest
rate changes, unemployment rates, inflation reports, gross domestic product
numbers, manufacturing data, and commodities. A fixed or pegged rate is
determined by the government through its central bank. The rate is set
against another major world currency (such as the U.S. dollar, euro, or yen).
To maintain its exchange rate, the government will buy and sell its own
currency against the currency to which it is pegged.Some
countries that choose to peg their currencies to the U.S. dollar include
China and Saudi Arabia. Short-term
moves in a floating exchange rate currency reflect speculation, rumors,
disasters, and everyday supply and demand for the currency. If supply
outstrips demand that currency will fall, and if demand outstrips supply that
currency will rise. Extreme short-term
moves can result in intervention by central banks, even in a floating rate
environment. Because of this, while most major global currencies are
considered floating, central banks and governments may step in if a nation's
currency becomes too high or too low. A currency that is too high
or too low could affect the nation's economy negatively, affecting trade and
the ability to pay debts. The government or central bank will attempt to
implement measures to move their currency to a more favorable price. Macro Factors More
macro factors also affect exchange rates. The 'Law of One Price' dictates that in a world of international
trade, the price of a good in one country should equal the price in another.
This is called purchasing price parity (PPP). If prices get out of whack, the
interest rates in a country will shift—or else the
exchange rate will between currencies. Of course, reality doesn't always
follow economic theory, and due to several mitigating factors, the law of one
price does not often hold in practice. Still, interest rates and relative prices will influence exchange rates. Another macro factor is the
geopolitical risk and the stability of a country's government. If the
government is not stable, the currency in that country is likely to fall in
value relative to more developed, stable nations. Generally,
the more dependent a country is on a primary domestic industry, the stronger
the correlation between the national currency and the industry's commodity
prices. There
is no uniform rule for determining what commodities a given currency will be
correlated with and how strong that correlation will be. However, some
currencies provide good examples of commodity-forex relationships. Consider
that the Canadian dollar is positively correlated to the price of oil.
Therefore, as the price of oil goes up, the Canadian dollar tends to
appreciate against other major currencies. This is because Canada is a net
oil exporter; when oil prices are high, Canada tends to reap greater revenues
from its oil exports giving the Canadian dollar a boost on the foreign
exchange market. Another
good example is the Australian dollar, which is positively correlated with
gold. Because Australia is one of the world's biggest gold producers, its
dollar tends to move in unison with price changes in gold bullion. Thus, when
gold prices rise significantly, the Australian dollar will also be expected
to appreciate against other major currencies. Maintaining Rates Some
countries may decide to use a pegged exchange rate that is set and maintained
artificially by the government. This rate will not fluctuate intraday and may
be reset on particular dates known as revaluation dates. Governments of
emerging market countries often do this to create stability in the value of
their currencies. To keep the pegged
foreign exchange rate stable, the government of the country must hold large
reserves of the currency to which its currency is pegged to control changes
in supply and demand. The Impossible
Trinity or "The Trilemma" – can a country controls its interest rates, exchange
rates, and capital flow simultaneously? Impossible
Trinity (youtube)
A - set a fixed exchange rate between its currency and
another while allowing capital to flow freely across its borders, B - allow capital to flow freely and set
its own monetary policy, or C - set its own monetary policy and
maintain a fixed exchange rate. The Impossible Trinity or "The
Trilemma", in which two policy positions are possible. If a nation were
to adopt position a, for example,
then it would maintain a fixed exchange rate and allow free capital flows, the
consequence of which would be loss of monetary sovereignty.
The Impossible Trinity - 60 Second
Adventures in Economics (5/6) (video)
The impossible trinity (also
known as the trilemma) is a concept in international
economics which states that it is
impossible to have all three of the following at the same time: · free capital movement
(absence of capital controls) · an
independent monetary policy It
is both a hypothesis based on the uncovered interest rate
parity condition, and a finding from empirical studies where governments
that have tried to simultaneously pursue all three goals have failed. The
concept was developed independently by both John Marcus Fleming in
1962 and Robert Alexander Mundell in
different articles between 1960 and 1963. Policy
choices
According to the impossible trinity, a central bank can only
pursue two of the above-mentioned three policies simultaneously. To see why,
consider this example: Assume that world interest rate is at 5%. If the home central bank tries
to set domestic interest rate at a rate lower than 5%, for example at 2%,
there will be a depreciation pressure on the home currency, because
investors would want to sell their low yielding domestic currency and buy higher
yielding foreign currency. If the central bank also wants to have free
capital flows, the only way the central bank could prevent depreciation of
the home currency is to sell its foreign currency reserves. Since foreign
currency reserves of a central bank are limited, once the reserves are
depleted, the domestic currency will depreciate. Hence, all three of the policy objectives
mentioned above cannot be pursued simultaneously. A central bank has to forgo one of the three objectives. Therefore,
a central bank has three policy combination options. Options
In terms of the diagram above (Oxelheim, 1990), the options are: ·
Option (a): A stable exchange rate and free capital
flows (but not an independent monetary policy because setting a domestic
interest rate that is different from the world interest rate would undermine
a stable exchange rate due to appreciation or depreciation pressure on the
domestic currency). ·
Option (b): An independent monetary policy and free
capital flows (but not a stable exchange rate). ·
Option (c): A stable exchange rate and independent
monetary policy (but no free capital flows, which would require the use
of capital controls. Currently, Eurozone members have chosen
the first option (a) while most other countries have opted for the second one
(b). By contrast, Harvard
economist Dani Rodrik advocates
the use of the third option (c) in his book The Globalization Paradox,
emphasizing that world GDP grew fastest during the Bretton Woods era when
capital controls were accepted in mainstream economics. Rodrik also argues
that the expansion of financial globalization and the free movement
of capital flows are the reason why economic crises have become more frequent
in both developing and advanced economies alike. Rodrik has also developed
the "political trilemma of the world economy", where
"democracy, national sovereignty and global economic
integration are mutually incompatible: we can combine any two of the
three, but never have all three simultaneously and in full." (from
Wikipedia) Summary
Key Terms (Lesson
summary: the foreign exchange market (article) | Khan Academy)
·
Why the demand
for a currency is downward sloping
When the exchange rate of a currency increases, other
countries will want less of that currency. When a currency appreciates (in
other words, the exchange rate increases), then the price of goods in the
country whose currency has appreciated are now relatively more expensive than
those in other countries. Since those goods are more expensive, less is
imported from those countries, and therefore less of that currency is needed.
·
The
equilibrium exchange rate is the interaction of the supply of a currency and
the demand for a currency
As in any market, the foreign exchange market will be in
equilibrium when the quantity supplied of a currency is equal to the quantity
demanded of a currency. If the market has a surplus or a shortage, the
exchange rate will adjust until an equilibrium is achieved. 1. Who are the major
players in the FX market?
2.
As compared with stock market,
FX market is more volatile or less? Why? |
|
Goldman’s
Pandl Sees Mild Dollar Depreciation for 2022 (Bloomberg video) January
5th, 2022, 8:56 PM EST Another year of dollar dominance ahead as the
Fed lifts rates: Reuters poll January
6, 2022,7:18 PM EST Summary Most currencies will struggle to make any
gains against the U.S. dollar in coming months, as monetary tightening
expected from the Federal Reserve will provide the greenback with enough
impetus to extend its dominance well into 2022, analysts said. Nearly
two-thirds of 49 foreign exchange strategists polled by Reuters between Jan.
4-6 said interest rate differentials would dictate sentiment in major FX
markets in the near term, with only two concerned about new coronavirus
variants. The
vast majority of analysts polled said volatility in FX markets would increase
over the coming three months, with well above 80% saying so for both majors
and EM currencies. In the
meantime the Fed, now expected by traders to raise interest rates in March
and begin reducing its asset holdings soon afterward, will provide the dollar
with an edge over other major currencies. Financial markets are now pricing in at least
three U.S. rate hikes this year. "There's
been a lot of U.S. dollar strength of late, mainly driven by the widening
interest rate differentials and inflation dynamics in the U.S. relative to
other major markets like Japan and Europe," said Kerry Craig, global
market strategist at JP Morgan Asset Management. "The
fact the Fed is becoming much more hawkish and reacting to that by tapering
much sooner than forecast a few months ago ... (and soon) start raising rates
should support the dollar over the first part of the year," he said. Median
forecasts lined up with that view as analysts do not expect most major and
emerging currencies to make any significant headway against the greenback during
that period. While
the dollar's dominance is nearly universal, as in previous Fed tightening
cycles, emerging market currencies are likely to feel it the most. "The
macro backdrop looks challenging for emerging market assets," said
Kamakshya Trivedi, co-head of global FX, rates and EM strategy at Goldman
Sachs. "Growth
is slowing from peak rates as the reopening boost fades across the world,
monetary policy tightening is under way, China has shifted to a lower gear of
growth, and some all-too-familiar
old-school EM issues like inflation, fiscal overreach and political
instability are back on the table." Among
the emerging currencies polled on, the
tightly-controlled Chinese yuan was predicted to depreciate nearly 2% to 6.5
per dollar in a year. The Philippine peso , Malaysian ringgit and Indian
rupee were also expected to weaken about 1% or at best cling to a range. Turkey's battered lira was forecast to drop
another 14% this year after plunging 44% in 2021, its worst year since President Tayyip Erdogan's AK Party came to
power in 2002 and making it by far the worst performer in emerging markets. South
Africa's rand , another high-yielder but among the worst-performing emerging
market currencies in 2021, is set to remain rangebound in the next six months
but fall 0.4% to 15.78/$ in a year. Most
major currencies were also not expected to recoup their 2021 losses over the
next 12 months. The euro , which lost nearly 7% last year was
forecast to gain a little under 1.5% by end 2022. Among major safe-haven
currencies, the Japanese yen was expected to trade around current levels and
the Swiss franc to drop around 3% in a year. While
the general direction of travel seems to be for the dollar to strengthen
across the board as there is more clarity on Fed policy, analysts say plenty
of risks remain. "Given
the uncertainty around how economies will evolve and how policymakers will
respond, we are more confident in our view that currency volatility will be relatively high," said Jonas
Goltermann, senior markets economist at Capital Economics. Dollar slumps as U.S. inflation surge comes
in line with expectations PUBLISHED
TUE, JAN 11 2022 11:00 PM ESTUPDATED WED, JAN 12 20224:03 PM EST Reuters https://www.cnbc.com/2022/01/12/forex-markets-fed-us-inflation-data.html Jo Yong
hak | Reuters The dollar fell to a two-month low against a basket
of currencies on Wednesday after data, which showed an expected surge in U.S.
consumer prices in December, fell short of offering any new impetus for the
Federal Reserve’s policy normalization efforts. The
U.S. Dollar Currency Index, which tracks the greenback against six major
currencies, was down 0.7% at 94.944, after slipping as low as 94.903, its
lowest since Nov. 11. U.S.
consumer prices surged in December, with the annual increase in inflation the
largest in nearly four decades, which could bolster expectations that the
Federal Reserve will start raising interest rates as early as March. The
consumer price index increased 0.5% last month after advancing 0.8% in
November, the Labor Department said on Wednesday. In the 12 months through
December, the CPI surged 7.0%, the biggest year-on-year increase since June
1982. Economists polled by Reuters had forecast the CPI gaining 0.4% and
shooting up 7.0% on a year-on-year basis. “The
U.S. economy appears ready for interest rate lift-off to start in March,”
said Joe Manimbo, senior market analyst at Western Union Business Solutions. “The dollar’s problem though is that the
market already has highly hawkish expectations for Fed policy this year. So
as hot as today’s CPI price was, it merely reinforced what’s already baked in
for the dollar and Fed policy,” Manimbo said. Federal
Reserve Chair Jerome Powell on Tuesday gave no clear indication that the Fed
was in a rush to speed up plans for tightening monetary policy, putting some
downward pressure on the greenback which has benefited from U.S. rate-hike
expectations in recent weeks. ″(It’s)
just a case of the market currently getting too ahead of itself with Fed
normalization; we will need to see this inflationary impact from Omicron
really play out for the Fed to hike four times and embark on quantitative
tightening this year I think,” said Simon Harvey, senior FX market analyst at
Monex Europe. “While
we don’t think today’s CPI release will derail the Fed’s likely liftoff in
March, continued reports of narrow inflation pressures will likely lead
markets to trim expectations of the normalization cycle across 2022 as a
whole, which will undoubtedly result
in sustained USD depreciation,” Harvey said. Traders
have priced in an about 80% chance of a rate hike in March, according to
CME’s FedWatch tool. The Australian dollar, often considered a
liquid proxy for risk appetite, rose 1.04% to a one-week high against the
U.S. dollar. The weaker greenback and higher oil prices helped lift the
Canadian dollar to its highest level in nearly two months. And
sterling was 0.56% higher, helped by the weaker dollar and a view that the
worst of the Omicron COVID-19 surge may be passing in Britain - helping pave
the way for another near-term rise in UK interest rates. Elsewhere,
bitcoin was 2.3% higher at $43,717.08, extending its rebound from the
five-month low touched on Monday. |
||||||||||||||||||||||||||||||||||||||||||||||||||||||||||||||||||||||||||||||||||||||||||||||||||||||||||||||||||||||||||||||||||||||||||||||||||||||||||||||||||||||||||||||||||||||||||||||||||||||||||||||||||||||||||||||||||||||||||||||||||||||||||||||||||||||||||||||||||||||||||||||||||||||||||||||||||||||||||||||||||||||||||||||||||||||||||||||||||||||||||||||||||||||||||||||||||||||||||||||||||||||||||||||||||||||||||||||||||||||||||||||||||||||||||||||||||||||||||||||||||||||||||||||||||||||||||||||||||||
Part III: Forex quote
What Are
Currency Pairs? (youtube)
Live Forex Quotes & Currency Rates | Forexlive 2/2/2022 When a currency is quoted, it is done in relation to another
currency, so that the value of one is reflected through the value of another. Therefore, if you are trying to determine the exchange rate
between the U.S. dollar (USD) and the Japanese yen (JPY), the forex quote
would look like this:
Base currency vs. quote currency (counter currency) This is
referred to as a currency pair. The currency to the
left of the slash is the base currency,
while the currency on the right is called the quote or
counter currency. The base
currency (in this case, the U.S. dollar) is always equal to one unit (in this
case, US$1), and the quoted currency (in this case, the Japanese yen) is what
that one base unit is equivalent to in the other currency. The
quote means that US$1 = 119.50 Japanese yen. In other words, US$1 can buy
119.50 Japanese yen. The forex quote includes the currency abbreviations for
the currencies in question. Direct Currency Quote vs.
Indirect Currency Quote There are two ways to quote
a currency pair, either directly or indirectly. A direct currency quote is
simply a currency pair in which the domestic currency is the quoted currency; while an indirect quote, is a currency
pair where the domestic
currency is the base currency. So if you were looking at the
Canadian dollar as the domestic currency and U.S. dollar as the foreign
currency, a direct quote would be USD/CAD, while an indirect quote would be
CAD/USD. The direct quote varies the domestic currency, and the base, or
foreign currency, remains fixed at one unit. In the indirect quote, on the
other hand, the foreign currency is variable and the
domestic currency is fixed at one unit. · Direct currency quote: foreign
currency / domestic currency, such as JPY / USD (one JPY for how many USD) · Indirect
currency quote: domestic currency / foreign currency, such as USD/JPY (one USD
for how many JPY) For example,
if Canada is the domestic currency, a direct quote would be 1.18
USD/CAD and means that USD$1 will purchase C$1.18 . The indirect quote
for this would be the inverse (1/1.18), 0.85 CAD/USD, which means with C$1,
you can purchase US$0.85. In the forex spot
market, most currencies are traded
against the U.S. dollar, and the U.S. dollar is frequently the base currency
in the currency pair. In these cases, it is called a direct quote. This
would apply to the above USD/JPY currency pair, which indicates that US$1 is
equal to 119.50 Japanese yen. However, not all currencies
have the U.S. dollar as the base. The
Queen's currencies - those currencies that historically have had a tie
with Britain, such as the British pound, Australian Dollar and New
Zealand dollar - are all quoted as the base currency against the U.S.
dollar. The euro is quoted the
same way as well. In these cases, the U.S. dollar is the counter
currency, and the exchange rate is referred to as an indirect quote. This is
why the EUR/USD quote is given as 1.25, for example, because it means that
one euro is the equivalent of 1.25 U.S. dollars. Most currency exchange rates are quoted out to four
digits after the decimal place, with the exception of the Japanese yen (JPY), which is
quoted out to two decimal places. Cross Currency ( You can find
the cross exchange rates at www.forex.com Summary: USD / JPY = 119.50 è 1 US$ = 119.5 YEN, to US residents this is
an indirect quote; to a Japanese, it is a direct quote. Base / quote JPY / USD = 1/119.50 è 1 YEN = (1/119.5)$, to US residents this is
a direct quote; to a Japanese, it is a indirect quote. Base / quote Direct quote = 1/(indirect
quote) or indirect
quote = 1/ (direct quote) *** Inverse relationship
|
||||||||||||||||||||||||||||||||||||||||||||||||||||||||||||||||||||||||||||||||||||||||||||||||||||||||||||||||||||||||||||||||||||||||||||||||||||||||||||||||||||||||||||||||||||||||||||||||||||||||||||||||||||||||||||||||||||||||||||||||||||||||||||||||||||||||||||||||||||||||||||||||||||||||||||||||||||||||||||||||||||||||||||||||||||||||||||||||||||||||||||||||||||||||||||||||||||||||||||||||||||||||||||||||||||||||||||||||||||||||||||||||||||||||||||||||||||||||||||||||||||||||||||||||||||||||||||||||||||||


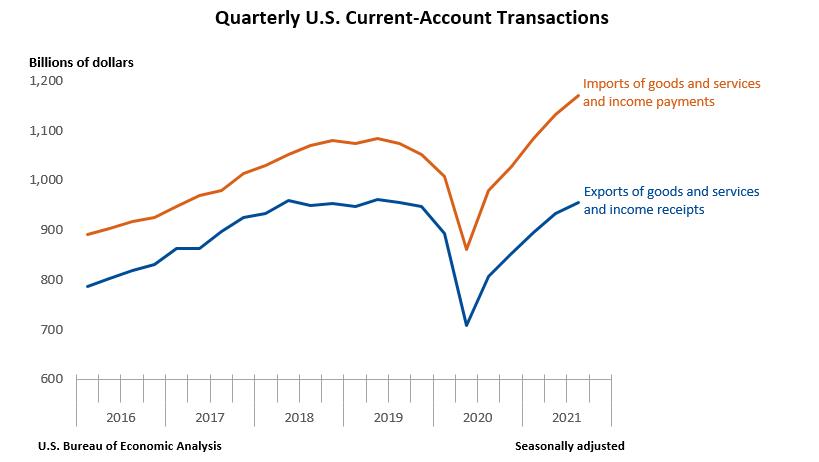


|
USD/CAD = 1.2000/05 |
If you want to buy this currency pair, this means that you
intend to buy the base currency and are therefore looking at the ask price to
see how much (in Canadian dollars) the market will charge for U.S. dollars. According to the ask price, you can buy one U.S. dollar with
1.2005 Canadian dollars.
However, in order to sell this currency pair, or sell the base
currency in exchange for the quoted currency, you would look at the bid
price. It tells you that the market
will buy US$1 base currency (you will be selling the market the base
currency) for a price equivalent to 1.2000 Canadian dollars, which is the
quoted currency.
Whichever currency is quoted first (the base currency) is
always the one in which the transaction is being conducted. You either buy or sell the base currency. Depending on what
currency you want to use to buy or sell the base with, you refer to the
corresponding currency pair spot exchange rate to determine the price.
(https://www.investopedia.com/university/forexmarket/forex2.asp)
Exercise
I:
Assume you have $1000 and bid
rate is $1.52/£ and ask rate is $1.60 /£.
GBP/USD = 1.5200/1.6000
Meanwhile, the bid rate is
quoted as 0.625 £/$ and the ask rate is quoted as 0.6579 £/$.
USD/GBP = 0.6250 /0.6579
If you convert it to £ and
then convert it back to $, what will happen?
Answer:
Sell at bid and buy at ask price (ask is always
higher than bid so you buy high and sell low, since you are dealing with the
bank).
You can either buy and sell dollar:
with $1000, you sell at bid 0.625
£/$ so you get 625£
($1000* 0.625 £/$ = 625£). With
625£, you sell at bid $1.52/£, so you get $950 (625£ * $1.52/£ = $950)
Or with 625£, you can buy $ at ask price 0.6579
Note: It
is easier to use USD/GBP to get £ first, since USD/GBP is based on one
dollar’s equivalent value in £. Then it is easier to use GBP/USD to get back
$, since GBP/USD is based on the equivalent value of £ in $.
Exercise II:
Suppose the spot ask exchange rate is
$1.90 = £1.00 and the spot bid exchange rate is $1.89 = £1.00. If you were to
buy $1,000,000 worth of £ and then sell them 10 minutes later, how much of
your $1,000,000 would be lost by the bid-ask spread? (Hint: You buy at ask
and sell at bid)
Answer:
 GBP at $1.60 /£ and buy $ at 0.6579
£/$. So $1000 / 1.6 $/£ * 0.6579
£/$ = $950
GBP at $1.60 /£ and buy $ at 0.6579
£/$. So $1000 / 1.6 $/£ * 0.6579
£/$ = $950
Exercise III: The AUD/$ spot exchange rate is AUD1.60/$ and the
SF/$ is SF1.25/$. The AUD/SF cross exchange rate is: (answer: 1.2800)

The COVID-19 Crisis Brings Volatility Back to
the FX Market (FYI)
Apr 21,
2020, Francois Lamy
Strategy
Director, FXall
Amid a global health and
economic crisis caused by the spread of COVID-19, the FX market is
experiencing heightened levels of volatility and thinner liquidity. Refinitiv’s market-leading FX platform provides unique insight into
recent market conditions.
FX trading volumes and volatility have soared on the back of
market turmoil in equity and fixed income markets. FX traders must navigate challenging market conditions including
widening spreads and thin liquidity.
A deeper look at Refinitiv’s market-leading FX platform reveals how spreads evolved in
the Dealer-to-Dealer and Dealer-to-Customer markets.
A serious test of FX trading continuity plans
The unprecedented health and economic crisis caused by the
spread of Covid-19 has caused major disruption in financial markets
worldwide, putting the business continuity plans of all market participants
to the test.
Over the last few weeks, FX
trading professionals have endured a tremendous amount of pressure on their
trading operations, technology, and infrastructure, especially as a majority
of them shifted to working from home.
Technology and platform providers including Refinitiv have
been at the forefront of the industry’s response to the crisis.
“We appreciate how critical our systems and services are to the
FX market”, said Neill Penney, Managing Director and
Global Head of Trading at Refinitiv, “which is why we have been closely monitoring the situation and
taking the steps we need to stay resilient and keep clients trading.
In addition to investing strongly in our own business
continuity and resilience measures, we have actively reached out to all of
our FX clients to ensure we can understand their BCP arrangements and help
them achieve practical and appropriate solutions where they are needed”.
Our survey of FX clients revealed that most clients prefer
staff work from home or from locations already identified and tested for
business continuity.
A spike in activity and volatility
In the midst of these
operational challenges, FX traders have had to deal with levels of volatility
unseen in recent years,
as illustrated below by the Deutsche Bank Currency Volatility Index that
tracks expected volatility in the FX market.
As the equity and fixed income markets were affected by a
market correction on a scale not seen since the great recession, increased FX
trading activity has resulted in liquidity providers and FX trading platforms
reporting record volumes.
Refinitiv clients across the buy-side and sell-side rely on us
more-than-ever to access market-leading OTC liquidity. In March daily trading
volumes averaged $540 billion across all Refinitiv FX platforms, a new record
high since Refinitiv began publishing volumes. Average daily volume for Spot
FX across all Refinitiv platforms reached $141 billion in March, the highest
since September 2014.
Buy-side traders rely on innovative workflow solutions to
handle the increase in activity
Buy-side institutions, especially those managing international
equity or fixed income portfolios, are having to leverage their full range of
bilateral trading relationships with bank and non-bank market makers to deal
with greater FX trading needs. On FXall, Refinitiv’s multi-dealer platform, trading volumes in March increased by
25% year over year. As one would expect, this significant uptick in activity
is mainly driven by the asset management segment with a 45% year over year
increase over the same period.
Originally centered around execution methods that allow users
to secure the best price from a panel of liquidity providers (via
request-for-quote and streaming prices), leading multi-dealer platforms have
expanded their core capabilities over time. FXall’s advanced workflow solutions and execution tools have been
critical in helping the buy-side safely cope with much larger volumes from
their remote or virtual work environments. FXall clients rely daily on a
broad range of features, including:
Pre-trade order netting (including cross-currency netting and
netting of same pair exposures that have different dealt currencies) to
submit orders to the market for the most cost-effective execution possible.
Batch trading workflow and rules-based auto-execution, in
order to automate all or portions of clients’ trading activity and increase operational efficiency.
Execution algorithms and other advanced order types that help
users access liquidity in smarter ways, minimizing market impact as well as
information leakage.
Sophisticated business intelligence to assess trading
performance, identify improvement opportunities and enhance provider
selection.
Regulatory reporting, audit trails and transaction history for
robust risk management and compliance.
Deep liquidity in the primary market allows efficient risk
transfer in times of turmoil
On the other hand, while sell-side liquidity providers are
benefiting from increased client activity, they are also having to push more
of their hedging flow through electronic inter-dealer platforms. That is
partly due to the fact that their clients’ positions have tended to move in the same direction through
the market correction, causing the banks’ internal matching rates to decrease. Recent market commentary
also indicates that the voice brokerage model of inter-dealer brokers has not
proven as resilient in remote or virtual work environments.
Refinitiv’s Matching platform, one of
the historical primary markets for interdealer trading in FX, recently saw
Spot volumes spike to levels last seen during the UK Brexit referendum of
June 2016 and the November 2016 US presidential election, and also broke
record highs for Forwards Matching. The benefits of trading on a platform
like Matching include:
High certainty of execution: with firm orders only, when two
orders are matched, as long as the counterparties have available bilateral
credit in the system, the trade will be completed.
Pre-trade anonymity: when used strategically anonymous trading
can allow institutions to minimize market impact and transaction costs.
Price transparency and access to market data: users have
visibility into order and price information from the order book (such as best
prices, last traded prices), and market data feeds are also available (both
real-time and historical data) to facilitate model/algo back-testing,
benchmarking and transaction cost analysis.
While multi-dealer platforms offer the benefit of
relationship-adjusted liquidity, the need to ensure access to deep liquidity
even during times of market turmoil is also driving interest in primary
markets on the buy-side as well.
Widening spreads and thinning liquidity
While the general consensus is the FX market has proven robust
in recent weeks, able to sustain a substantial spike in activity, market participants
have observed a significant widening of spreads as well as thin liquidity at
times for larger ticket sizes.
Buy-side traders are dealing
with deteriorating liquidity conditions, including a widening of spreads
quoted by their liquidity providers and lower levels of liquidity available
for certain amounts. Through periods of
illiquidity they are having to spend more time to get normal business done. The sell-side is echoing similar remarks,
observing very wide spreads and erosion of liquidity in certain instrument
types or currency pairs, notably in some emerging market currencies.
The unparalleled breadth and depth of FX trading conducted on
Refinitiv platforms offers a unique glimpse into how spreads have evolved since
the beginning of the year in the inter-dealer and dealer-to-client markets.
The first chart illustrates
how spreads for GBP/USD, AUD/USD, and USD/CAD on Refinitiv’s Spot Matching platform increased sharply
on March 9th, rising steadily thereafter and peaking around March 23rd. As
market conditions gradually improved, we can observe spreads starting to
decline around March 25th.
This second chart illustrates how spreads evolved on Refinitiv
FXall, a leading multi-dealer platform where buy-side market participants
trade on a disclosed basis with their liquidity providers. A similar trend is
observable, with a sharp increase in spreads starting once again on March
9th, followed by a decline beginning around March 20th.
Buy-side usage of algos on the rise
Facing a very heavy workload in tough market conditions, the
buy-side is turning to smart tools to enhance their trade execution.
While the rise in adoption of execution algorithms in FX has
been well documented, recent usage trends confirm algos have become an
everyday tool for the buy-side, and not just in times of low volatility.
For the most part, buy-side traders have become familiar with
the benefits of using bank algos, such as the potential to reduce the market
impact of large trades through the stealthy placement of orders across one or
more trading venues.
Another key benefit is the potential to generate cost savings
by minimizing spread paid. Buy-side traders are now confirming they are
willing to bear market risk even in times of high volatility in order to
avoid paying significant bid/offer spreads. Passive algo strategies in
particular have been very popular, as they allow a trader to post resting
interest in trading venues and capture spreads over time.
On FXall, algo trading volumes in March increased by 380% year
over year, with the bulk of the increase once again attributable to asset
management clients. Not only did existing algo users rely on these automated
execution strategies to execute much larger amounts than usual, there was also
significant interest from institutions using algos for the first time.
Naples waste management and
Italy’s first bank (PPT, prepared by Theodore and Christian. Thank you)
Part V: Eurodollar, Eurobond
Eurodollar
The term eurodollar refers
to U.S. dollar-denominated deposits at foreign banks or at the overseas
branches of American banks. By being located outside the
United States, eurodollars escape regulation by the Federal Reserve
Board, including reserve requirements. Dollar-denominated
deposits not subject to U.S. banking regulations were originally held almost
exclusively in Europe, hence the name eurodollar. They are also widely
held in branches located in the Bahamas and the Cayman Islands.
(https://www.investopedia.com/terms/e/eurodollar.asp)
Euroyen
By ADAM HAYES Updated December 08, 2020, Fact checked
by DANIEL RATHBURN
What Are Euroyen?
The term
euroyen refers to all Japanese yen (JPY)-denominated deposits held outside of
Japan. It can also refer to trading in yen in the eurocurrency market.
A eurocurrency is any currency held or traded outside
its country of issue, and euroyen thus refers to all Japanese yen (JPY)
deposits held or traded outside Japan. The "euro-" prefix in the
term arose because originally such overseas currencies were held primarily in
Europe, but that is no longer the case and a eurocurrency can now involve any domestic currency that is held
anywhere else in the world that local banking regulations permit.
KEY TAKEAWAYS
·
Euroyen refers to
deposits denominated in Japanese yen (JPY) held outside of Japan itself.
·
Also known as offshore yen, the establishment of
Euroyen allowed Japan to liberalize its capital markets and grow its position
in international trade.
·
Rates on euroyen are set against a benchmark: either
Euroyen TIBOR or Yen LIBOR.
Understanding Euroyen
Euroyen can
also be referred to as "offshore yen," and refers to japanese yen
held overseas. The offshore yen market
was initially established in December 1986 as part of the liberalization and
internationalization of Japanese financial markets and increased the
country's stature in terms of global trade.
There are two euroyen benchmark rates: Euroyen TIBOR
(published at 1 p.m. Tokyo time, with a panel dominated by Tokyo banks) and
the Yen LIBOR (London Interbank Offered Rate, published at 11:55 a.m. London
time with a panel dominated by non-Japanese banks in London).
Both domestic JPY and euroyen TIBOR rates are published
by the Japanese Bankers Association (JBA), but after the LIBOR manipulation
scandal broke in 2012 they have been published by a focused entity called the
JBA TIBOR Administration (JBATA) in an effort to enhance the credibility of
the published rates.
Both Yen LIBOR and Euroyen TIBOR rates were caught up
in the LIBOR scandal. A number of large banks, both Japanese and foreign,
paid hundreds of millions of dollars in settlement of euroyen-related claims
and associated penalties arising from the case.
The Intercontinental
Exchange, the authority responsible for LIBOR, will stop publishing one-week
and two-month USD LIBOR after Dec. 31, 2021. All other LIBOR will be
discontinued after June 30, 2023.
Euroyen Examples
Examples of euroyen would be yen deposits held in U.S.
banks or banks elsewhere in Asia, and yen traded in London. Like all eurocurrencies, euroyen
deposits fall outside the regulatory purview of the national central bank of
the home country, the Bank of Japan (BoJ) in this case. Therefore, euroyen deposits
may offer slightly different interest rates than those available for yen
deposits in Japan.
Rates
on JPY deposits in Japan are directly affected by interest rates set by the
Bank of Japan and by liquidity in the Japanese money market, and are linked
to a rate called Japanese yen Tokyo Interbank Offered Rate (TIBOR). Euroyen
deposit rates, by contrast, are set in the eurocurrency market.
Advantages and
Disadvantages of Eurocurrency Markets
·
The main benefit of eurocurrency markets is that they are
more competitive. They can simultaneously offer lower interest rates for
borrowers and higher interest rates for lenders.
·
That is mostly because eurocurrency markets are less
regulated.
·
On the downside, eurocurrency markets face higher risks,
particularly during a run on the banks.
What is a Eurobond What is
EUROBOND? What does EUOBOND mean? (video)
A eurobond is denominated in a
currency other than the home currency of the country or market in which it is
issued. These bonds
are frequently grouped together by the currency in which they are
denominated, such as eurodollar or euroyen bonds. Issuance is usually handled
by an international syndicate of financial institutions on behalf of the
borrower, one of which may underwrite the bond, thus guaranteeing purchase of
the entire issue. https://www.investopedia.com/terms/e/eurobond.asp
HOMEWORK II (CHAPTER 3) (Due with
the first mid term exam)
2. “SOFR
Is Replacing Libor in the U.S”. What is Libor? What is SOFT?
3. What is your opinion about
the dollar strengthening in 2022? Why or why not?
· 4. List 3
factors that would cause the exchange rate of the U.S. dollar, in terms of
Yen, to increase.
5. What is impossible trinity?
6. Bid/Ask
Spread
Compute the bid/ask percentage spread for Mexican peso retail
transactions in which the ask rate is $.11 and the bid rate is
$.10. HINT: BID ASK SPREAD = (ASK-BID)/ASK (Answer:
9.09%)
If the direct exchange rate of the euro is
worth $1.25, what is the indirect rate of the euro? That is, what is the
value of a dollar in euros? (Answer:
0.8€)
8. Cross Exchange Rate
Assume Poland currency (the zloty) is worth
$.17 and the Japanese yen is worth $.008. What is the cross rate of the zloty
with respect to yen? That is, how many yen equal a zloty? (Answer:
21.25¥)
9. Foreign Exchange
You just came back from Canada, where the
Canadian dollar was worth $.70.
You still have C$200 from your trip and could
exchange them for dollars at the airport, but the airport foreign exchange
desk will only buy them for $.60. Next week, you will be going to Mexico and
will need pesos. The airport foreign exchange desk will sell you pesos for
$.10 per peso. You met a tourist at the airport who is from Mexico and is on
his way to Canada. He is willing to buy your C$200 for 1,300 pesos. Should
you accept the offer or cash the Canadian dollars in at the airport?
Explain. (Answer: You can only get $1,200 peso if you accept the
offer in the airport)
10. What is Eurodollar? What is
Euroyen? What is Eurobond?
11. What is the name of the world’s
first bank? What are
the major causes of the Naples’ waster management crisis?
Bretton Woods and the Growth of the
Eurodollar Market
January
20, 2022
By Paulina Restrepo Echavarria , Praew Grittayaphong
As
World War II raged on, delegates from 44 Allied nations gathered at a hotel
in Bretton Woods, N. H., to lay
out foundations for the reconstruction of the international financial system.
The hope was to prevent a repetition
of competitive devaluations in the 1930s and to create a stable economic and
financial environment for nations to operate in. This resulted in an
agreement for countries to fix their exchange rates to the U.S. dollar and
the U.S. to peg the dollar to gold.
The fixed exchange rate system constrained
the economic policies of many nations, causing policymakers to adopt
capital/exchange control measures to keep their monetary autonomy. However, the
control measures were not always effective and economic agents around the
world began to find loopholes in the system. Among these was the emergence of
the eurodollar market: a market for short-term deposits denominated in U.S.
dollars at banks outside U.S. territory (PDF), particularly in London.
The
Origins and the Spread of the Eurodollar Market
Although
there are many possible factors that contributed to the development of the
eurodollar market, numerous accounts cited exchange controls implemented by
the U.K. in 1957 as the earliest impetus for this development. In response to
a potential drain on reserves caused by higher inflation and the Suez crisis,
the British government placed severe restrictions (PDF) on sterling credits
to nonresidents and banned the use of sterling to finance third-party
transactions. To circumvent this issue, the London banks started using dollar
deposits as credit instruments for nonresidents.
Another
possible factor that drove the demand for dollar deposits was profitable
investment opportunities in the U.K. and the financial innovation that
followed. During the period of tight monetary policy in the U.K., Midland
Bank was able to seek funds denominated in dollar to obtain sterling at a
lower interest rate. The bank had bid 30-day dollar-denominated deposits at
an interest rate (1.875%) that was higher than the maximum payable under
Regulation Q in the U.S., sold these dollars spot for sterling and bought
dollars back at a premium of 2.125%. This method helped the bank obtain
sterling at the rate of 4% during a time when Bank Rate was 4.5%, according
to a 1998 article by Catherine R. Schenk. With tight monetary policy, relatively relaxed controls on the
forward exchange market and opportunities for profitable interest arbitrage,
the eurodollar market began to expand rapidly.
Rapid
Growth in the Eurodollar
The
figure below shows the estimated size of the eurodollar market during the
heyday of the Bretton Woods era.

Net
Size in the Eurodollar Market
SOURCES:
Bank for International Settlements annual reports, FRED and authors’
calculations.
NOTES:
The figures are based on the dollar liabilities reported by the banks of the
eight reporting European countries (Belgium, France, Germany, Italy,
Netherlands, Sweden, Switzerland and the U.K.) vis-à-vis banks and nonbank
residents outside their own area and vis-à-vis nonbank residents inside the
reporting area. For more information, see the BIS annual report (PDF) for
1969.
We can see that from 1964 to 1969, the
estimated market size of eurodollar market grew over 252% from $75 billion of
2020 dollars to $264 billion. As the U.S. administration tried to control the
outflow of dollars, multinational corporations, eager to find profitable
usage of their surplus dollar balances, and banks, equally eager to
accommodate demand, found way to get around the controls.
Following
its emergence, the eurodollar market played a big role in the Bretton Woods
system and also its breakdown and eventual demise in the early 1970s.
https://www.barchart.com/futures/quotes/GE*0/futures-prices
Eurodollar
Dec '22 (GEZ22)
98.3650 +0.0100 (+0.01%) 20:40
CT [CME]
98.3650 x 15 98.3700 x 1706
EURODOLLAR PRICES for Mon, Feb 7th, 2022
Latest
futures price quotes as of Sun, Feb 6th, 2022.|
|
Last |
Change |
Open |
High |
Low |
Previous |
Volume |
Open Int |
Time |
Links |
|
99.5825 |
+0.0150 |
99.5800 |
99.5850 |
99.5750 |
99.5675 |
286 |
170,854 |
19:46 CT |
||
|
99.4000 |
+0.0050 |
99.4000 |
99.4050 |
99.3900 |
99.3950 |
8,398 |
976,565 |
20:40 CT |
||
|
99.2200 |
unch |
99.2250 |
99.2250 |
99.2200 |
99.2200 |
203 |
112,028 |
19:45 CT |
||
|
99.0850 |
-0.0050 |
99.0850 |
99.0850 |
99.0850 |
99.0900 |
412 |
18,940 |
19:43 CT |
||
|
98.9650 |
+0.0100 |
98.9650 |
98.9750 |
98.9400 |
98.9550 |
19,037 |
1,008,741 |
20:41 CT |
||
|
98.8550s |
-0.1400 |
0.0000 |
98.8550 |
98.8550 |
98.9950 |
645 |
10,054 |
02/04/22 |
||
|
98.6600 |
+0.0150 |
98.6600 |
98.6700 |
98.6350 |
98.6450 |
14,641 |
809,730 |
20:41 CT |
||
|
98.3650 |
+0.0100 |
98.3700 |
98.3800 |
98.3450 |
98.3550 |
9,648 |
1,199,683 |
20:40 CT |
Chapter 4 Exchange
Rate Determination
Part I: What determines the
strength of a currency?
Currency value
is determined by demand and supply, if not manipulated by the government.
What Determines The Strength Of A Currency?
Q: What
factors determine the strength of a currency?
A: Currency trading is complicated by the
fact that there are so many factors involved. Not only are there a number of country-specific variables that
go into determining a currency's strength, but there are also other
benchmarks--other currencies, for example, as well as commodities--against
which a currency's strength can be measured.
However,
three crucial factors are as follows:
1. Interest rates. High interest rates help promote a strong currency,
because foreign investors can get a higher return by investing in that
country. However, the level of interest
rates is relative. You've probably noticed that interest rates on CDs, savings accounts and money market accounts are
very low right now. So are U.S. Treasury bond rates and the U.S. federal funds rate. Ordinarily,
this would weaken the U.S. dollar, except for the fact that interest rates
behind other major world currencies are also low.
3.
Stability. A strong government with a well-established rule of law
and a history of constructive economic policies are the type of things that attract investment and
thus promote a strong currency. In the case of the U.S. dollar, its strength
is further augmented by the fact that commodities are generally traded in
dollars, and many countries use the dollar as a reserve currency.
Speaking of stability, that is probably what governments seek
for their currencies, more so than strength. A strong currency makes
a country's exports more expensive, hurting that nation's trade competitiveness.
On the other hand, a weak currency makes imports more expensive, boosting
domestic inflation. So the ideal course is to aim down the middle and avoid
destabilizing fluctuations.
http://www.investopedia.com/video/play/main-factors-influence-exchange-rates/ (VIDEO)
Please
also read the following article to learn more about how changes in demand and
supply work on exchange rate.
The foreign exchange market
involves firms, households, and investors who demand and supply currencies
coming together through their banks and the key foreign exchange dealers. Figure 1 (a)
offers an example for the exchange rate between the U.S. dollar and the
Mexican peso. The vertical axis shows the exchange rate for U.S.
dollars, which in this case is measured in pesos. The horizontal
axis shows the quantity of U.S. dollars being traded in the foreign exchange
market each day. The demand curve (D) for U.S. dollars intersects with the
supply curve (S) of U.S. dollars at the equilibrium point (E), which is an
exchange rate of 10 pesos per dollar and a total volume of $8.5 billion.

Figure
1. Demand and Supply for the
U.S. Dollar and Mexican Peso Exchange Rate. (a) The quantity measured on the horizontal
axis is in U.S. dollars, and the exchange rate on the vertical axis is the
price of U.S. dollars measured in Mexican pesos. (b) The quantity measured on
the horizontal axis is in Mexican pesos, while the price on the vertical axis
is the price of pesos measured in U.S. dollars. In both graphs, the
equilibrium exchange rate occurs at point E, at the intersection of the
demand curve (D) and the supply curve (S).
Figure 1 (b)
presents the same demand and supply information from the perspective of the
Mexican peso. The vertical axis shows the exchange rate for Mexican pesos,
which is measured in U.S. dollars. The horizontal axis shows the quantity of
Mexican pesos traded in the foreign exchange market. The demand curve (D) for Mexican
pesos intersects with the supply
curve (S) of Mexican pesos at the equilibrium point (E), which
is an exchange rate of 10 cents in U.S. currency for each Mexican peso and a
total volume of 85 billion pesos. Note that the two exchange rates
are inverses: 10 pesos per dollar is the same as 10 cents per peso (or $0.10
per peso). In the actual foreign exchange market, almost all of the
trading for Mexican pesos is done for U.S. dollars. What factors would cause
the demand or supply to shift, thus leading to a change in the equilibrium exchange rate? The answer
to this question is discussed in the following section.
Expectations
about Future Exchange Rates
One
reason to demand a currency on the foreign exchange market is the belief that
the value of the currency is about to increase. One reason to supply a
currency—that is, sell it on the foreign exchange
market—is the expectation that the value of the
currency is about to decline. For
example, imagine that a leading business newspaper, like the Wall Street Journal or the Financial Times, runs an article
predicting that the Mexican peso will appreciate in value. The likely effects
of such an article are illustrated in Figure 2.
Demand for the Mexican peso shifts to the right, from D0 to D1, as investors become eager to purchase pesos.
Conversely, the supply of pesos shifts to the left, from S0 to S1, because investors
will be less willing to give them up. The result is that the equilibrium
exchange rate rises from 10 cents/peso to 12 cents/peso and the equilibrium
exchange rate rises from 85 billion to 90 billion pesos as the equilibrium
moves from E0 to
E1.

Figure
2. Exchange Rate Market for
Mexican Peso Reacts to Expectations about Future Exchange Rates. An
announcement that the peso exchange rate is likely to strengthen in the
future will lead to greater demand for the peso in the present from investors
who wish to benefit from the appreciation. Similarly, it will make investors
less likely to supply pesos to the foreign exchange market. Both the shift of
demand to the right and the shift of supply to the left cause an immediate
appreciation in the exchange rate.
Figure 2 also
illustrates some peculiar traits of supply and demand diagrams in the foreign
exchange market. In contrast to all the other cases of supply and demand you
have considered, in the foreign
exchange market, supply and demand typically both move at
the same time. Groups of participants in the foreign exchange market like
firms and investors include some who are buyers and some who are sellers. An expectation
of a future shift in the exchange rate affects both buyers and sellers—that is, it affects both demand and supply for a currency.
The
shifts in demand and supply curves both cause the exchange rate to shift in
the same direction; in this example, they both make the peso exchange rate
stronger. However, the shifts in demand and supply work in opposing
directions on the quantity traded. In this example, the rising demand for
pesos is causing the quantity to rise while the falling supply of pesos is
causing quantity to fall. In this specific example, the result is a higher
quantity. But in other cases, the result could be that quantity remains
unchanged or declines.
This
example also helps to explain why exchange rates often move quite substantially
in a short period of a few weeks or months. When investors expect a country’s currency to strengthen in the future, they buy the
currency and cause it to appreciate immediately. The appreciation of the
currency can lead other investors to believe that future appreciation is
likely—and thus lead to even further appreciation.
Similarly, a fear that a currency might weaken
quickly leads to an actual weakening
of the currency, which often reinforces the belief that the currency is going
to weaken further. Thus, beliefs about the future path of exchange
rates can be self-reinforcing, at least for a time, and a large share of the
trading in foreign exchange markets involves dealers trying to outguess each
other on what direction exchange rates will move next.
In class
exercise (refer to PPT for answers)
Think about
the changes in demand and supply when the following changes occur. And draw
demand and supply curve to explain.
1) Inflation goes up è currency demand high or
low? è currency value up or down?

2) Real interest rate goes
up è currency demand high or low? è currency
value up or down?

3)
Domestic residents’ income goes
up è currency demand high or low? è currency
value up or down?
· Current account goes up è currency
demand high or low? è currency value up or down?
4) Public debt goes up è currency
demand high or low? è currency value up or down?

5)
Recession
or crisis è currency demand high or low? è currency
value up or down?
6) Other accidental events è currency
demand high or low? è currency value up or down?
Note:
· For the each of
the scenarios above, can you draw the demand and supply curve?*
· If not yet,
please watch the following video. Supply and demand curves in foreign exchange by
Khan Academy (video)
Part
II: Fixed exchange rate vs. floating exchange rate
Speculative
attack on a currency | Khan Academy (optional)
The country cannot, however, fix exchange rates, allow
capital to flow freely and maintain
monetary policy sovereignty. For example, Country X links its
currency, the X pound, to the Y franc at a one-to-one ratio. This is
effective if both Country X and Country Y's central banks maintain a policy
rate of 3%. But if Country Y raises interest rates to combat rising
inflation, investors would spot an opportunity for arbitrage. X pounds
would flood over the border to buy Y francs and earn the higher interest rate.
Y francs would in effect become worth more than X pounds. Thus,
either Country X abandons the currency peg and allows the X pound to
fall, raises its policy rate to match Country Y's policy
rate abandoning monetary policy independence or it sets
up capital controls to keep X pounds in the country.
Real-world examples of these
trade-offs include the eurozone where countries have opted for side A of
the triangle: they forfeit monetary policy control to the European
Central Bank but maintain a single currency (in
effect a one-to-one peg coupled with free capital flow). The difficulties of
maintaining a monetary union across economies as different as Germany and
Greece have become clear as the latter has repeatedly appeared poised to drop
out of the currency bloc.
Following World War II, the wealthy
opted for side C under the Bretton Woods system, which pegged currencies to
the dollar but allowed them to set their own interest rates. Cross-border
capital flows were so small that the system held for a couple of decades – the exception being Mundell's native Canada, a
situation that gave him special insight into the tensions inherent in
the system. Today, most countries allow their currencies to float,
meaning they opt for side B.
Analysis
of the Best Currency Pairs to Trade
• USD/EUR –
This can be considered the most popular currency pair. In addition, it has
the lowest spread among modern world Forex brokers. This currency pair is
associated with basic technical analysis. The best thing about this currency
pair is that it is not too volatile. If you are not in a position to take any
risks, you can think of selecting this as your best Forex pair to trade,
without it causing you too much doubt in your mind. You can also find a lot
of information on this currency pair, which can help prevent you from making
rookie mistakes.
• USD/GBP
– Profitable pips and possible large jumps have contributed a lot towards the
popularity of this currency pair. However, you need to keep in mind that
higher profits come along with a greater risk. This is a currency pair that
can be grouped into the volatile currencycategory. However, many traders
prefer to select this as their best currency pair to trade, since they are
able to find plenty of market analysis information online.
• USD/JPY
– This is another popular currency pair that can be seen regularly in the
world of Forex trading. It is associated with low spreads, and you can
usually follow a smooth trend in comparison with other currency pairs. It
also has the potential to deliver exciting, profitable opportunities for
traders.
Special
Pairs (Or Exotic Currency Pairs)
Typically
the best pair for you is the one that you are most knowledgeable about. It
can be extremely useful for you to trade the currency from your own country,
if it is not included in the majors, of course. This is only true if your
local currency has some nice volatility too. In general, knowing your
country's political and economical issues results in additional knowledge
which you can base your trades on.
You
can find such information through economic announcements in our Forex
calendar, which also lists predictions and forecasts concerning these
announcements. It is also recommended to consider trading the pairs that contain
your local currency (also known as 'exotic pairs'). In most cases, your local
currency pair will be quoted against USD, so you would need to stay informed
about this currency as well.
• From https://admiralmarkets.com/education/articles/forex-basics/what-are-the-best-currency-pairs-to-trade
Argentina faces $1.1 billion debt repayment
deadline as IMF protests simmer
By Adam
Jourdan and Miguel Lo Bianco, January 27, 2022
BUENOS
AIRES, Jan 27 (Reuters) - Argentina is
facing deadlines for nearly $1.1 billion in debt repayments to the
International Monetary Fund (IMF) by Tuesday amid uncertainty over
whether the South American country will pay and tense talks to revamp around
$40 billion in loans.
The
grains-producing country, which has been battling currency and debt crises
for years, is due to pay back $730
million to the IMF on Friday and another $365 million on Tuesday though officials
have not confirmed plans to pay.
Cabinet
Chief Juan Manzur said there was "political decisiveness and eagerness
to pay" the IMF, according to official news outlet Telam.
The IMF
did not immediately respond to a request for comment on the looming payments.
That
has hit sovereign bond prices, some of which have tumbled to below 30 cents
on the dollar. More hard-left politicians within the ruling Peronist
coalition have also started hardening their rhetoric against the IMF.
"What we are proposing is not only to stop
paying the debt and break with the IMF, but to restructure the entire economy
according to the needs of the majority," said Celeste Fierro as she
marched in the city outside the central bank building.
Fierro, like others in the march, said the
country should not pay back its IMF debts: "We believe in ... breaking
with the IMF and ignoring this debt, which is a scam."
Vilma
Ripol, another marcher, said the payments should be suspended and that
Congress should investigate the debt
to avoid a repeat of the 2001 economic crisis.
"It was a disaster in 2001 that took us
years to recover and we had paid,"
she said. "We kept paying and our society kept on going down. Enough
already."
Argentina 2022 inflation to reach 54.8%
-cenbank poll
Reuters
Jan 7
(Reuters) - Inflation in Argentina is
expected to reach 54.8% at the end of 2022, according to a central bank
poll of analysts released on Friday, 2.7 percentage points higher than
estimated in the same survey last month.
The
poll also showed that analysts expect
the economy to grow 2.9% this year, according to the median forecast, up
from 2.5% in the previous poll.
Analysts
also expect Argentina's embattled peso to currency to fall further, with the official rate hitting 163.74 pesos
per dollar by December and 229.18 pesos per dollar by the end of 2023. Today,
it trades at 103.29 pesos per dollar.
In the black market, the Argentine peso is
often worth half the official rate.
The
third-largest economy in Latin America has suffered from high inflation for
years and has recently begun to recover from a long recession exacerbated by the COVID-19 pandemic.
The
monthly Market Expectations Survey poll surveyed 37 analysts between Dec. 27
and Dec. 30, the bank said in a statement.
The
analysts polled also estimated that December inflation reached 3.4%.
3 Financial Crises in the
21st Century
By SEAN ROSS Updated August 30, 2021, Reviewed by ROBERT C.
KELLY, Fact checked by KIRSTEN ROHRS SCHMITT
https://www.investopedia.com/articles/investing/011116/3-financial-crises-21st-century.asp
The 21st century has proven to be as economically tumultuous
as the two preceding centuries. This period has seen multiple financial
crises striking nations, regions, and—in the case of the Great Recession—the
entire global economy. All financial crises share certain characteristics,
but each tells its own unique story with its own unique lessons for the
future. Read on to learn more about the three most notable financial crises
the world experienced in the 21st century.
KEY TAKEAWAYS
·
Financial crises and
fiscal crises have differences and similarities.
·
There have been at least
three notable financial crises in the 21st century.
·
Argentina experienced a
financial crisis between 2001 and 2002, which led the country's government to
lose access to capital markets.
·
The 2007–2009 global
financial crisis is considered the worst global economic crisis since the
Great Depression.
·
Falling commodity prices
and the annexation of Crimea and Ukraine led to the collapse of Russia's
economy.
Financial vs. Fiscal Crises
Financial and fiscal crises
can occur for a number of reasons and be caused by both internal and external
factors. A crisis could emanate from within a nation's financial system or
federal government.
Conversely, an exogenous event, such as a natural disaster or
global recession, could send a country into a financial and fiscal crisis.
Although they may occur simultaneously, there are distinct differences
between a financial and fiscal crisis.
A financial crisis is a generalized term for systemic problems
in the larger financial sector of a country or countries. Financial crises
often, but not always, lead to recessions. If the U.S. banking sector
collectively makes poor lending decisions, or if it is improperly regulated
or taxed, or if it experiences some other exogenous shock that causes
industry-wide losses and loss of share prices, that's a financial crisis.
Of all the sectors in an economy, the financial sector is considered
to be the most dangerous epicenter of a crisis since every other sector
relies on it for monetary and structural support.
2001–2002 Argentine Economic
Crisis
Argentine crises have been a familiar feature since the great
financial panic of 1876. The country experienced its first crisis of the 21st
century from 2001–2002, which involved the combination of a
currency crisis and a financial panic. An
unsuccessful hard currency peg to the U.S. dollar left the Argentine peso in
disarray.
Bank depositors panicked when the Argentine government flirted with a deposit
freeze, causing interest rates to spike sharply.
On Dec. 1, 2001, Minister of Economy Domingo Cavallo enacted a
freeze on bank deposits. Families were locked away from their savings, and
inflation rates hit an astronomical 5,000%. Within the week, the
International Monetary Fund (IMF) announced it would no longer offer support
to Argentina as the country was deemed a serial defaulter. International authorities didn't believe
proper reforms would actually take place.
Financial Crisis
The Argentine government lost access to the capital markets
and private Argentine financial institutions were cut off as well. Many
businesses closed. Some foreign banks—which were a large presence—pulled out rather than risk their assets. The erratic and
extreme nature of interest rates made it virtually impossible for any
financial firm to function properly.
The Argentine banking sector was lauded for its progressive
regulations in the late 1990s, but that didn't stop the carnage of the 2001–2002 crash. By 2002, the default rate
among bond issuers was nearly 60%. Local debtors didn't fare any better, and
their subsequent nonpayments crushed commercial lenders.
The government of Argentina didn't fare much better. With the economy in a downward spiral,
high unemployment, and no access to credit markets, the Argentine government
defaulted on $100 billion worth of its debt. In other words, the government
walked away from investors that bought Argentine government bonds.
Currency Crisis
With the economy struggling and uncertainty surrounding the
stability of the federal government, investment capital fled the country. The
result was a devaluation or depreciation of the Argentine peso as investors
sold their peso-denominated investments for foreign holdings.
It's common for emerging market economies to denominate their
debt in U.S. dollars, and during a devaluation, it can cripple a country. Any
debt that was denominated in dollars for the government, companies, and individuals
increased significantly nearly overnight since taxes and revenue were earned
in pesos.
In other words, far more pesos were needed to pay off the same
principal balance owed for the dollar-denominated loans due solely to the
peso exchange rate devaluation against the dollar.
Currency crisis of Argentina
https://en.wikipedia.org/wiki/1998%E2%80%932002_Argentine_great_depression
The 2002 crisis of the Argentine peso,
however, shows that even a currency board arrangement cannot be completely
safe from a possible collapse. When the peso was first linked to the
U.S. Dollar at parity in February 1991 under the Convertibility Law, initial
economic effects were quite positive: Argentina's chronic inflation was
curtailed dramatically and foreign investment began to pour in, leading to an
economic boom. Over time, however, the peso appreciated against the majority
of currencies as the U.S. Dollar became increasingly stronger in the second
half of the 1990s. A strong peso hurt exports from Argentina and caused a
protracted economic downturn that eventually led to the abandonment of the
peso-dollar parity in 2002. This change, in turn, caused severe economic
and political distress in the country. The unemployment rate rose above 20
percent and inflation reached a monthly rate of about 20 percent in April
2002. In contrast, Hong Kong was able to successfully defend its currency
board arrangement during the Asian financial crisis, a major stress test for
the arrangement. Although there is no clear consensus on the causes of the
Argentine crisis, there are at least
three factors that are related to the collapse of the currency board system
and ensuing economic crisis:
·
The lack of fiscal discipline
·
Labor market inflexibility
·
Contagion from the financial crises in
Russia and Brazil.
While
the currency crisis is over, the debt problem has not been completely
resolved. The government of Argentina ceased all debt payments in December
2001 in the wake of persistent recession and rising social and political
unrest. In 2004, the Argentine government made a 'final' offer amounting to a
75 percent reduction in the net present value of the debt. Foreign bondholders
rejected this offer and asked for an improved offer. In early 2005, bondholders finally agreed to the restructuring, under
which they took a cut of about 70 percent on the value of their bond
holdings.
How Argentines
Live With Inflation (youtube)
The Economic
Crisis in Argentina | Explained (youtube)
Part III: Will $
collapse?
What’s next for the U.S. dollar in 2022? Keep
an eye on the ECB
Last Updated: Dec.
18, 2021 at 11:35 a.m. ET, By William Watts Follow
Ray Dalio’s Dollar Crash
Prediction. Here’s How It Will Happen (youtube)
The Federal Reserve
has got some work to do in the year ahead, but it’s the European Central Bank
that may call the tune in the coming year for a currency market that’s seen
the U.S. dollar enjoy a consensus-crushing 2021 rally, according to some
currency watchers.
“Eurozone
inflation is now becoming a key EURUSD driver, in our view,” wrote
analysts Athanasios Vamvakidis and Abhay Gupta at BofA Securities, in a
Friday note, referring to the euro/U.S. dollar EURUSD, -0.24% currency pair.
The ICE U.S. Dollar Index DXY, +0.13%, a
measure of the currency against a basket of six major rivals, was up 7.1% in
the year to date through Friday, on track for its biggest annual gain
since 2015, according to FactSet data. At the end of last year, analysts had
widely expected the dollar to fall in 2021 as a global economic recovery from
the COVID-19 pandemic caught up with the U.S.
Instead, surprisingly strong U.S. growth and
higher U.S. interest rates relative to other developed markets kept the
dollar supported, while the euro EURUSD, -0.24%, the most
heavily weighted currency in the DXY gauge, fell sharply, down 7.7% for the
year to date.
The euro initially rallied Thursday after the
ECB announced it would end its pandemic emergency purchase program, as
scheduled, in March, but would temporarily boost the size of its longer
running Asset Purchase Program, or APP, in the second quarter, partially
offsetting the reduction while retaining flexibility. The ECB gave no end
date to the APP. The euro later slumped back toward the low end of its recent
range.
“Whether the ECB
will actually reach the ‘exit’ or not by the end of next year will depend on
inflation,” the BofA analysts wrote. “The ECB revised its inflation forecasts
substantially upward, consistent with recent inflation surprises, but they
remain below what their forward guidance needs to end QE and start hiking
within their forecast horizon.”
That leaves a
“likely scenario” in which the ECB gets “stuck” just before the exit,
continuing with small monthly asset purchases of €20 billion and negative
interest rates for the foreseeable future, unless of course the ECB gives up
on its forward guidance, they said. On the other hand, if eurozone inflation
continues to surprise
to the upside,
market participants will start focusing on ECB policy normalization in 2023.
The analysts argued
that assets perceived as risky may eventually have to correct if the Fed is
forced to defend its inflation credibility. They see risks to the dollar
skewed to the upside in the first half of 2022, looking for the euro to slip
to $1.10.
Others see scope for
dollar weakness, provided the ECB does the “heavy lifting.”
The forecast
for the US dollar in 2022: Currency analyst (youtube)
Will the dollar really crash in 2022? FX strategist gives
outlook on gold, silver, inflation
David Lin David Lin , Friday December 17, 2021
16:48
The Federal Reserve announced Wednesday a
quickening of asset tapering and signaled three rate hikes in 2022.
Chester Ntonifor, FX Strategist of BCA Research
discusses with David Lin, anchor for Kitco News, the direction of the U.S.
dollar in next year.
“It’s pretty priced in that the Fed is going
to lift interest rates in 2022 and the ECB is going to lag the Fed, so that’s
already in the price of the dollar versus the euro,” Ntonifor said.
The dollar index, or DXY, will likely fall to 90 over the next
12 months, but in the immediate
term, investors can expect continued strength, Ntonifor noted.
“I think it’s
not going to crash but a drop from current levels of 96 towards 90 over 12 to
18 month-horizon seems quite reasonable to me,” he said.
Part IV: In Class
Exercise
Class Exercise1:
Chicago bank expects the exchange rate of the
NZ$ to appreciate from $0.50 to $0.52 in 30 days.
— Chicago bank can borrow $20m on a
short term basis.
— Currency Lending
Rate Borrowing
rate
$ 6.72% 7.20%
NZ$ 6.48% 6.96%
Question: If Chicago bank anticipate NZ$ to
appreciate, how shall it trade? (refer to ppt)
Answer:
◦ NZ$
will appreciate, so you should buy NZ$ now and sell later. Borrow
$à convert to NZ$ today à lend it for 30
days à convert to $ 30 days later àpayback the $ loan.
◦ Convert
the borrowed $ to NZ$ today. So your NZ$ worth: $20m / 0.50 $/NZ$=40m NZ$.
◦ Lend
NZ$ for 6.48% * 30/360=0.54% and get
40m NZ$ *(1+0.54%)=40,216,000 NZ$ 30
days lateè at new rate $0.52/1NZ$, 40,216,000 NZ$ equals t 40,216,000
NZ$*$0.52/1NZ$ = $20,912,320
◦ Your
borrowed $20m should be paid back for
20m *(1+7.2%* 30/360)=$20.12m.
◦ So
the profit is:
$20,912,320 - $20.12m =$792,320,
a pure profit from thin air!

Class Exercise 2:
Blue Demon Bank expects that the Mexican peso
will depreciate against the dollar from its spot rate of $.15 to $.14 in 10
days. The following interbank lending and borrowing rates exist:
Lending
Rate Borrowing Rate
U.S.
dollar 8.0% 8.3%
Mexican
peso 8.5% 8.7%
Assume that Blue Demon
Bank has a borrowing capacity of either $10 million or 70 million pesos in
the interbank market, depending on which currency it wants to borrow.
a. How
could Blue Demon Bank attempt to capitalize on its expectations without using
deposited funds? Estimate the profits that could be generated from this
strategy.
b. Assume
all the preceding information with this exception: Blue Demon Bank expects
the peso to appreciate from its present spot rate of $.15 to $.17 in 30 days.
How could it attempt to capitalize on its expectations without using
deposited funds? Estimate the profits that could be generated from this
strategy.
Answer:
Part a: Blue Demon Bank can capitalize on its
expectations about pesos (MXP) as follows:
1. Borrow
MXP70 million
2. Convert
the MXP70 million to dollars:
a. MXP70,000,000 × $.15
= $10,500,000
3. Lend
the dollars through the interbank market at 8.0% annualized over a 10 day
period. The amount accumulated in 10 days is:
a. $10,500,000 × [1
+ (8% × 10/360)] = $10,500,000 × [1.002222] = $10,523,333
4. Convert
the Peso back to $ at $.14 / peso:
a. $10,523,333
/ $.14 / MXP = MXP 75,166,664
5. Repay
the peso loan. The repayment amount on the peso loan is:
a. MXP70,000,000 × [1
+ (8.7% × 10/360)] =
70,000,000 × [1.002417]=MXP70,169,167
6. The
arbitrage profit is:
a. MXP
75,166,664 - MXP70,169,167 = MXP 4,997,497
7. Convert
back to at $0.14 / MXP
a. We
get back MXP 4,997,497 * $0.14 / MXP = $699,649.6 (solution)
Part b: Blue Demon Bank can capitalize on its
expectations as follows:
1. Borrow
$10 million
2. Convert
the $10 million to pesos (MXP):
a. $10,000,000/$.15
= MXP66,666,667
3. Lend
the pesos through the interbank market at 8.5% annualized over a 30 day
period. The amount accumulated in 30 days
is:
a. MXP66,666,667 × [1
+ (8.5% × 30/360)] = 66,666,667 × [1.007083] =
MXP67,138,889
4. Repay
the dollar loan. The repayment amount on the dollar loan is:
a. $10,000,000 × [1
+ (8.3% × 30/360)] = $10,000,000 × [1.006917] =
$10,069,170
5. Convert
the pesos to dollars to repay the loan. The amount of dollars to be received
in 30 days (based on the expected spot rate of $.17) is:
a. MXP67,138,889 × $.17
= $11,413,611
HW chapter 4 - Due with
second mid term exam
Question
1. Choose between increase /
decrease.
US Inflation goes up, $ will
________increase / decrease____________in value__.
US Real interest rate goes
up, $ will ________increase / decrease___________ in value__.
US Current account goes up,
$ will ________increase / decrease________ in value__.
US Recession or crisis, $
will ________increase / decrease________ in value__.
For each scenario, please
draw a demand and supply curve to support your conclusion.
- please
refer to the PPT of this chapter for how to draw demand and supply
curver Chapter 4 PPT
Question 2: DO you think the
US$ will collapse in the near future? Why or why not?
Question 3: What is currency
carry trade? Do you have a plan to carry on a currency carry trade?
Question 4: Suppose you
observe the following exchange rates: €1 = $.7; £1 = $1.40;
and €2.20 = £1.00. Starting with $1,000,000, how can you make money?(Answer: get £ first. Your profit is
$100,000)
Question 5:
Assume you have £1000 and
bid rate is 1.60$/£ and ask rate is 1.66$/£. If you convert it to £ and then
convert it back to $, what will happen? (Answer:
$963.86 and lose $36.14. Sell low and buy high here. So sell £ at bid and buy
£ at ask )
Question 6:
Suppose you start with $100
and buy stock for £50 when the exchange rate is £1 = $2. One year later, the
stock rises to £60. You are happy with your 20 percent return on the stock,
but when you sell the stock and exchange your £60 for dollars, you find that
the pound has fallen to £1 = $1.75. What is your return to your initial
investment of $100? (Answer: 5%)
Question 7:
Baylor Bank believes the New
Zealand dollar will depreciate over the next five days from $.52 to $.5. The
following annual interest rates apply:
Currency Lending
Rate Borrowing
Rate
Dollars 5.50% 5.80%
New
Zealand dollar
(NZ$) 4.80% 5.25%
Baylor
Bank has the capacity to borrow either NZ$11 million or $5 million. If Baylor
Bank’s forecast if correct, what will its dollar profit be from speculation
over the five day period (assuming it does not use any of its existing
consumer deposits to capitalize on its expectations)? (Answer: 0.44 million NZ$ profit)
Question 8: What went wrong with Argentina’s
economy? Please refer to the two videos.
· How Argentines Live With
Inflation (youtube)
· The Economic Crisis in
Argentina | Explained (youtube)
U.S. Dollar Index (USDX)
By JAMES CHEN Updated January 11, 2022,
Reviewed by GORDON SCOTT, Fact checked by KIRSTEN ROHRS SCHMITT
The U.S. dollar index (USDX) is a measure of
the value of the U.S. dollar relative to the value of a basket of currencies
of the majority of the U.S.'s most significant trading partners. This index
is similar to other trade-weighted indexes, which also use the exchange rates
from the same major currencies.
KEY TAKEAWAYS
·
The U.S. Dollar
Index is used to measure the value of the dollar against a basket of six
world currencies—Euro, Swiss Franc, Japanese Yen, Canadian dollar, British
pound, and Swedish Krona.
·
The index was
established shortly after the Bretton Woods Agreement dissolved in 1973 with
a base of 100, and values since then are relative to this base.
·
The value of the index is a fair indication of the dollar’s value
in global markets.
The index is currently calculated by factoring
in the exchange rates of six major world currencies, which include the Euro
(EUR), Japanese yen (JPY), Canadian dollar (CAD), British pound (GBP),
Swedish krona (SEK), and Swiss franc (CHF).
The EUR is, by far, the largest component of the index, making
up 57.6% of the basket. The weights of the rest of the currencies in the
index are JPY (13.6%), GBP (11.9%), CAD (9.1%), SEK (4.2%), and CHF (3.6%).
The index started in 1973 with a base of 100,
and values since then are relative to this base. It was established shortly
after the Bretton Woods Agreement was dissolved. As part of the agreement,
participating countries settled their balances in U.S. dollars (which was
used as the reserve currency), while the USD was fully convertible to gold at
a rate of $35/ounce.
An overvaluation of the USD led to concerns
over the exchange rates and their link to the way in which gold was priced.
President Richard Nixon decided to temporarily suspend the gold standard, at
which point other countries were able to choose any exchange agreement other
than the price of gold. In 1973, many foreign governments chose to let their
currency rates float, putting an end to the agreement.
History of the U.S. Dollar Index (USDX)
The U.S. dollar index has risen and fallen
sharply throughout its history. It
reached an all-time high in 1984 at nearly 165. It's all-time low was at
nearly 70 in 2007. In Jan. 2022, the index was around 96. Over the last
six years, the U.S. dollar index has been relatively range bound between 90
and 100.2
The index is affected by macroeconomic factors, including
inflation/deflation in the dollar and foreign currencies included in the
comparable basket, as well as recessions and economic growth in those
countries.
The contents of the basket of currencies have
only been changed once since the index started when the Euro replaced many
European currencies previously in the index in 1999, such as Germany's
predecessor currency, the Deutschemark.
In the coming years, it is likely currencies
will be replaced as the index strives to represent major U.S. trading
partners. It is likely in the future
that currencies such as the Chinese yuan (CNY) and Mexican peso (MXN) will
supplant other currencies in the index due to China and Mexico being major
trading partners with the U.S.
Interpreting and Trading the U.S. Dollar Index
(USDX)
An index value of 120 suggests that the U.S. dollar has
appreciated 20% versus the basket of currencies over the time period in
question. Simply put, if the
USDX goes up, that means the U.S. dollar is gaining strength or value when
compared to the other currencies.
Similarly, if the index is currently 80, falling
20 from its initial value, that implies that it has depreciated 20%. The
appreciation and depreciation results are a factor of the time period in
question.
The U.S. dollar index allows traders to monitor the value of the
USD compared to a basket of select currencies in a single transaction. It
also allows them to hedge their bets against any risks with respect to the
dollar. It is possible to incorporate futures or options strategies on the
USDX.
These financial products currently trade on
the New York Board of Trade. Investors can use the index to hedge general
currency moves or speculate. The index is also available indirectly as part
of exchange-traded funds (ETFs), options, or mutual funds.
Currency Carry Trades 101 https://www.investopedia.com/articles/forex/07/carry_trade.asp (video)
By KATHY LIEN, Reviewed By GORDON
SCOTT , Updated Jan 14, 2021
Benefiting from the Carry Trade
Whether you invest in stocks, bonds,
commodities or currencies, it is likely that you have heard of the carry
trade. This strategy has generated positive average returns since the 1980s,
but only in the past decade has it become popular among individual investors
and traders.
For the better part of the last 10 years, the
carry trade was a one-way trade that headed north with no major retracements.
However, in 2008, carry traders learned that gravity always regains control
as the trade collapsed, erasing seven years worth of gains in three months.
Yet, the profits made between 2000-2007 have
many forex traders hoping that the carry trade will one day return. For those
of you who are still befuddled by what a carry trade is and why the hysteria
surrounding the trade has extended beyond the currency market, welcome to
Carry Trades 101. We will explore how a carry trade is structured, when it
works when it doesn't and the different ways that short- and long-term
investors can apply the strategy.
KEY TAKEAWAYS
· A currency carry trade is a strategy that
involves borrowing from a low interest rate currency and to fund
purchasing a currency that provides a rate.
· A trader using this strategy attempts
to capture the difference between the rates, which can be substantial
depending on the amount of leverage used.
· The carry trade is one of the most popular
trading strategies in the forex market.
· Still, carry trades can be risky since they are
often highly leveraged and over-crowded.
Carry Trade
The carry trade is one of the most popular
trading strategies in the currency market. Mechanically, putting on a
carry trade involves nothing more than buying a high yielding currency and
funding it with a low yielding currency, similar to the adage "buy low,
sell high."
The most popular carry trades involve buying
currency pairs like the Australian dollar/Japanese yen and New Zealand
dollar/Japanese yen because the interest rate spreads of these currency pairs
are very high. The first step in putting together a carry trade is
to find out which currency offers a high yield and which one offers a low
yield.
The interest rates for the most liquid
currencies in the world are updated regularly updated on FXStreet.
With these interest rates in mind, you can mix
and match the currencies with the highest and lowest yields. Interest rates
can be changed at any time so forex traders should stay on top of these rates
by visiting the websites of their respective central banks.
Since New Zealand and Australia have the
highest yields on our list while Japan has the lowest, it is hardly
surprising that AUD/JPY is the poster child of the carry trades. Currencies are traded in pairs so all an
investor needs to do to put on a carry trade is to buy NZD/JPY or AUD/JPY
through a forex trading platform with a forex broker.
The Japanese yen's low borrowing cost is a
unique attribute that has also been capitalized by equity and commodity
traders around the world. Over the past decade, investors in other markets
have started to put on their own versions of the carry trade by shorting
the yen and buying the U.S. or Chinese stocks, for example. This
had once fueled a huge speculative bubble in both markets and is the reason
why there has been a strong correlation between the carry trades and stocks.
The Mechanics of Earning Interest
One of the cornerstones of the carry trade
strategy is the ability to earn interest. The income is accrued every day for
long carry trades with triple rollover given on Wednesday to account for
Saturday and Sunday rolls.

Why This Strategy Is So Popular
Between January 2000 and May 2007, the Australian
dollar/Japanese yen currency pair (AUD/JPY) offered an average annual
interest of 5.14%. For most people, this return is a pittance, but in a
market where leverage is as high as 200:1, even the use of five- to 10-times
leverage can make that return extremely extravagant. Investors earn this
return even if the currency pair fails to move one penny. However, with so
many people addicted to the carry trades, the currency almost never stays
stationary. For example, between February and April of 2010, the AUD/USD
exchange rate gained nearly 10%. Between January 2001 and December 2007, the
value of the AUD/USD increased approximately 70%.
Low Volatility, Risk Friendly
Carry trades also perform well in low volatility
environments because traders are more willing to take on risk. What the carry traders are looking for is
the yield—any capital appreciation is just a bonus. Therefore, most carry
traders, especially the big hedge funds that have a lot of money at stake,
are perfectly happy if the currency does not move one penny, because they
will still earn the leveraged yield.
As long as the currency doesn't fall, carry
traders will essentially get paid while they wait. Also, traders and
investors are more comfortable with taking on risk in low volatility
environments.
If It Were Only This Easy!
An effective carry trade strategy does not
simply involve going long a currency with the highest yield and shorting a
currency with the lowest yield. While the current level of the
interest rate is important, what is even more important is the future
direction of interest rates. For example, the U.S. dollar could
appreciate against the Australian dollar if the U.S. central bank raises
interest rates at a time when the Australian central bank is done tightening.
Also, carry trades only work when the markets are complacent or optimistic.
Uncertainty, concern, and fear can cause
investors to unwind their carry trades. The 45% sell-off in currency pairs
such as the AUD/JPY and NZD/JPY in 2008 was triggered by the Subprime turned
Global Financial Crisis. Since carry trades are often leveraged investments,
the actual losses were probably much greater.
Benefiting from the Carry Trade
The carry trade is a long-term strategy that is far more suitable for investors
than traders because investors will revel in the fact that they will only
need to check price quotes a few times a week rather than a few times a day.
True, carry traders, including the leading banks on Wall Street, will hold
their positions for months (if not years) at a time. The cornerstone of the
carry trade strategy is to get paid while you wait, so waiting is actually a
good thing.
First Mid Term Exam 2/22/2022 – 33 Multiple
choice questions, lockdown browser, on blackboard, calculator and Excel are
allowed)
Review
1.
What is current account? What is BOP?
2.
Factors that could affect exchange rates
3.
What is Bretton Woods agreement?
4.
What is fixed change rate system? Floating exchange rate system?
5.
What is direct quote? What is indirect quote?
6.
What is bid price? What is ask price? How to trade based on the
bid ask rates.
7.
Currency conversion
8.
Cross exchange rate calculation given direct exchange rates
9.
Eurodollar, euroyen, euroeuro definitions
10. The oldest bank
in the world?
11. Causes of
the Naples waste management crisis
Chapter 5 Currency
Derivatives
For class discussion: Assume that you are an
importer for seafood from Japan. This special seafood is only available in
the summer. How can you hedge against the exchange rate risk?
Let’s watch the following videos to
understand how the forward and future markets work.
Forward contract introduction
(video, khan academy)
Futures introduction (video, khan
academy)
For class discussion:
1.
How can forward contract and futures contract help reduce risk?
2. What is margin?
What is initial margin? What is maintenance margin? What is a margin call?
Why is margin call important to the margin account holder? When the margin
account holder receives a margin call, what shall she do? What will happen if
she takes no actions?
3. Why does
margin account value change constantly?
4. What does “mark to market” mean?
Part 1- Forward
market vs. Future market
1. Difference
between the two?
Futures Contracts Compared
to Forwards (video)
Forward contract:
· Privately
negotiated;
· Non-transferable;
· customized
term;
· carried
credit default risk;
· fully
dependent on counterparty;
· Unregulated.
Futures Market Explained (Video)
Future contract:
· Quoted
in public market
· Actively
traded
· Standardized
contract
· Regulated
· No
counterparty risk
 (FYI)
(FYI)
F = forward rate
S = spot rate
r1 = simple interest rate of the term currency
r2 = simple interest rate of the base currency
T = tenor (calculated to the appropriate day count conversion)
2. Future market
Margin account and margin call
Benefits of Futures:
Margin (video)
What Is Margin
Call? | FXTM Learn Forex in 60 Seconds
(Video)
CME (Chicago Merchandise Exchange)
G10 FX Product Suite
|
PRODUCT |
CODE |
CONTRACT |
LAST |
CHANGE |
CHART |
OPEN |
HIGH |
LOW |
||
|
6EH2 |
MAR 2022 |
1.13205 |
-0.00195 |
1.13315 |
1.1364 |
1.1310 |
||||
|
E7H2 |
MAR 2022 |
1.13200 |
-0.00200 |
1.13340 |
1.13630 |
1.13110 |
||||
|
6JH2 |
MAR 2022 |
0.0086885 |
-0.000003 |
0.008694 |
0.008700 |
0.0086815 |
||||
|
J7H2 |
MAR 2022 |
0.0086880 |
-0.0000040 |
0.0086890 |
0.0086990 |
0.0086840 |
||||
|
6AH2 |
MAR 2022 |
0.7246 |
+0.0025 |
0.72195 |
0.7285 |
0.7219 |
||||
|
6BH2 |
MAR 2022 |
1.3551 |
-0.0039 |
1.3582 |
1.3620 |
1.3546 |
||||
|
6CH2 |
MAR 2022 |
0.7859 |
+0.0019 |
0.78295 |
0.7885 |
0.78295 |
||||
|
6SH2 |
MAR 2022 |
1.0899 |
+0.0039 |
1.0855 |
1.0912 |
1.0853 |
||||
|
6NH2 |
MAR 2022 |
0.67815 |
+0.0046 |
0.67325 |
0.68075 |
0.6731 |
||||
|
SEKH2 |
MAR 2022 |
0.10674 |
-0.00038 |
0.10727 |
0.10755 |
0.10661 |
||||
|
NOKH2 |
MAR 2022 |
0.11244 |
-0.00007 |
0.11245 |
0.11318 |
0.11244 |
EURO FX PRICES for Wed, Feb 23rd, 2022
https://www.barchart.com/futures/quotes/E6*0/all-futures
|
Contract |
Last |
Change |
Open |
High |
Low |
Previous |
Volume |
Open Int |
Time |
Links |
|
1.13159 |
-0.00082 |
1.13230 |
1.13585 |
1.13064 |
1.13241 |
149,093 |
N/A |
10:43 CT |
||
|
1.13210 |
-0.00190 |
1.13315 |
1.13640 |
1.13100 |
1.13400 |
104,626 |
678,267 |
10:42 CT |
||
|
1.13620 |
+0.00090 |
1.13425 |
1.13670 |
1.13425 |
1.13530 |
85 |
2,793 |
07:24 CT |
||
|
1.13565 |
-0.00075 |
1.13590 |
1.13855 |
1.13565 |
1.13640 |
162 |
1,330 |
09:12 CT |
||
|
1.13610 |
-0.00160 |
1.13700 |
1.14000 |
1.13470 |
1.13770 |
1,050 |
10,179 |
10:40 CT |
||
|
1.13955s |
+0.00045 |
N/A |
1.13955 |
1.13955 |
1.13910 |
N/A |
N/A |
02/22/22 |
||
|
1.14090 |
-0.00220 |
1.14200 |
1.14200 |
1.14090 |
1.14310 |
280 |
1,817 |
10:09 CT |
||
|
1.14640 |
-0.00230 |
1.15015 |
1.15015 |
1.14640 |
1.14870 |
208 |
2,197 |
10:09 CT |
||
|
1.15405s |
+0.00085 |
0.00000 |
1.15695 |
1.15045 |
1.15320 |
5 |
72 |
02/22/22 |
||
|
1.15940s |
+0.00065 |
0.00000 |
1.15940 |
1.15940 |
1.15875 |
0 |
23 |
02/22/22 |
Euro
Future Contract Specifications
https://www.barchart.com/futures/quotes/E6H19


Part 2 - Calculating
Futures Contract Profit or Loss
Short
and long position and payoff
Video https://www.youtube.com/watch?v=13WxmRt75Y8
For a long position, its payoff:
Value at
maturity (long position) = principal * ( spot exchange rate at maturity –
settlement price)
For a short position, its payoff:
Value at
maturity (short position) = -principal * ( spot exchange rate at maturity –
settlement price)
Note: In the calculator, principal is called contract size
Corrections:
“ Difference Between Spot Rate and Futures Rate
The currency spot
rate is the current quoted rate that a currency, in
exchange for another currency, can be bought or sold at. The two currencies
involved are called a "pair." If an investor or hedger conducts a
trade at the currency spot rate, the exchange of currencies takes place at
the point at which the trade took place or shortly after the trade. Since
currency forward
rates are based on the currency spot rate, currency
futures tend to change as the spot rates changes”./////
https://www.investopedia.com/terms/c/currencyfuture.asp
Exercise
1: Amber sells a
March futures contract and locks in the right to sell 500,000 Mexican pesos
at $0.10958/Ps (peso). If the spot exchange rate at maturity is $0.095/Ps,
the value of Amber’s position on settlement is?
Answer: -500000*(0.095-0.10958)
Exercise
2: Amber purchases a
March futures contract and locks in the right to sell 500,000 Mexican pesos
at $0.10958/Ps (peso). If the spot exchange rate at maturity is $0.095/Ps,
the value of Amber’s position on settlement is?
Answer: 500000*(0.095-0.10958)
Exercise
3: Amber sells a March futures contract and locks in the
right to sell 500,000 Mexican pesos at $0.10958/Ps (peso). If the spot
exchange rate at maturity is $0.11/Ps, the value of Amber’s position on
settlement is?
Answer: -500000*(0.11-0.10958)
Exercise
4: Amber purchases a
March futures contract and locks in the right to sell 500,000 Mexican pesos
at $0.10958/Ps (peso). If the spot exchange rate at maturity is $0.11/Ps, the
value of Amber’s position on settlement is? (refer to ppt)
Answer: 500000*(0.11-0.10958)
Exercise
3: You expect peso to depreciate on 4/4. So you sell peso
future contract (6/17) on 4/4 with future rate of $0.09/peso. And on 6/17,
the spot rate is $0.08/peso. Calculate the value of your position on
settlement (refer to ppt)
HW of
chapter 5 part I (Due on with second
mid-term)
1. Consider
a trader who opens a short futures position. The contract size
is £62,500; the maturity is six months, and the settlement price is $1.60 =
£1; At maturity, the price (spot rate) is $1.50 = £1. What is his payoff at
maturity?
(Answer: £6250)
2. Consider
a trader who opens a long futures position. The contract size is £62,500; the maturity
is six months, and the settlement price is $1.60 = £1; At maturity, the price
(spot rate) is $1.50 = £1. What is his payoff at maturity?
(Answer: -£6250)
3. Consider
a trader who opens a short futures position. The contract
size is £62,500, the maturity is six months, and the
settlement price is $1.40 = £1; At maturity, the price (spot rate) is $1.50 =
£1. What is his payoff at maturity?
(Answer: -£6250)
4.
Consider a
trader who opens a long futures position. The contract size is £62,500, the maturity
is six months, and the settlement price is $1.40 = £1; At
maturity, the price (spot rate) is $1.50 = £1. What is his payoff at maturity?
5. Watch this video and explain the following concepts.
Understanding
Futures Margin | Fundamentals of Futures Trading Course
·
What is margin account?
·
What is mark to market?
·
What is initial margin?
·
What is maintenance margin?
·
What is margin call?
·
How is margin call triggered?
·
What will happen after a margin
call is received?
Chicago Mercantile
Exchange (CME) (FYI)
By JAMES CHEN Updated June 20, 2021
https://www.cmegroup.com/markets/products.html#assetClass=sg-48&cleared=Options
video https://www.youtube.com/watch?v=poRK317iMZ4
What Is the Chicago Mercantile
Exchange?
The Chicago Mercantile
Exchange (CME), colloquially known as the Chicago Merc, is an organized
exchange for the trading of futures and options. The CME trades futures, and
in most cases options, in the sectors of agriculture, energy, stock indices,
foreign exchange, interest rates, metals, real estate, and even weather.
CME was originally called the Chicago Butter and Egg Board and
was used for trading agricultural products, such as wheat and corn.
In the 1970s the CME added financial futures, followed shortly
by precious metals, Treasuries, and other assets.
In 2007, the CME merged with the Chicago Board of Trade to
create CME Group, one of the world's largest financial exchange operators.
CME Group now owns several other exchanges in different cities.
Nowadays, CME is also known for trading unusual commodities like
Bitcoin futures and weather derivatives.
Understanding the Chicago
Mercantile Exchange (CME)
Founded in 1898, the Chicago Mercantile Exchange began life as
the "Chicago Butter and Egg Board" before changing its name in
1919. It was the first financial exchange to "demutualize" and
become a publicly traded, shareholder-owned corporation in 2000.
The CME launched its first futures contracts in 1961 on frozen
pork bellies. In 1969, it added financial futures and currency contracts
followed by the first interest rate, bond, and futures contracts in 1972.
Creation of CME Group
In 2007, a merger with the Chicago Board of Trade created the
CME Group, one of the largest financial exchanges in the world. In 2008, the
CME acquired NYMEX Holdings, Inc., the parent of the New York Mercantile
Exchange (NYMEX) and Commodity Exchange, Inc (COMEX). By 2010, the CME
purchased a 90% interest in the Dow Jones stock and financial indexes.
The CME grew again in 2012 with the purchase of the Kansas City
Board of Trade, the dominant player in hard red winter wheat. And in late
2017, the Chicago Mercantile Exchange began trading in Bitcoin futures.
According to the CME Group, on
average it handles 3 billion contracts worth approximately $1 quadrillion
annually. In 2021 CME Group ended open
outcry trading for most commodities, although outcry trading continues in the
Eurodollar options pit. Additionally, the CME Group operates CME Clearing, a
leading central counterparty clearing provider.
CME Futures and Risk
Management
With uncertainties always present in the world, there is a
demand that money managers and commercial entities have tools at their disposal
to hedge their risk and lock in prices that are critical for business
activities. Futures allow sellers of
the underlying commodities to know with certainty the price they will receive
for their products at the market. At the same time, it will enable consumers
or buyers of those underlying commodities to know with certainty the price
they will pay at a defined time in the future.
While these commercial entities use futures for hedging,
speculators often take the other side of the trade hoping to profit from
changes in the price of the underlying commodity. Speculators assume the risk
that the commercials hedge. A large family of futures exchanges such as the
CME Group provides a regulated, liquid, centralized forum to carry out such
business. Also, the CME Group provides settlement, clearing, and reporting
functions that allow for a smooth trading venue.
CME is one of the only regulated markets for trading in Bitcoin
futures.
CME Regulation
CME is regulated by the
Commodity Futures Trading Commission, which oversees all commodities and
derivatives contracts in the United States. The CFTC is responsible for oversight of brokers and merchants,
conducts risk surveillance of derivatives trades, and investigates market
manipulation and other abusive trade practices. It also regulates trading in
virtual assets, such as Bitcoin.
Chicago Mercantile Exchange
vs. Chicago Board of Trade
The Chicago Board of Trade (CBOT) is another Chicago-based
futures exchange, founded in 1848. The CBOT originally focused on agricultural
products, such as wheat, corn, and soybeans; it later expanded to financial
products such as gold, silver, U.S. Treasury bonds, and energy. The CME
merged with the CBOT in 2006, in a move approved by shareholders of both
organizations.
Example of Chicago Mercantile
Exchange
Most commodities can be traded anywhere, but there's one you can
only trade at the CME: weather. CME is
the only futures exchange to offer derivatives based on weather events,
allowing traders to bet on cold temperatures, sunshine, or rainfall. In
2020, the CME traded as many as 1,000 weather-related contracts per day, with
a total annual volume of over $1 billion.
Euro FX
Futures Contract Specs
(http://www.cmegroup.com/trading/fx/g10/euro-fx_contract_specifications.html)
|
Contract Unit |
125,000 euro |
||
|
Trading Hours |
Sunday - Friday 6:00 p.m. - 5:00 p.m. (5:00 p.m. - 4:00 p.m.
Chicago Time/CT) with a 60-minute break each day beginning at 5:00 p.m.
(4:00 p.m. CT) |
||
|
Minimum Price Fluctuation |
Outrights: .00005 USD per EUR increments ($6.25 USD). |
||
|
Product Code |
CME Globex: 6E |
||
|
Listed Contracts |
Contracts listed for the first 3 consecutive months and 20
months in the March quarterly cycle (Mar, Jun, Sep, Dec) |
||
|
Settlement Method |
Deliverable |
||
|
Termination Of Trading |
9:16 a.m. Central Time (CT) on the second business day immediately
preceding the third Wednesday of the contract month (usually Monday). |
||
|
Settlement Procedures |
Physical Delivery |
||
|
Position Limits |
|||
|
Exchange Rulebook |
|||
|
Block Minimum |
|||
|
Price Limit Or Circuit |
|||
|
Vendor Codes |
|||
Million
Dollar Pips The Life Of A
Day Trader
http://www.youtube.com/watch?v=unM_0Vh00K4
Foreign Exchange Market
http://www.youtube.com/watch?v=-qvrRRTBYAk
Bearish option strategies example onoptionhouse
Option Strategy graphs
Future Trading Guide
Futures
- Mechanics of the Futures Market
http://www.youtube.com/watch?v=1jA7c1_Jtvg
How a Russian invasion of
Ukraine, the ‘breadbasket
of Europe,’ could hit supply chains
PUBLISHED WED, FEB 23 202212:16 AM ESTUPDATED WED, FEB 23
20222:26 PM EST
Weizhen Tan
KEY POINTS
·
Russia is also the world’s
top wheat exporter. Together with Ukraine, both account for roughly 29% of
the global wheat export market.
·
“China is also a big recipient of Ukrainian
corn — in fact, Ukraine replaced the U.S. as
China’s top corn supplier in 2021,” said Dawn Tiura, president at Sourcing
Industry Group.
·
Russia and Ukraine are
also big suppliers of metals and other commodities, analysts said.
·
While the European Union
would be affected by the escalating crisis, Germany would be especially hit.
Oil and gas prices are set
to spike further as the Russia-Ukraine crisis escalates, but the impact on energy won’t be the
only ramification.
From wheat to barley, and copper to nickel, analysts tell CNBC
that supply chains are set to be disrupted as the crisis takes a turn for the
worse.
Ukraine is considered the “breadbasket of Europe,” and an invasion would result in the food supply chain getting
“hit hard,” said Alan Holland, CEO and founder at sourcing technology
company Keelvar.
Tensions between Russia and Ukraine reached fever pitch in the
past few days as President Vladimir Putin ordered the Kremlin’s forces into
two pro-Russian separatist regions in eastern Ukraine. It came after he said
Russia would formally recognize the independence of Donetsk and Luhansk.
U.S. President Joe Biden on Tuesday described Russia’s actions
as the beginning “an invasion” of Ukraine.
Here’s what’s at risk if a military conflict takes place or
crippling sanctions are imposed.
Food security
Ukraine produces wheat, barley and rye that much of Europe
relies on, analysts said. It’s also a big producer of corn.
“Even though harvesting season is still a few months away, a
prolonged conflict would create bread shortages [and increase consumer
prices] this fall,” said Holland.
In fact, it’s not just the European Union that will be hit — many nations in the Middle East and
Africa also rely on Ukranian wheat and corn, and disruptions to that supply
could affect food security in those regions, said Dawn Tiura, president at
Sourcing Industry Group.
“China is also a big recipient of Ukrainian corn — in fact, Ukraine replaced the U.S. as
China’s top corn supplier in 2021,” she said.
Wheat and corn prices were already soaring. Wheat futures
traded in Chicago have jumped about 12% since the start of this year, while
corn futures spiked 14.5% in the same period.
Food inflation has been rising, and could worsen if an armed
conflict erupts.
“Rising food prices would only be exacerbated with additional
price shocks, especially if core agricultural areas in Ukraine are seized by
Russian loyalists,” said Per Hong, senior partner at
consulting firm Kearney.
Russia’s recent aggression on Ukraine is part of an 8-year
war: Research center
He pointed out that Russia is also the world’s top wheat
exporter. Together with Ukraine, both account for roughly 29% of the global
wheat export market.
Further, any disruptions to the natural gas supply will in
turn affect the production of energy-intensive products such as fertilizers — and that’s bound to hit agriculture
further, said Holland. Fertilizers were already in short supply last year,
leading to soaring prices.
Russia was the largest supplier of natural gas and oil to the
European Union last year.
Metals and raw materials
Ukraine has steadily increased its exports over the years, and
is now a “huge provider” of raw materials, chemical products and even machinery like
transportation equipment, according to Tiura.
It’s also a major supplier of minerals and other commodities,
analysts said.
“Ukraine’s currency began declining
in value since Russian troops started gathering at the border. This will
increase the cost of their exports,” Tiura added.
South Korean minister discusses supply chain risks amid
Russia-Ukraine tensions
Russia also controls about
10% of global copper reserves, and is a major producer of nickel and platinum, according to Hong.
Nickel is a key raw material used in electric vehicle
batteries, and copper — widely seen as an economic
bellwether — is extensively used in electronics
manufacturing and construction of homes.
“The U.S. chip industry
heavily relies on Ukrainian-sourced neon and Russia also exports a number of
elements critical to the manufacturing of semiconductors, jet engines,
automobiles and medicine,” Hong said.
Impact on Germany
While most of the European
Union would be affected by the escalating crisis, Germany would be especially
hard-hit.
Germany derives most of its energy needs for manufacturing and
electricity from the natural gas it gets from Russia, said Atul Vashistha,
chairman and CEO of supply chain risk intelligence firm Supply Wisdom.
“If tensions continue to rise
and we see an increase in disruptions due to a potential war or sanctions, it
will hold back manufacturing production in Germany. Factories would need to curtail
production which would cascade to manufacturing in other countries,” he told CNBC in an email.
Top exports from Germany include autos and auto parts, other
transport equipment, electronics, metals and plastics.
Chapter 5 Part II
Currency Option market
NASDAQ OMX PHLX (Philadelphia Stock Exchange)
trades more than 2,600 equity options, sector index options and U.S.
dollar-settled options on major currencies. PHLX offers a combination of cutting-edge
electronic and floor-based options trading.
Nasdaq: http://www.nasdaq.com/includes/swiss-franc-specifications.stm
1. What is Call and put option?
Difference between the two?
American call option (video, khan academy)
American put option (video, khan academy)
Call payoff diagram (video, khan academy)
Put payoff diagram (video, khan academy)
For
discussion:
·
When shall you consider a call
option?
·
When shall you buy a put
option?
·
Can you draw a call payoff
diagram?
·
What about a put payoff
diagram?
2. Calculate the payoff for
both call and put?
· For call: Profit = Spot rate – strike
price – premium; if option is exercised (when spot rate > strike price)
Or, Profit
= -premium, if option is not exercised (expired when spot
rate < strike
price)
In general, profit = max((spot rate – strike price -
premium), -premium ) ---------- Excel syntax
Excel payoff diagram for
call and put options (very helpful)
(Thanks to Dr. Greene http://www2.gsu.edu/~fncjtg/Fi8000/dnldpayoff.htm)
Calculator of Call and
Put Option
Example: Jim is a speculator . He buys a British pound
call option with a strike of $1.4 and a December settlement date. Current
spot price as of that date is $1.39. He pays a premium of $0.12 per unit for
the call option. Just before the expiration date, the spot rate of the
British pound is $1.41.At that time, he exercises the call option and
sells the pounds at the spot rate to a bank. One option contract specifies
31,250 units. What is Jim’s profit or loss? Assume Linda is the seller of the
call option. What is Linda’s profit or loss?
(refer to ppt. Answer:
Spot rate is $1.39,
Jim’s total profit: -0.12*31250
Spot rate is
$1.41, Jim’s total profit: (1.41-1.4-0.12)*31250=(-0.11)*31250
Spot rate is
$1.39, Linda’s total profit: 0.12*31250
Spot rate is
$1.41, Linda’s total profit: -((1.41-1.4-0.12)*31250)=0.11*31250
*** the loss
of taking the long position of the option is just the gain of taking the
short position. It is a zero sum game.
· For put: Profit = strike price - Spot rate –
premium, if option is exercised (when spot rate < strike price)
Or, Profit =
-premium, if option is not exercised (expired when spot
rate > strike price)
In general, profit = max((strike price - spot rate - premium),
-premium ) ---------- Excel syntax
Example A speculator bought a put
option (Put premium on £ = $0.04 / unit, X=$1.4, One contract specifies
£31,250 )
He exercise the option shortly
before expiration, when the spot rate of the pound was $1.30. What is his
profit? What is the profit of the seller? (refer to ppt) When spot rate was $1.5, what are the profits of
seller and buyer?
Answer:
Spot rate is
$1.30, option buyer’s total profit: (1.4 - 1.3 – 0.04) *31250
Spot rate is
$1.50, option buyer’s total profit: -0.04*31250
Spot rate is
$1.30, option seller’s total profit: -(1.4 - 1.3 – 0.04) *31250
Spot rate is $1.50,
option seller’s total profit: 0.04*31250
*** the loss
of taking the long position of the option is just the gain of taking the
short position. It is a zero sum game.
www.jufinance.com/option_diagram


HW
Chapter 5 Part II (Due with the
second mid term exam)
4. You purchase a put option
on Swiss francs for a premium of $.05, with an exercise price of $.50. The
option will not be exercised until the expiration date, if at all. If the
spot rate on the expiration date is $.58,
how much is the payoff of this long option? And your profit? (And
also, please draw the payoff diagram to both the long and short put option
holders, optional, for extra credits. www.jufinance.com/option_diagram).
(Answer: -$0.05; 0)
5. Why is $
strengthened after Russian invaded Ukraine? Why is Euro weakened?
6. What is SWIFT? How could
banning Russia from the banking system impact the country?
7. Do you think that Russian Russia
central bank raise interest rate to 20% can stop the bank run problem? Why or
why not?
8. Set up a practice account at https://www.cmegroup.com/education/practice.html
and click on the “trading simulator” to start trading on the future market.
Choose a specific future contract, such as euro future contract expired in
March, and you can start the game. Report your account results. The following
is the summary of my account since 2/13/2019 (last year’s. This is not
required but you can give it a try)
More Euro FX Quotes https://www.barchart.com/futures/quotes/E6H22/overview
|
|
Last |
Change |
High |
Low |
Volume |
Time |
|
1.12675s |
+0.00765 |
1.12785 |
1.11700 |
236,318 |
02/25/22 |
|
|
1.12805s |
+0.00770 |
1.12910 |
1.11835 |
533 |
02/25/22 |
|
|
1.12920s |
+0.00775 |
1.13025 |
1.11945 |
264 |
02/25/22 |
|
|
1.13045s |
+0.00780 |
1.13150 |
1.12065 |
6,118 |
02/25/22 |
|
|
1.13230s |
+0.00795 |
1.13230 |
1.13230 |
N/A |
02/25/22 |
Chapter 7 International Arbitrage And
Interest Rate Parity
Here are the
countries with the highest interest rates in the world in 2020
|
RANKING |
COUNTRY |
DEPOSIT INTEREST RATE |
INFLATION RATE |
DIFFERENCE |
|
1 |
Argentina |
37.64% |
50.9% |
-13.26% |
|
2 |
Venezuela |
36% |
686% |
-650% |
|
3 |
Zimbabwe |
26% |
60.74% |
-35% |
|
4 |
Uzbekistan |
15.8% |
10% |
5.80% |
|
5 |
Madagascar |
13.75% |
6.12% |
7.63% |
|
6 |
Turkey |
12.5% |
36.08% |
-23.58% |
|
7 |
Georgia |
11.28% |
13.9% |
-2.62% |
|
8 |
Lebanon |
9.7% |
224.39% |
-214.69% |
|
9 |
Azerbaijan |
8.69% |
6.7% |
1.99% |
|
10 |
Belarus |
8.25% |
9.97% |
-1.72% |
|
Sierra Leone |
8.25% |
15.77% |
-7.52% |
|
|
Source: Trading Economics |
||||
\
Top
10 Highest Real Interest Rates in the World
The real interest rate is
the lending interest rate adjusted for inflation, as measured by an index
called the gross domestic product deflator. The GDP deflator measures changes
in prices. Here are the 10 countries with the highest real interest rates, according
to the latest data from the World Bank, released in 2020:
|
RANKING |
COUNTRY |
REAL INTEREST RATE (2020) |
|
1 |
Guyana |
48.52% |
|
2 |
Madagascar |
42.66% |
|
3 |
Timor-Leste |
35.62% |
|
4 |
Azerbaijan |
26.79% |
|
5 |
Brazil |
23.13% |
|
6 |
Qatar |
22.60% |
|
7 |
Kuwait |
21.19% |
|
8 |
Gambia |
20.46% |
|
9 |
Seychelles |
18.59% |
|
10 |
Bahamas |
18.42% |
|
Source: The World
Bank |
||
https://www.gobankingrates.com/banking/which-country-interest-rates/
For class
discussion:
·
Why not invest in the above countries for higher interest rates?
(hint: Interest rate levels determined by the supply and demand of credit: an increase in the demand for money or credit will raise
interest rates)
·
For US residents, how can you make profits from
currency carry trades?
·
How can a country’s real interest rate be as
high as over 40%? Shall you consider investing in that country?

Proceed at Your Own Risk
Before you roll the dice
overseas with dreams of double-digit interest gains, know that the international
insurance protection on your deposits is likely not as comprehensive as FDIC
deposit insurance. Although foreign central bank interest rates might be
higher, American banks protect your money either through FDIC insurance up to
a certain amount or, in the case of credit unions, National Credit Union
Administration insurance. If you
make a savings deposit at an FDIC-insured bank, your deposit is insured up to
$250,000. If you bank at a credit union that is insured by NCUA, your funds
are insured up to at least $250,000.
As with all investments and bank accounts,
especially in developing countries, it’s important to weigh the amount of
risk you’re willing to take on versus the return that you can expect. Although it would be
great to earn nearly 10.00% APY on a savings account, it’s comforting to
know that money you keep in American banks is fully protected in the event
that your financial institution crumbles.
https://www.gobankingrates.com/banking/interest-rates/which-country-interest-rates/
Venezuela Interest Rate1998-2019 Data

Venezuela Interest Rate https://tradingeconomics.com/venezuela/interest-rate
|
Actual |
Previous |
Highest |
Lowest |
Dates |
Unit |
Frequency |
|
|
21.77 |
22.50 |
83.73 |
12.79 |
1998 - 2019 |
percent |
Daily |
The Central Bank of Venezuela (Banco Central de Venezuela,
BCV) is not responsible for setting interest rates.
For class discussion:
Why did interest rate drop in Venezuela in 2019? Why does interest rate rise
in 2020? hint: Interest rate levels determined by the
supply and demand of credit: an increase in the demand for money or credit
will raise interest rates)
Part 1 of chapter
7: Currency carry trade
Currency
carry trade (investorpedia)
Carry
trade basics (Video, Khan academy)
What is a Currency Carry Trade
A
currency carry trade is a strategy in which an investor sells a certain
currency with a relatively
low
interest rate and uses the funds to purchase a different currency yielding a
higher interest rate.
A
trader using this strategy attempts to capture the difference between the
rates, which can often
be
substantial, depending on the amount of the leverage used.

Japan
Interest Rate
As
the Yen Carry Trade Returns, Consider its Role in the Great Recession
By
Bill Camarda @ https://www.americanexpress.com/us/foreign-exchange/articles/yen-carry-trade-role-in-recession/
Abstract:
As the global financial crisis of 2007-2008
unfolded, triggering Herculean efforts by central banks to stabilize
financial markets through aggressive monetary and fiscal stimuli, some
observers pointed to the yen carry
trade as a key driver of the bubble that led up to the crisis – and a contributor that helped deepen the crisis as the
trades unwound.
A decade later, the yen carry trade appears to
be undergoing a revival, as the interest rate spreads between the U.S. and Japan
are widening again. It's
worth considering the yen carry trade's role in the Great Recession, why it
happened, and any lessons that emerge from that episode of economic history.
What is the Yen Carry Trade?
Carry trades involve borrowing in currencies
with low interest rates and investing the proceeds in currencies where
interest rates are higher, thereby earning relatively easy profits. The "Law of One
Price" economic theory predicts that the profit opportunities from price
differences of this kind should quickly disappear, as arbitrage rebalances
the prices of assets across markets. But carry trade opportunities have
often lingered, offering sustained opportunities for profit, and a growing
body of academic research now helps to explain that persistence.
For nearly two decades before
the global financial crisis, the yen-dollar carry trade was often among the
most prominent carry trades. It grew because the Bank of Japan kept interest
rates extremely low from the mid-1990s onward in an attempt to reignite
Japan's stagnant economy, while the U.S. Federal Reserve generally
maintained higher interest rates. The
spread between Japanese and U.S. interest rates encouraged many foreign
exchange traders to sell yen they had borrowed at low rates and buy dollars
they could lend at higher rates.
When the Fed started to raise
interest rates in the mid-2000s, the widening spread between U.S. and
Japanese rates triggered a sudden increase in the yen-dollar carry
trade. The trade grew rapidly in
the run-up to the global financial crisis, as even individual currency
traders joined hedge funds, banks, and other financial institutions in
pursuit of higher returns.
How Did the Yen Carry Trade Affect the Global
Financial Crisis?
From 2004-2007, rapid growth
in yen carry trades made far more dollars available for investment in the
U.S. While some of this money was invested in U.S. Treasury bonds, much of it
found its way into higher-yielding assets such as collateralized debt
obligations (CDOs) and U.S. subprime residential mortgage backed securities
(RMBS) – assets whose prices collapsed in 2007-8.
As the bubble burst and the Great Recession
began, the Fed dropped interest rates precipitously, eliminating the
differences in rates between Japan and the U.S.; the basis for the yen carry
trade disappeared. Yen carry trades quickly unwound, reducing dollar
liquidity. Japanese investors, and yen-leveraged American and European
investors, sold RMBSes, CDOs and other diverse assets and debt, purchasing
dollars which they then sold for yen. This contributed to the collapse of
those assets' prices, which in turn added to an extraordinary demand for
dollars. The
Fed responded by undertaking aggressive quantitative easing – i.e., pouring
new dollars into the economy.
The yen carry trade had worked when the
yen-dollar exchange rate was relatively stable, or when the yen declined
against the dollar – as
it did by roughly 20 percent from 2004-2008. But in the wake of Lehman
Brothers' September 2008 collapse, the yen rose rapidly along with USD while
most other currencies fell by comparison. Japanese investors sold risky
dollar-denominated assets and bought yen with the proceeds, pushing the yen
up vs. the dollar. American investors who had borrowed in cheaper yen to fund
dollar-denominated investments faced rising FX costs in carrying their yen
loans. They rushed to sell dollars (and other currencies) to buy yen they
could use to repay their yen loans, pushing the yen exchange rate even higher.
These events contributed significantly to the volatility then roiling
currency markets.
What's Happened Since
A few years after the global financial crisis,
Japan's expansionary economic policies contributed to a re-emergence of the
yen carry trade, as the yen's value dropped by 26 percent and significant
differences between U.S. and Japanese interest rates reappeared. Yen
carry trades increased by 70 percent between 2010 and 2013. However, by early
2018, yen carry trade strategies had racked up four straight quarters of
losses. The outlook for the yen carry trade seemed poor: the yen was rising
against other currencies, traders expected the Bank of Japan to tighten the
reins on economic growth and raise interest rates, and traders anticipated
higher volatility in connection with growing international trade frictions.
But in August 2018, the Bank
of Japan announced that it would keep interest rates extremely low for an
indefinite period. Observers noted that the Fed had already raised interest
rates several times, and was projecting five rate hikes through the end of
2019. Meanwhile, in the second quarter of 2018, Bloomberg found
borrowing yen to purchase dollar assets earned investors an exceptionally
attractive return of 4.9 percent, taking into account fluctuations in
exchange rates, levels of interest, and the funding costs.
It isn't yet clear how long
the recent revival of the yen carry trade will be sustained. Historically,
the yen has often been viewed as a safe haven currency. If increased
volatility drives FX traders to safety, the yen's value could rise, making
the carry trade less profitable.
But if the yen carry trade
does keep growing, it could again impact exchange and interest rates. When
spreads between interest rates widen, traders inevitably seek to take
advantage of them. The experience of 2007-2008 teaches that this can lead to
market distortions and even bubbles.
Homework chapter 7 (Due with second
mid term exam)
1. What are the risks and
awards associated with currency carry trade?
2. Here are the countries
with the highest interest rates in the world in 2020:
|
RANKING |
COUNTRY |
DEPOSIT INTEREST RATE |
|
1 |
Argentina |
37.64% |
|
2 |
Venezuela |
36% |
|
3 |
Zimbabwe |
26% |
|
4 |
Uzbekistan |
15.8% |
|
5 |
Madagascar |
13.75% |
|
6 |
Turkey |
12.5% |
|
7 |
Georgia |
11.28% |
|
8 |
Lebanon |
9.7% |
|
9 |
Azerbaijan |
8.69% |
|
10 |
Belarus |
8.25% |
|
Sierra Leone |
8.25% |
|
|
Source: Trading
Economics |
||
https://www.gobankingrates.com/banking/which-country-interest-rates/
· Do you suggest currency carry trade with those
countries or Turkey? Why or why not?
1.
Watch this
video. What is suggested by the host? Do you think that his strategy will
work? Why or why not?
how
to do the carry trade. (VIDEO, BY Robert Booker)
Do you suggest of currency carry
trade to your friends? Which pair of currencies shall you choose from the
perspective of US investorss? (hint: you want the currency to be strong,
reliable, and the country’s interest rate is high)
hapter
7 Part II Interest Rate Parity
In class exercises
1. Locational arbitrage
Exercise 1: Bank1
–
bid Bank1-ask Bank2-bid
Bank2-ask
£ in
$: $1.60 $1.61 $1.62 $1.63
How can you arbitrage?
Answer: Buy pound at bank1’s ask price and sell pound at bank2’s
bid price. Profit is $0.01/pound
For instance, with $1,610, you can buy £
at bank 1 @ $1.61/£ and get back £1,000.
Then, you can sell £ at bank 2 @ $1.62/£
and get back $1,620, and make a profit of $10.
Pound is cheaper in bank 1 but more
expensive in bank 2. Therefore, you can arbitrage.
Hint: Always buy from dealer at ask
price, and sell to dealer at bid price.
Bank1
– bid Bank1-ask Bank2-bid
Bank2-ask
£ in
$: $1.6 $1.61 $1.61 $1.62
How can you arbitrage?
(Answer: Buy pound at bank1’s ask price and sell pound at
bank2’s bid price. No Profit )
For instance, with $1,610, you can buy £
at bank 1 @ $1.61/£ and get back £1,000.
Then, you can sell £ at bank 2 @ $1.61/£
and get back $1,610, and make a profit of $0.
Pound is cheaper in bank 1 but more
expensive in bank 2. However, there is a bid ask spread, or fees charged by
dealers. So no arbitrage opportunities.)
Hint: Always buy from dealer at ask
price, and sell to dealer at bid price.
Exercise 2: If you start with $10,000 and conduct one round
transaction, how many $ will you end up with ?

(Answer: ($10000
/ 0.64($/NZ$)) – the amount obtained from north bank.
($10000 / 0.64($/NZ$)) * 0.645
($/NZ$) = $10078.13)
Hint: Always buy from dealer at ask price,
and sell to dealer at bid price.
2. Triangular arbitrage
Exercise 1: £ is quoted at $1.60. Malaysian Rinnggit (MYR)
is quoted at $0.20 and the cross exchange rate is £1 = MYR 8.1. How can you
arbitrage?
Answer: Either $ è MYR è £ è $, or $ è £ è MYR è $,
one way or another, you should make money. In this case, it is the latter
one. Imagine you have $1,600 è 1,000
Approach one: Yes, $ è GBP è MYR è $ could make a profit of $20.

Approach two: No, $ è MYR è GBP è $ does not work.

Exercise 2:

How can you arbitrage with the above
information?
Answer:
Approach 1: Yes. Same as above but
sell at bid and buy at ask. Only two rounds: USDà GBPàMYR, or, USD àMYRàGBP. One way make money and the other one lose
money. We start with $1,610 è buy
GBP at ask price, so get 1,000 GBP è sell GBP
for rinngit @ 1 GBP = 8.1 MYR; so get
8,100 MYR è sell Rinngit for
$ @ bid price. 8,100 MYR = 8,100 * 0.20 = $1,620, a
profit of $10 out of $1,610 initial investment.

The other
round is: 1,610$ è 8,009.95
MYR (=1,610/0.201) è976.8GBP
(=1,610/0.201/8.2) è 1,562.9
USD (=1,610/0.201/8.2*1.6) è a loss
of 47.1 USD, so not a good deal
Approach 2: No, it does not work.

3. Covered Interest Arbitrage (CIA):
Exercise 1: Assume you have $800,000 to invest. Current
spot rate of pound is $1.60. 90 day forward rate of pound is $1.60. 90 day
interest rate in US is 2%. 90 day interest rate in UK is 4%. How
can you arbitrage?

Answer: Convert at spot rate for pound and then deposit pound in UK
bank. 90 days later, convert back to $ at forward rate. Refer to the above
graph for details)
Exercise 2: You have $100,000 to invest for one year.
How can you benefit from engaging in CIA?

Answer: Again, buy at ask and sell at bid. Convert at
spot rate for pound and then deposit pound in European bank. One year later, convert
back to $ at forward rate. ($100,000 / 1.13)*(1+6.5%) *1.12 = $105,558.
However, if keep the money in US, you can get $100,000*(1+6%) = $106,000 So
better to deposit in US and do not participate in CIA)
Interest rate parity (IRP)
· The interest rate parity implies that
the expected return on domestic assets = the exchanged rate adjusted expected
return on foreign currency assets.
IRP is based on that “Investors cannot earn
arbitrage profits” by
- Borrow an amount in a currency with a lower interest
rate.
- Convert the borrowed amount into a currency with a
higher interest rate.
- Invest the proceeds in an interest-bearing instrument
in this higher-interest-rate currency.
- Simultaneously hedge exchange risk by buying a forward
contract to convert the investment proceeds into the first (lower
interest rate) currency.
For discussion:
Assume the current spot rate of GBP is 1.5$/£. Interest rate in US is 5% and Interest rate
is UK is 10%. Shall you invest in US for 5% or shall you invest in UK for a
higher return?
***Answer***: It should make no difference at all! Please
explain.
Invest in US, return = 5%. Invest in UK,
return = 5% as well. Why?
You can borrow at 5% in US, then convert
to GBP at 1.5$/GBP, then deposit in US for 10%, convert back to $ at the
forward rate, and this forward rate would be 1.4318$/GBP, then your return
would be 5%.
$1500 è 1000 GBP è1100 GBP one year later è 1100 GBP * (1.4318$/GBP) =$1574.98, we start from
$1500, and 1574.98/1500-1 = 5% of return
Forward
rate = 1.4318 $/GBP. Why?
The
returns for either approach should both equal to 5%.
So
invest in US, by the end of the year, the account value = $1500 *(1+5%)
Invest
in UK, 1000 GBP *(1+10%) * Forward rate
Both
investments should provide the same returns to investors, since the financial
market is efficient è
no arbitrage opportunity
$1500
*(1+5%) =1000 GBP *(1+10%) * Forward rate è
Forward rate = $1500 *(1+5%) / 1000 GBP *(1+10%) = 1.4318$/GBP
Equation of IRP:
 or
or 

S$/¥:
spot rate how many $ per ¥. ¥ is the base currency and $ is quoted currency
F$/¥:
forward rate;
So, F = S
*(1+ interest rate of quoted currency) / (1+ interest rate of base currency)
Why?
Deposit in ¥
@ the ¥’s rate and then convert back to F (forward rate)
= Convert to $ at spot rate and deposit at
$’s rate
So, (1+rate¥)*F
= S* (1+rate$) è F = S*
(1+rate$) /((1+rate¥)
Or,

S¥/$:
spot rate how many ¥ per $. ¥ is the base $ quoted
F¥/$:
forward rate;
So, F = S
*(1+ interest rate of quoted currency) / (1+ interest rate of base currency)
Why?
Deposit in $
@ the $’s rate and then convert back to F (forward rate)
= Convert to ¥ at spot rate and deposit at
¥’s rate
So, (1+rate$)*F
= S* (1+rate¥) è F = S*
(1+rate¥) /((1+rate$)
Or,
The basic equation for
calculating forward rates with the U.S. dollar as the base currency is:
Forward Rate = Spot Rate * [(1 + Interest
Rate of quoted currency) / (1 + Interest Rate of based currency)]
Spot rate:
¥/$, or USD/YEN (Yen is quoted and $ is based)
Or,
Forward Rate = Spot
Rate * ( Interest Rate of quoted
currency - Interest Rate of based currency +1 )
Implications of IRP Theory
·
If IRP theory holds, then it can negate the possibility of
arbitrage. It means that even if investors invest in domestic or foreign
currency, the ROI will be the same as if the investor had originally invested
in the domestic currency.
·
When domestic interest rate is below foreign interest
rates, the foreign currency must trade at a forward discount. This is
applicable for prevention of foreign currency arbitrage.
·
If a foreign currency does not have a forward discount or
when the forward discount is not large enough to offset the interest rate
advantage, arbitrage opportunity is available for the domestic investors. So,
domestic investors can sometimes benefit from foreign investment.
·
When domestic rates exceed foreign interest rates, the
foreign currency must trade at a forward premium. This is again to offset
prevention of domestic country arbitrage.
·
When the foreign currency does not have a forward premium
or when the forward premium is not large enough to nullify the domestic
country advantage, an arbitrage opportunity will be available for the foreign
investors. So, the foreign investors can gain profit by investing in the
domestic market.
https://www.tutorialspoint.com/international_finance/interest_rate_parity_model.htm
Exercise 1: i$ is
8%; iSF is 4%; If spot rate S
=0.68 $/SF, then how much is F90 (90 day forward rate)?
Answer:
S =0.68 $/SF è CHF/USD = 0.68, so CHF is base currency
and USD is the quoted currency.
So, F = 0.68*(1+8%/4) / (1+4%/4) = 0.6867
$/CHF (or CHF/USD = 0.6867)
Exercise 2: i$ is
8%; iyen is 4%; If spot rate S = 0.0094
$/YEN, then how much is F180 (180 day forward rate)?
Answer:
S = 0.0094 $/YEN, so $ is the quoted
currency, Yen is the base currency.
F = S *(1+
interest rate of quoted currency) / (1+ interest rate of base)è F=0.0094*(1+8%/2)/(1+4%/2) = 0.0096 $/YEN
Exercise 3: i$ is 4% and i£ is
2%. S is $1.5/£ and F is $2/£. Does IRP hold? How can you arbitrage? What is
the forward rate in equilibrium?
Answer:
S = $1.5/£, so $ is the quoted currency,
£ is the base currency.
F = S *(1+
interest rate of quoted currency) / (1+ interest rate of base)è F=(1.04/1.02)*1.5 = $1.529/£, F at $2/£
is too high.
When F=$2/£, what can US investors do to make arbitrage profits?
For example, US investor
·
can borrow 1,000 $, and pay back
$1,040 a year later.
·
Convert to £ now at spot rate and get $1,000/1.5$/£ = 666.67 £
·
deposit in UK @ 2%
·
so one year later, get back
666.67 £*(1+2%)=680£
·
convert to $ at F rate
·
so get back 680 £ * 2$/£ =
$1,360
·
So the investor can make a
profit of 1,360 -1040 = $320 profit.
The forward rate is set too high. It
should be set around $1.529/£, so that the arbitrage opportunity will be
eliminated.
Exercise 4: i$ is 2%
and i£ is 4%. S is $1.5/£ and F is $1.1/£.
Does IRP hold? How can you arbitrage? What is the forward rate in equilibrium?
Answer:
S = $1.5/£, so $ is the quoted currency,
£ is the base currency.
F = S *(1+
interest rate of quoted currency) / (1+ interest rate of base)è F=(1.02/1.04)*1.5 = $1.471/£, so F at
$1.1/£ is too low.
When F=$1.1/£, what can US investors do to make arbitrage profits?
For example, US investor
·
can borrow 1,000 $, and pay back
$1,040 a year later.
·
Convert to £ now at spot rate and get $1,000/1.5$/£ = 666.67 £
·
deposit in UK @ 4%
·
so one year later, get back
666.67 £*(1+4%)=693.33£
·
convert to $ at F rate
·
so get back 680 £ * 1.1$/£ =
$762.67
·
So the investor will lose
money: $762.67 -1040 = -247.33, a loss.
The forward rate is set too low. It
should be set around $1.471/£.
SO US investors should let this CIA (covered
interest rate arbitrage) go, but UK investor could consider borrow money in
UK to generate risk free profits. So the trade by UK investors will force
forward rate to drop to its equilibrium price based on IRP.
Rule of Thumb:
· All that is required to make a covered
interest arbitrage profit is for interest rate parity not to hold.
· The key to determining whether to start
CIA is to compare the differences in interest rate to the forward premium
(=
F/S-1, or =forward rate / spot rate -1).
|
Spot exchange rate |
S($/£) |
= |
$2.0000/£ |
|
360-day forward rate |
F360($/£) |
= |
$2.0100/£ |
|
U.S. discount rate |
i$ |
= |
3.00% |
|
British discount rate |
i£ |
= |
2.5% |
1. With above information and $1,000 in hand,
any opportunities?
2. When F360($/£)
= $2.50/£?
3. When F360($/£)
= $1.90/£
Answer:
1. Either
CIA make 3% or deposit in US also 3%. F is priced correctly.
2. F is too high for US residents. So US investors can take advantage of this
high Forward rate; borrow at local rate and trade in FX market
3.
F is too low. So UK investors can borrow
at local rate and trade in FX market.
Homework chapter 7 part II (due
with final)
1. Suppose that
the one-year interest rate is 5.0 percent in the United States and 3.5
percent in Germany, and the one-year forward exchange rate is $1.3/€. What
must the spot exchange rate be? (Hint: the question is asking for the
spot rate, given forward rate. ~~ $1.2814/€ ~~)
2. Imagine that can
borrow either $1,000,000 or €800,000 for one year. The one-year interest rate
in the U.S. is i$ = 2%
and in the euro zone the one-year interest rate is i€ =
6%. The one-year forward exchange rate is $1.20 = €1.00; what must the spot
rate be to eliminate arbitrage opportunities? (1.2471$/€. It does not
matter whether you borrow $ or euro)
3. Image that the future
contracts with a value of €10,000 are available. The
information of one year interest rates, spot rate and forward rate available
are as follows.
Question: profits that you
can make with one contract at maturity?
Exchange
rate Interest
rate APR
So($/€) $1.45=€1.00 Interest
rate of $ 4%
F360($/€) $1.48=€1.00 Interest
rate of € 3%
Hint: The future contract is available, so you
can buy 10,000 euro in the future to buy the
futures contract. So at present, you can
borrow €9,708.3 (=10,000 euro /
1.03) euro and use the money 360 days later to purchase the future contract
of €10,000, since € interest rate is 3%. Let’s see you can make money or not.
Convert €9,708.3 to $ at spot rateè get back €9,708.3
*1.45 $/€= $14,077.67 è deposit at US @4% interest rate, and get back
$14,077.67 *(1+4%) = $14,640.78 è convert at F rate, and get back $14,640.78 / 1.48 $/€ =9,892.417 euro
, less than 10,000 euro è so this round of trading is not a good
idea.
However, if the F rate is $1.46/euro or even less, then you can get
back $14,640.78 / 1.46 $/€ > 10,000 euro, so you can do better by doing so
than simply depositing money in euro with 3% interest rate.
4. Image that you find
that interest rate per year is 3% in Italy. You also realize that the spot
rate is $1.2/€ and forward rate (one year maturity) is $1.18/€.
Question: Use IRP to
calculate the interest rate per year in US. (1.28%)
The followings are
useful websites
Exchange rate forecast
http://exchangerateforecast.com/
Daily FX News(has news, technical analysis and live rates):http://www.dailyfx.com/
Technical analysis _ chart example book
http://www.forex-charts-book.com/
Forex Trend lines
http://www.forextrendline.com/
Historical currency rate
http://www.xe.com/currencytables/
Historical currency chart
http://www.xe.com/currencycharts/
Forex trading demo
http://www.fxcm.com/forex-trading-demo/
Purchasing power parity (cartoon)
http://www.youtube.com/watch?v=i0icL5zlQww
Uncovered
Interest Rate Parity (FYI)
Uncovered interest rate parity (UIP) states
that the difference in interest rates between two countries equals the
expected change in exchange rates between those two countries. Theoretically,
if the interest rate differential between two countries is 3%, then the
currency of the nation with the higher interest rate would be expected to
depreciate 3% against the other currency.
In reality,
however, it is a different story. Since the introduction of floating exchange
rates in the early 1970s, currencies of countries with high interest rates
have tended to appreciate, rather than depreciate, as the UIP equation
states. This well-known conundrum, also termed the “forward
premium puzzle,” has been the subject of several
academic research papers.
The anomaly
may be partly explained by the “carry trade,” whereby speculators borrow in low-interest
currencies such as the Japanese yen, sell the borrowed amount and invest the
proceeds in higher-yielding currencies and instruments. The Japanese yen was
a favorite target for this activity until mid-2007, with an estimated $1
trillion tied up in the yen carry trade by that year.
Relentless
selling of the borrowed currency has the effect of weakening it in the
foreign exchange markets. From the beginning of 2005 to mid-2007, the
Japanese yen depreciated almost 21% against the U.S. dollar. The Bank of
Japan’s target rate over that period ranged from 0 to
0.50%; if the UIP theory had held, the yen should have appreciated against
the U.S. dollar on the basis of Japan’s lower
interest rates alone.
The Difference
Between Covered Interest Rate Parity and Uncovered Interest Rate Parity (FYI)
Covered interest parity (CIP) involves
using forward or futures contracts to cover exchange rates, which can thus be
hedged in the market. Meanwhile, uncovered interest rate parity involves
forecasting rates and not covering exposure to foreign exchange risk – that is, there are no forward rate contracts, and it
uses only the expected spot rate.
There is no theoretical difference between
covered and uncovered interest rate parity when the forward and expected spot
rates are the same.
Implications of IRP Theory
If IRP theory holds, then it can negate the possibility of
arbitrage. It means that even if investors invest in domestic or foreign
currency, the ROI will be the same as if the investor had originally invested
in the domestic currency.
When domestic interest rate is below foreign interest
rates, the foreign currency must trade at a forward discount. This is
applicable for prevention of foreign currency arbitrage.
If a foreign currency does not have a forward discount or
when the forward discount is not large enough to offset the interest rate
advantage, arbitrage opportunity is available for the domestic investors. So,
domestic investors can sometimes benefit from foreign investment.
When domestic rates exceed foreign interest rates, the
foreign currency must trade at a forward premium. This is again to offset
prevention of domestic country arbitrage.
When the foreign currency does not have a forward premium
or when the forward premium is not large enough to nullify the domestic
country advantage, an arbitrage opportunity will be available for the foreign
investors. So, the foreign investors can gain profit by investing in the
domestic market.
Chapter 7 - special
topic
PPT (Thanks, Theodore and Christian)
Gas prices may rise amid
Russia-Ukraine crisis (youtube)
Russia’s Ruble Hits Record Low.
Here is why that matters (video)


www.xe.com
Dollar
jumps to near two-year high as Russia invades Ukraine
PUBLISHED WED, FEB 23 202211:23 PM ESTUPDATED THU,
FEB 24 20223:48 PM EST, Reuters
https://wwwT.cnbc.com/2022/02/24/forex-markets-russia-ukraine-invasion-euro-dollar.html
The
U.S. dollar jumped to its highest level in nearly two years and the Russian
rouble plunged to a record low on Thursday after Russia launched an invasion
of Ukraine, as investors fled risk assets and moved toward safe-haven assets.
Russian forces invaded Ukraine in an assault by
land, sea and air, in the biggest attack on a European country since World
War Two.
The dollar index rose 0.869% and was on pace for its
biggest daily percentage gain since March 2020, when U.S, markets were in the
throes of the first wave of the COVID-19 pandemic. The greenback reached a
high of 97.740 against a basket of major currencies, its highest since June
30, 2020.
The dollar weakened slightly as U.S. President Joe
Biden announced new sanctions against Russia, including banks.
“We have a big geopolitical development that a lot
of people haven’t seen before in their lives; it’s a classic risk-off move,”
said Erik Bregar, director, FX & precious metals risk management at
Silver Gold Bull Inc in Toronto.
“There is a push and pull over which currency is the
biggest safe haven in the moment.”
The Russian rouble weakened 4.51% versus the
greenback to 84.96 per dollar after softening to a record low of 89.986 per
dollar.
Against other safe havens, the dollar rose 0.77%
against the Swiss franc while the Japanese yen weakened 0.54% versus the
greenback at 115.61 per dollar.
The greenback also gained sharply against other
European currencies such as the Swedish crown, Hungarian forint and Polish
zloty.
The Swedish crown fell 1.13% versus the U.S.
currency to 9.49 per dollar.
The dollar rose 2.85% against the zloty and rose
3.11% against the forint .
The
euro was down 0.95% to $1.1202 while Sterling was last trading at $1.3393, down 1.10% on
the day.
The
greenback has been subdued recently as tensions in Ukraine have increased and
fueled speculation the U.S. Federal Reserve may be less aggressive in
tightening policy at its
March meeting. Expectations for at least a 50-basis-point interest rate hike
have dropped to 7.5% from around 34% a day ago, according to CME’s FedWatch
Tool.
Fed
policymakers on Thursday acknowledged the central bank’s tightening plans
were now jousting with the possibility of war and its impact on oil prices.
In cryptocurrencies, bitcoin last fell 1.22% to
$37,067.89.
“In the end, if you want to talk about the safety
trade, as much as everyone likes to say bitcoin is great, push comes to
shove, people want gold,” said Ken Polcari, managing partner at Kace Capital
Advisors in Boca Raton, Florida.
Ethereum , last fell 2.21% to $2,560.77.
What
is SWIFT? How could banning Russia from the banking system impact the
country?
Marina Pitofsky, USA TODAY
https://www.usatoday.com/story/money/2022/02/24/swift-russia-banking-system-sanctions/6930931001/
What is SWIFT and why were
some Russian banks excluded from it? (video)
The White House announced Saturday that the United States and allies agreed
to block select Russian banks from SWIFT, the global financial messaging
system.
In a joint statement with leaders of the European
Commission, France, Germany, Italy, the United Kingdom, Canada, the officials
said Russia being excluded from SWIFT ensures “that these banks are disconnected from the international financial system
and harm their ability to operate globally.”
The announcement comes after President Joe Biden on
Thursday told reporters that the penalties from the latest round of sanctions
against Russia are “maybe more consequence than SWIFT.”
What does it mean for Russia to be kicked out of the
SWIFT banking system? Here’s what you need to know:
What is the SWIFT financial system?
SWIFT
stands for the Society for Worldwide Interbank Financial Telecommunication.
It is a global messaging system connecting thousands of financial institutions
around the world.
SWIFT was formed in 1973, and it is headquartered in
Belgium. It is overseen by the National Bank of Belgium, in addition to the
U.S. Federal Reserve System, the European Central Bank and others. It connects more than 11,000 financial
institutions in more than 200 countries and territories worldwide so banks
can be informed about transactions.
Alexandra Vacroux, executive director of the Davis
Center for Russian and Eurasian Studies at Harvard University, told NPR,
"It doesn't move the money, but
it moves the information about the money."
SWIFT said it recorded 42 million messages a day on
average in 2021 and 82 million messages overall this month. That includes
currency exchanges, trades and more.
How would a removal from SWIFT affect Russia?
Barring
Russia from SWIFT would damage the country’s economy right away and, in the
long term, cut Russia off from a swath of international financial
transactions. That includes international profits from oil and gas
production, which make up more than 40% of Russia’s revenue.
Iran lost access to SWIFT in 2012 as part of
sanctions over its nuclear program, though many of the country's banks were
reconnected to the system in 2016. Vacroux told NPR that when Iran was kicked
off, "they lost half of their oil export revenues and 30% of their
foreign trade."
What have other leaders said about removing Russia
from SWIFT?
Ukrainian President Volodymyr Zelenskyy urged the
U.S. and other countries to cut Russia from the system. Some nations resisted
the move out of concerns for the broader economy, but as the invasion wore on
more European Union nations got on board.
Early Saturday morning, Italian Prime Minister Mario
Draghi told Zelenskyy that Italy supported "Russia's disconnection from
SWIFT, the provision of defense assistance."
Several hours later, Germany, which had been the
last European Union nation holding out on the sanctions, offered measured
support for Russia's disconnection from SWIFT, according to a joint statement
from German Foreign Minister Annalena Baerbock and German Economics Minister
Robert Habeck.
“We are working flat out on how to limit the
collateral damage of a disconnection from #SWIFT, so that it hits the right
people,” the officials wrote in a statement. "What we need is a targeted
and functional restriction of SWIFT.”
FOREX-Euro tries to recover
after tumbling on Russian invasion of Ukraine
CONTRIBUTOR Alun John
Reuters, PUBLISHED FEB 24, 2022 8:39PM EST, CREDIT: REUTERS/JASON LEE
The euro was struggling to recover from its plunge the
previous day in early Asia trading on Friday, after Russia's invasion of Ukraine had hit the common European
currency and sent investors scrambling to the safety of the dollar, yen and
Swiss franc.
HONG KONG, Feb 25 (Reuters) - The euro was struggling to
recover from its plunge the previous day in early Asia trading on Friday,
after Russia's invasion of Ukraine had hit the common European currency and
sent investors scrambling to the safety of the dollar, yen and Swiss franc.
Russia's rouble RUB also tumbled overnight, falling to a
record low of 89.986 per dollar, before recovering a little.
The euro was last at $1.1196 having touched as low as
$1.1106 on Thursday, its lowest since May 2020, plunging from the $1.13045 at
which it had finished on Wednesday.
Sterling and the risk-friendly Australian dollar also were
hammered while the U.S. dollar in turn lost ground on the yen and Swiss
franc.
As a result, the dollar index =USD rose as high as 97.740,
its highest since June 2020. It was last at 96.990.
Russia, on Thursday, unleashed the biggest attack on a
European state since World War Two, prompting tens of thousands of people to
flee their homes, as Ukrainian forces fought on multiple fronts.
The United States responded with a wave of sanctions
impeding Russia's ability to do business in major currencies along with
sanctions against banks and state-owned enterprises.
"The first order impact is naturally in Russia and
Ukraine ... but there is an impact on Asia Pacific bond and foreign exchange
markets as well," said Riad Chowdhury APAC head of MarketAxess, a credit
trading platform.
Chowdhury pointed to a "flight-to-quality type move
both in global assets (moving to the dollar and yen) as well as in emerging
markets".
One dollar was worth 115.47 yen JPY= on Friday morning in
Asia, after the greenback had tumbled 0.48% on the Japanese currency on
Thursday. The dollar was at 0.9241 against the Swiss franc CHF= after losing
0.85% the previous day.
The pound GBP was at $1.33840 and the Australian dollar
AUD=D3 was at $0.7153 as both tried to recover from their Thursday
pummelling.
As well as the direct impact of the war in Ukraine, currency traders were trying to assess
the war's impact on monetary policy around the world.
Several policymakers at the
European Central Bank (ECB), even those sometimes seen as hawkish, said the
situation in Ukraine could cause the ECB to slow its exit from stimulus
measures.
Meanwhile investors and some U.S. officials said the war
would likely slow but not stop approaching interest rate hikes.
Russia central bank more
than doubles key interest rate to 20% to boost sinking ruble
PUBLISHED MON, FEB 28 20222:11 AM ESTUPDATED, Natasha Turak
Bank of Russia Raises Key
Rate to 20% (youtube)
KEY POINTS
·
The bank also said it would be freeing 733 billion rubles
($8.78 billion) in local bank reserves to boost liquidity.
·
Russian Central Bank Governor Elvira Nabiullina will hold a
briefing at 1 p.m. London time Monday.
·
The dramatic developments underline fears of a run on
Russia’s banks.
Russia’s central bank on Monday
more than doubled the country’s key interest rate from 9.5% to 20% as its
currency, the ruble, hit a record low against the dollar on the back of a
slew of new sanctions and penalties imposed on Russia by Europe and the U.S.
for its invasion of Ukraine.
The rate hike, the central
bank said, “is designed to offset increased risk of ruble depreciation and
inflation.”
This follows the central
bank’s order to halt foreigners’ bids to sell Russian securities in an effort
to contain the market fallout. The ruble fell as far as 119.50 per dollar,
down a whopping 30% from Friday’s close.
The bank also said it would be freeing 733 billion rubles
($8.78 billion) in local bank reserves to boost liquidity. Russian Central
Bank Governor Elvira Nabiullina will hold a briefing at 1 p.m. London time
Monday.
The dramatic developments
underline fears of a run on Russia’s banks. Already, long lines to withdraw cash have been seen at ATMs
in Russian cities. Sberbank Europe, which is owned by Russia’s state-run
Sberbank, says it has experienced “significant outflows of deposits in a very
short time.”
In a statement Monday, the Russian finance ministry and the
central bank announced plans to order
domestic exporters to sell their foreign exchange revenues starting on Feb.
28. The move will order exporters to sell 80% of all their forex revenues
received under export contracts.
Over the weekend, the U.S.,
European allies and Canada agreed to cut off key Russian banks from the
interbank messaging system, SWIFT, which connects more than 11,000 banks and
financial institutions in over 200 countries and territories. The EU also announced Sunday it was shutting its
airspace to Russian aircraft.
The volatility in Russian markets “does show that the freezing of the Russian central banks
assets, which was decided over the weekend by the EU as well as the other
western countries led by the U.S. — it shows what a significant move that
is,” David Marsh, chairman of economic policy think tank OMFIF, told CNBC’s
“Squawk Box Europe” on Monday.
“That is actually much more significant than the SWIFT
action, which was breaking a taboo by Germany when it joined in on that over
the weekend,” he said, referring to sanctions that cut several Russian banks
out of the global SWIFT payments system.
“It does mean that there is going to be this enormous
scramble for dollars in Russia — we’ve seen the queues outside the banks and
so on.”
Russia over the past several years has amassed a war chest
of some $630 billion in foreign reserves, its highest level ever, which
analysts say will help it withstand sanctions and losses in export revenue.
But if some of those assets are frozen, that changes the calculus for Russia.
“We will paralyze the assets of Russia’s central bank,” EU
Commission President Ursula von der Leyen said in a statement Sunday. “This
will freeze its transactions. And it will make it impossible for the Central
Bank to liquidate its assets.”
“The fact that the
Russians cannot deploy a good part of this $600 billion worth of foreign
currency reserves that the Russian central bank has been carefully building
up does mean that we are onto an emergency war economy,” Marsh said. “And
the idea of isolating Russia, which just a few days ago would have been
thought of as unthinkable, it now is a reality.”
The ramp-up in punitive measures against Russia — the
strongest that the EU has ever deployed against it — come as Russian forces
deployed by President Vladimir Putin carry out offensives all over Ukraine.
It follows several days of heavy shelling and missile strikes in major urban
centers including Ukraine’s two largest cities, its capital Kyiv and Kharkiv,
which together have a population of nearly 5 million people.
Ukrainian forces have so far managed to hold back the
Russian advances and remain in control of the two cities, Ukraine’s defense
ministry said on Sunday.
Russia’s
central bank doubles interest rates after rouble plunges
Country’s economy faces fallout from
international sanctions prompted by invasion of Ukraine
Mon 28 Feb 2022 04.33 EST
Russia’s
central bank has more than doubled interest rates to 20%, and banned
foreigners from selling local securities, in a bid to protect its currency
and economy in the face of international sanctions over the invasion of
Ukraine.
The rate
rise, from 9.5%, is aimed to balance the precipitous fall in value of the
rouble and surging inflation as the country braces for its financial
markets to take battering this week.
Currency trading was due to start later on
Monday morning, but other markets were delayed from opening until at least
3pm.
The rouble
fell 30% to a record low against the dollar before the intervention, and was down 25% after
the move by the central bank.
“External conditions for
the Russian economy have drastically changed,” the central bank said in
a statement, adding that the rate hike “will ensure a rise in
deposit rates to levels needed to compensate for the increased depreciation
and inflation risk”.
The central bank has ordered companies to sell
80% of their foreign currency revenues.
Elvira Nabiullina, the governor of Russia’s
central bank, was due to speak on Monday afternoon detailing further
measures.
The central bank said the measures would “depend on the evaluation
of risks from external and internal factors and financial markets’ reaction
to them”.
Other steps announced over the weekend
include an assurance from the central bank that it would resume buying gold
on the domestic market.
Neil Shearing, the group chief economist at
Capital Economics, said: “The central bank of Russia has this morning
raised interest rates to 20% but other measures (eg limits on deposit
withdrawals) are possible later today. All
of this will accelerate Russia’s economic downturn – a fall in
GDP of 5% now looks likely. Subsidiaries of some Russian banks overseas
are likely to come under intense pressure (and may fail), but we judge that
these are probably too small to create systemic risks.”
Over the weekend, Vladimir Putin put his
nuclear forces on high alert, while on Monday the commander of the Ukrainian
forces said Russian troops had been stopped from taking over the capital,
Kyiv.
The truth, they say, is the first casualty of
war, more so at a time when misinformation spreads so rapidly. But with correspondents
on the ground on both sides of the Ukraine-Russia border, in Kyiv, Moscow,
Brussels and other European capitals, the Guardian is well placed to provide
the honest, factual reporting that readers will need to understand this
perilous moment for Europe and the former Soviet Union.
Chapter 8 Purchasing Power Parity,
International Fisher Effect
Part I: PPP
1) Purchasing power parity (PPP)
Purchasing power parity (cartoon) https://www.youtube.com/watch?v=i0icL5zlQww
|
|
|
· A theory which states that exchange rates between currencies
are in equilibrium when their purchasing power is the same in each of the
two countries. · This means that the exchange rate between two countries
should equal the ratio of the two countries' price level of a fixed basket
of goods and services. · When a country's domestic price level is increasing
(i.e., a country experiences inflation), that country's exchange rate must
depreciated in order to return to PPP. |
|
· The basis for PPP is the "law of one
price": In the
absence of transportation and other transaction costs, competitive markets
will equalize the price of an identical good in two countries when the
prices are expressed in the same currency. · There are some caveats with this law of one price (for
class discussion) · (1) transportation costs, barriers to trade,
and other transaction costs, can be significant. · (2) there must be competitive markets for the
goods and services in both countries. · (3) tradable goods; immobile goods such as
houses, and many services that are local, are of course not traded between
countries. What else? Your opinion? |
|
|
2) The Law of one price THEORY:
All else
being equal (no transaction costs), a product’s price should be the same in
all markets
So price in $
sold in US = price in $ sold in Japan after conversion to $ from ¥
P$ = P ¥ * Spot Rate $/¥
Where the price of the product in US dollars (P$),
multiplied by the spot exchange rate (S, dollar per yen), equals the
price of the product in Japanese yen (P¥)
Or, S = P$/ P ¥
|
|
|
· No. · Exchange rate movements in the short term are
news-driven. · Announcements about interest rate changes, changes in
perception of the growth path of economies and the like are all factors
that drive exchange rates in the short run. · PPP, by comparison, describes the long
run behaviour of exchange rates. · The economic forces behind PPP will eventually equalize
the purchasing power of currencies. This can take many years, however. A
time horizon of 4-10 years would be typical. · What else? Your opinion? |
4) How to calculate PPP? ---- Use big mac index
· PPP states that the spot exchange rate is
determined by the relative prices of similar basket of goods.
· The simplest way to calculate purchasing power
parity between two countries is to compare the price of a
"standard" good that is in fact identical across countries.
· Every year The Economist magazine
publishes a light-hearted version of PPP: its "Hamburger Index" that
compares the price of a McDonald's hamburger around the world. More
sophisticated versions of PPP look at a large number of goods and services.
· One of the key problems is that people in
different countries consumer very different sets of goods and services,
making it difficult to compare the purchasing power between countries.
· For class discussion: can we use bitcoin as another goods to calculate PPP?
Using Hamburgers to Compare Wealth
- Big mac index explained video


Question: Can you use Big Mac Index as evidence to determine whether or
not a currency is under-valued? Or over-valued? Market
Edge: Peso 'undervalued' vs dollar based on 'Big Mac Index,' says The
Economist (video)
|
|
|
The
currencies listed below are compared to the US Dollar. A green bar
indicated that the local currency is overvalued by the percentage figure
shown on the axis; the currency is thus expected to depreciate against the
US Dollar in the long run. A red bar indicates undervaluation of the local
currency; the currency is thus expected to appreciate against the US Dollar
in the long run (based on old data) |

The currencies listed below are compared to the Euro.

6) Where can I get more information?
|
|
|
||||||||||||||||||||||||||||||||||||||||||||||||||||||||||||||||||||||||||||||||||||||||||||||||||||||||||||||||||||||||||||||||||||||||||||||||||||||||||||||||||||||||||||||||||||||||||||||||||||||||||||||||||||||||||||||||||||||||||||||||||||||||||||||||||||||||||||||||||||||||||||||||||||||||||||||||||||||||||||||||||||||||||||||||||||||||||||||||||||||||||||||||||||||||||||||||||||||||||||||||||||||||||||||||||||||||||||||||||||||||||||||||||||||||||||||||||||||||||||||||||||||||||||||||||||||
|
• OECD National Accounts: The OECD
publishes PPPs for all OECD countries. You can
retrieve a table with the OECD's 1950-2015 PPP rates. This is a
comma-seprated file that can be easily imported into a spreadsheet
program.
https://stats.oecd.org/Index.aspx?DataSetCode=PPPGDP from https://www.oecd.org/fr/sdd/purchasingpowerparities-frequentlyaskedquestionsfaqs.htm 1.
What are PPPs? PPPs
are the rates of currency conversion that equalize the purchasing power of
different currencies by eliminating the differences in price levels between
countries. In their simplest form, PPPs are simply price relatives that
show the ratio of the prices in national currencies of the same good or
service in different countries. PPPs are also calculated for product groups
and for each of the various levels of aggregation up to and including GDP. 2.
How PPPs are calculated? The
calculation is undertaken in three
stages. ·
The first stage is at the product level,
where price relatives are calculated for individual goods and services. A
simple example would be a litre of Coca-Cola. If it costs 2.3 euros in
France and 2.00$ in the United States then the PPP for Coca-Cola between
France and the USA is 2.3/2.00, or 1.15. This means that for every dollar
spent on a litre of Coca-Cola in the USA, 1.15 euros would have to be spent
in France to obtain the same quantity and quality - or, in other words, the
same volume - of Coca-Cola. ·
The second stage is at the product group
level, where the price relatives calculated for the products in the group
are averaged to obtain unweighted PPPs for the group. Coca-cola is for
example included in the product group “Softdrinks and Concentrates”. ·
And the third stage is at the aggregation
levels, where the PPPs for the product groups covered by the aggregation
level are weighted and averaged to obtain weighted PPPs for the aggregation
level up to GDP (in our example, aggregated levels are Non-alcoholic
beverages, Food…). The weights used to aggregate the PPPs in the third
stage are the expenditures on the product groups as established in the
national accounts. You will find detailed information on the calculation in
the “EUROSTAT-OECD Methodological manual on purchasing power parities
(PPPs)”, Chapter 12. 3.
What are the major uses of PPPs? The major use of PPPs is as a
first step in making inter-country comparisons in real terms of gross
domestic product (GDP) and its component expenditures. GDP is the aggregate used most frequently to represent
the economic size of countries and, on a per capita basis, the economic
well-being of their residents. Calculating PPPs is the first step in the
process of converting the level of GDP and its major aggregates, expressed
in national currencies, into a common currency to enable these comparisons
to be made. There are also other uses and recommendations that can be find
in details in the EUROSTAT-OECD Methodological manual on purchasing power
parities (PPPs)” Chapter 1, box 1.5 Uses
of Purchasing Power Parities (PPPs) 4.
What are the products included in
the basket of goods and services used for the calculation of PPPs and how
many are they? The
basket of goods and services priced for the PPP exercise is a sample of all
goods and services covered by GDP. The final product list covers
around 3,000 consumer goods and services, 30 occupations in government, 200
types of equipment goods and about 15 construction projects. The large number of products is to enable countries to
identify goods and services which are representative of their domestic
expenditures. |
|
||||||||||||||||||||||||||||||||||||||||||||||||||||||||||||||||||||||||||||||||||||||||||||||||||||||||||||||||||||||||||||||||||||||||||||||||||||||||||||||||||||||||||||||||||||||||||||||||||||||||||||||||||||||||||||||||||||||||||||||||||||||||||||||||||||||||||||||||||||||||||||||||||||||||||||||||||||||||||||||||||||||||||||||||||||||||||||||||||||||||||||||||||||||||||||||||||||||||||||||||||||||||||||||||||||||||||||||||||||||||||||||||||||||||||||||||||||||||||||||||||||||||||||||||||||||

Relative purchasing power parity: Calculate changes in
exchange rate based on inflation in two countries
· the relative change in prices between
countries over a period of time determines the change in exchange rates
· if the spot rate between 2 countries
starts in equilibrium, any change in the differential rate of inflation
between them tends to be offset over the long run by an equal but opposite
change in the spot rate
Math equation: ef= Ih- If or ((1+ Ih)/(1+If)
-1= ef; ef: change in
exchange rate
(1+ 9%) /(1+5%) -1 = ef = 4% , and 1£=1.6$, so the new rate
of £ =1.6*(1+4%) = 1.66 £/$.
Example 2: 1£=1.6$. US inflation rate is 5%. UK inflation is 9%. What
will happen? Calculate the new exchange rate using the PPP equation.
ef = Ih – If, Ih=
5%, If =9%, so ef =
5%-9% = -4%, so the old rate is that 1£=1.6$. The new rate should be 4%
lower. So new rate is that 1£=1.6*(1-4%) = 1.536$
Example 3: 1£=1.2€. Inflation rate in Germany is
4%. UK inflation is 9%. What will happen? Calculate the new exchange rate
using the PPP equation.
Home currency is euro and foreign
currency is pound. ef = Ih – If, Ih=
4%, If =9%, so ef =
4%-9% = -5%, so the old rate is that 1£=1.2€. The new
rate should be 5% lower. So new rate is that 1£=1.2*(1-5%) = 1.14€
HOW TO CALCUALTE PPP
Step 1
Determine which two
currencies you would like to compare for purchasing power parity. The formula
for purchasing power parity requires two prices in different currencies to
calculate the price ratio:
S (purchase power parity
ratio) = Price 1/Price 2
In this case, P1 refers to
one price in a specific currency, and P2 refers to another price in a
different currency.
For instance, suppose you
want to calculate the purchasing price parity between the United States and
Mexico. Your comparison prices will be in U.S. dollars and Mexican pesos.
Step 2
Determine which product is
commonly available in both the United States and Mexico. For simplicity,
we'll compare the price of Coca Cola in both countries. Although comparing one
common product is one strategy, economic analysts may also select a group of
common products to calculate a more broad measure of purchasing power parity.
This group of products is commonly called a basket of goods and may include
food staples such as bread, milk and other related items. Although the basket
approach may be broader, the single item method helps illustrate the
calculation in simpler terms.
Step 3
Research the prices of Coca
Cola in Mexico and the United States. The purchasing power parity formula
requires you to know the price of the item you are comparing. Assume for this
example that a 12-ounce can of Coca Cola costs $1.50 in U.S. dollars and $9
Mexican pesos. Divide the $9 pesos by $1.50. The result is the price ratio
for purchasing power parity. To illustrate the calculation refer to the
following:
S = P1/P2
S = 9/1.50
S = 6
Step 4
Compare the result of the
purchasing power parity to the currency exchange rate between the United
States and Mexico. Assume that the exchange rate between the Mexican peso and
U.S. dollar is 5.7 pesos for every dollar. Recall that for purchasing power
parity to exist, the exchange rate and the purchasing power parity ratio must
be equal. The purchasing power parity ratio of 6 and a $5.7 peso per dollar
exchange rate between the currencies in Mexico and the United States
indicates that the purchasing power of the peso and the dollar are similar
but not exact. This means that Mexican and U.S. consumers have similar
purchasing power with their respective currencies.
However, if the exchange
rate between the dollar and the peso suddenly changed to $17 pesos per dollar
and the purchasing power parity ratio remained at 6, the purchasing power
parity calculation shows a loss of purchasing power for Mexican consumers relative
to the U.S. consumers. ?
----- FROM WWW.SAMPLING.COM
February 11, 2022
The Big Mac Index in 2022
Entertaining
https://fxssi.com/big-mac-index
Who hasn't tried or at least heard of a famous Big Mac at
McDonald's fast-food restaurants? However, few people know that it gave rise
to the so-called Big Mac Index, which compares the value of currencies of
different countries.
What is the Big Mac Index?
The Big Mac Index is the
price of the burger in various countries that are converted to one currency
(such as the US dollar) and used to measure purchasing power parity.
It all started in 1986 when The Economist magazine decided to
estimate the currencies' value by country based on the prices of Big Mac at
McDonald's fast-food restaurants.
Thus, The Economist introduced a simple indicator of the
fundamental value of currencies globally.
What does the Big Mac Index show, and why exactly was it taken
as an indicator?
It's pretty simple. Big Mac is the most well-known product in
McDonald's' fast-food chain. Besides, the same ingredients are used for Big
Mac in any country: meat, bread, cheese, lettuce, onions, etc. Therefore, The
Economist experts use Big Mac alone instead of determining the cost of a
consumer basket (more complex method) for each country.
Big Mac Index Table as of Q1 2022
The most relevant Big Mac Index so far (as of January 2022) is
presented in the table below.

Let's analyze these data a bit.
The Russian ruble exchange rate expressed in the Big Mac Index
in January 2022 is 23.24 ruble per dollar.
Considering that the current market rate of the Russian
currency is about 77.42 ruble, rather than 23.24 per US dollar, the ruble is
undervalued by approximately 70%.
Thus, the Russian ruble is the world’s most undervalued (cheapest) currency according to the Big
Mac Index.
In 2019, the Russian ruble was the most undervalued (by 64.5%)
currency worldwide.
Big Mac costs $1.86 in Turkish. While the price of the burger
in the United States is $5.81, the Turkish currency exchange rate is 4.30
lira per dollar in terms of the Big Mac Index.
However, the lira is cheaper in Forex – about 13.42 lira per US dollar (as of January 2022).
Therefore, we can conclude that the market undervalues the Turkish currency
by almost 68%.
In the list of the world’s most undervalued currencies, the Russian ruble and the
Lebanese pound are accompanied by the Malaysian ringgit (undervalued by
58.92%), Indonesian rupian (undervalued by 59.31%), and the Romanian leu
(undervalued by 58.65%). Notably, the currencies of India, Pakistan, the
Philippines, and other low-income countries are not in the top five most
undervalued currencies in 2022.
As for the most highly
valued currencies, the statistics by countries show that the world’s most overvalued (expensive) currency is
the francs in Switzerland.
Considering that Big Mac costs 6.98 francs in Switzerland, the
USD/CHF rate expressed in the Big Mac Index terms should be 1.12 francs per
dollar. However, the value of this pair is currently quoted around 0.93 in
Forex, which makes the Swiss currency overvalued by the market by 20.16%.
Norwegian krone overvalued by the market by 10.03%.
According to the Big Mac Index authors, Euro is also
undervalued by the market. The average Big Mac price in the Eurozone is
$4.95, meaning the currency is undervalued by 14.72%.
Notably, according to the
Big Mac Index, all major currency pairs, except the Swiss franc and Norwegian
krone, are undervalued against the US dollar.
Can We Use This Knowledge in
Trading?
We can hardly do it in the
short and medium terms, but the Big Mac Index can serve as a helpful
assistant while long-term trading.
For example, it can be used
as a filter when opening positions in the Forex market. After all, if the
Japanese yen is significantly oversold against the US dollar, traders should
refrain from opening long positions on USD/JPY.
We can draw similar
conclusions for other Forex currency pairs.
The key thing to remember is that the Big Mac Index is an
accurate indicator of the fundamental value of currencies, and traders can benefit
from its use in trading.
Big Mac's price is up 40%,
and it isn’t a good sign
This famous American burger price is outpacing cost of living,
and it’s not a good sign.
Updated Thu, Feb 17 2022
https://www.cnbc.com/select/big-mac-index-what-you-need-to-know/
There are few things that are as synonymous with American
culture as the iconic Big Mac burger from McDonald’s. Invented in 1957 by an early McDonald’s franchisee, the Big Mac remains a very
popular fast-food item.
And because of its global popularity, The Economist invented
the “Big Mac index” in 1986 as a unique way to track the price of the famous
sandwich against other currencies. The index incorporates the concept of
purchasing-power parity, which is the way to track the strength of an
individual currency, and what ‘purchasing power’ it has.
So why does this matter to you? Well the price of a Big Mac
has risen a staggering 40% over the last 10 years. And because the price of a
Big Mac embodies multiple economic factors including the cost of labor,
transportation, food and overall inflation — it leads some to believe the sandwich is one way to
understand current inflation rates and purchasing power of the U.S. dollar.
Select analyzed the Big Mac index, what it means for consumers
and how you can fight back against the rising costs of everyday items.
The Big Mac index, and what it means for you
The index has been studied by many, including the St. Louis
Federal Reserve. It describes the ‘burgernomics’ as “a convenient market basket of goods through which the
purchasing power of different currencies can be compared.” The sandwich itself contains several
goods and services between the two buns, such as: food prices (obviously),
labor, power, transportation and more. And because the sandwich exists in so
many places around the world, some look at the burger as a way to gauge
purchasing power of different currencies.
While the Big Mac is a tasty sandwich, the index is not a
foolproof economic indicator of purchasing-power parity. Diana
Furchtgott-Roth, adjunct professor of Economics at George Washington
University told Select it’s “junk food economics” for several reasons,
because “in a lot of the world Big Macs are not the
cheapest food and not aimed at lowest-income residents.” And in some countries, Big Macs are not
available at all due to cultural reasons.
Without diving deep into economic theory, the Big Mac index is
noteworthy as it demonstrates the staggering inflation we’re experiencing. And in some cases, the sandwich is rising in price faster than
several economic measurements. The burger now costs an average of $6.05 in
the U.S., a 40% increase over the last 10 years. Here’s how other items and economic factors
have fared during the last decade:
The Consumer Price Index has gone up 22%
The cost of living index is up 37%
A barrel of oil is down -21%
Raw coffee is up 12%
The U.S. raw food price index is up a modest 7%
And this trend of consumer goods skyrocketing in price is not
only a Big Mac trend. Other goods and services have mirrored the same trend
over the last decade, including:
Rent prices are up 40%
Home prices have soared 107%.
Used car prices are up 39%
So what does all of this data mean to you? Well it’s no surprise, life has become
increasingly expensive. From Dec. 2020 to Dec. 2021, inflation was at a
staggering 7%. And in the last year, the Big Mac sandwich is up an identical
7%. For context, a ‘healthy’ rate of inflation is generally 2-3%
year-over-year.
Unfortunately, there’s nothing we can do to
control inflation. So if you’re craving a Big Mac, fries
and soda, you’ll now be paying between $8-10, depending
on where you live. However, there are steps everyone can take to control how
inflation impacts your wallet.
Simple ways you can battle inflation of goods
Thomas Racca, manager on the Personal Finance Team at Navy
Federal Credit Union told Select a few ways on how everyone can easily fight
against inflation on daily purchases, and how to stay on track to accomplish
larger financial goals.
Evaluate your budget. If you haven’t adjusted your budget recently, you may have noticed common
expenses like fuel and groceries going up. Even if it’s only by a few dollars, adjusting your budget can help you
keep track where each dollar is going.
Try a new budgeting technique. There are ample ways to track
your spending with a budget. It could be as simple as writing everything
down, using an automated budgeting app, or even adjusting how you budget can
help you save during inflation.
Reroute some money for a period of time. This suggestion is a
bit more risky as it can throw off your monthly budget and should be done in
moderation. Racca told Select, “if you created an emergency
savings fund before the pandemic, consider using some of that money towards
your expenses.” So for the time being, you may consider
taking some money out of your emergency fund or not making the same monthly
contributions. It may be better to invest this money instead, in index funds
for example, where you may get a better return over the long run. But with
rising inflation, you may be pressed to unfortunately spend more on the same
purchases you’d normally make.
Consider changing your grocery list. If you regularly shop at
a higher-end grocery store, it may be helpful to transition to a more
budget-conscious store, or even consider buying in bulk. Additionally, take a
look at what you buy normally and analyze what has risen in price the most,
and consider cutting back on those items. Notably, beef and dairy products
have soared by over 13%, according to the Bureau of Labor Statistics.
Bottom line
The Big Mac is just one sign among many that life is getting
expensive, fast. And whether you’re buying the iconic
sandwich, grocery shopping or even looking for a new home, you’ve likely had some sticker shock. However,
there may be light at the end of the tunnel as the Federal Reserve is
planning on raising interest rates to quell inflation rates that haven’t been seen in over 40 years.
Part II:
International Fisher Effect
7) International Fisher Effect
Fisher Effect: Nominal
interest rate (R) = real interest rate (r) + inflation (I)
By assuming real interest
rates in two countries are the same, we conclude that inflation moves along
with the nominal interest rate which is observable and reported.
The international
Fisher effect (sometimes
referred to as Fisher's open hypothesis) is a hypothesis in international finance that suggests differences
in nominal
interest rates reflect expected changes in the
spot exchange rate between countries. The
hypothesis specifically states that a spot exchange rate is expected to
change equally in the opposite direction of the interest rate differential;
thus, the currency of the country with
the higher nominal interest rate is expected to depreciate against the
currency of the country with the lower nominal interest rate, as higher
nominal interest rates reflect an expectation of inflation.
Example
Suppose the current spot exchange
rate between the United States and the United Kingdom is 1.4339 GBP/USD.
Also suppose the current interest rates are 5 percent in the U.S. and 7 percent
in the U.K. What is the expected spot exchange rate 12 months from now
according to the international Fisher effect?
Solution: The effect estimates future exchange
rates based on the relationship between nominal interest rates. Multiplying the
current spot exchange rate by the nominal annual U.S. interest rate and
dividing by the nominal annual U.K. interest rate yields the estimate of the
spot exchange rate 12 months from now.
$1.4339*(1+5%)/(1+7%)
= $1.4071
The expected percentage change in the exchange rate is a
depreciation of 1.87% for the GBP (it now only costs $1.4071 to purchase 1
GBP rather than $1.4339), which is consistent with the expectation that the
value of the currency in the country with a higher interest rate will depreciate.
https://en.wikipedia.org/wiki/International_Fisher_effect
Calculator for
IFE and relative PPP
Example 4: If the interest rate of US is 10% and that of UK is 5%, which country’s
currency will appreciate, by how much? Imagine 1£=1.6$.
Home currency is $ and foreign currency is €. ef = Rh – Rf, Rh= 10%, Rf =5%,
so ef = 10%-5% =
5%, so the old rate is that 1£=1.6$. The new rate should be 5% higher. So new
rate is that 1£=1.6*(1+5%) = 1.68$
Example
5: If the interest rate of US is 5% and
that of UK is 10%, which country’s
currency will appreciate, by how much? Imagine 1£=1.6$.
Home currency is $ and foreign currency is £. ef = Rh – Rf, Rh=
5%, Rf =10%, so ef = 5%-10% = -5%, so the old
rate is that 1£=1.6$. The new rate should be 5% lower. So new rate
is that 1£=1.6*(1-5%)
Homework chapter 8 (due with Final)
1. If
a Big Mac costs $2 in the United States and 300 yen in Japan, what is the
estimated exchange rate of yen/ $ as hypothesized by the Big Mac index? (Answer:
150 yen /$)
2. Interest
rates are currently 2% in the US and 3% in Germany. The current
spot rate between the € and $ is $1.5/€. What is the expected spot rate in
one year if the international Fisher effect holds? (Answer:1.4854$/€)
3. You
find that inflation in Japan just reduced to 1.3%, while in US, the inflation
rate just increased to 3%. You also observed that the spot rate for yen was
$0.0075 before the adjustment by economists. With new inflation released, the
demand and supply for currencies will drive the exchange rate to a new
equilibrium price.
Question: Use
PPP to estimate the new exchange rate for yen. (Answer:0.0076$/yen)
4. You
observed the nominal interest rate (annual) just increased to 6% in China,
while the nominal annual interest rate is 3% in US. The spot rate for Chinese
Yuan is $6.8 before the adjustment.
Question: Use
IFE to estimate the new spot rate for Chinese Yuan after the interest rate
changes. (Answer:6.6075$/RMB. Note: Dollar is more valuable. In this example, RMB becomes
the more valuable currency. Sorry for the mistake)
5) What is Big Mac
Index?
6) According to OECD, What are
the products included in the basket of goods and services used for the
calculation of PPPs and how many are they?
https://www.oecd.org/fr/sdd/purchasingpowerparities-frequentlyaskedquestionsfaqs.htm
Second Mid-term exam (3.31)
Second Midterm Exam Study Guide
(10 calculation questions, posted on
blackboard under second midterm exam folder)
1.
Similar to the following question:
Chicago bank expects the exchange rate of the
NZ$ to appreciate from $0.50 to $0.52 in 30 days.
— Chicago bank can borrow $20m on a
short term basis.
— Currency Lending
Rate Borrowing
rate
$ 6.72% 7.20%
NZ$ 6.48% 6.96%
Question: If Chicago bank anticipate NZ$ to
appreciate, how shall it trade?
Solution:
·
NZ$ will appreciate, so you should buy NZ$ now and sell later.
Borrow $à convert to NZ$ today à lend it for 30
days à convert to $ 30 days later àpayback the $ loan.
·
Convert the borrowed $ to NZ$ today. So your NZ$ worth: $20m /
0.50 $/NZ$=40m NZ$.
·
Lend NZ$ for 6.48% * 30/360=0.54% and get 40m NZ$
*(1+0.54%)=40,216,000 NZ$ 30 days lateè at new rate $0.52/1NZ$,
40,216,000 NZ$ equals t 40,216,000 NZ$*$0.52/1NZ$ = $20,912,320
·
Your borrowed $20m should be paid back for 20m *(1+7.2%*
30/360)=$20.12m.
2.
Futures contract (similar to the following question):
Amber sells a March futures contract and
locks in the right to sell 500,000 Mexican pesos at $0.10958/Ps (peso). If
the spot exchange rate at maturity is $0.095/Ps, the value of Amber’s
position on settlement is? And the value of the buyer of the futures
contract?
Solution:
Answer: -500000*(0.095-0.10958)
3. Call option (similar to the following question):
Jim is a speculator . He buys a British pound call option with a strike of $1.4 and a December settlement date. Current spot price as of that date is $1.39. He pays a premium of $0.12 per unit for the call option. Just before the expiration date, the spot rate of the British pound is $1.41.At that time, he exercises the call option and sells the pounds at the spot rate to a bank. One option contract specifies 31,250 units. What is Jim’s profit or loss? Assume Linda is the seller of the call option. What is Linda’s profit or loss?
Solution:
Spot rate is
$1.39, Jim’s total profit: -0.12*31250
Spot rate is
$1.41, Jim’s total profit: (1.41-1.4-0.12)*31250=(-0.11)*31250
Spot rate is
$1.39, Linda’s total profit: 0.12*31250
Spot rate is
$1.41, Linda’s total profit: -((1.41-1.4-0.12)*31250)=0.11*31250
A speculator bought a put option (Put premium
on £ = $0.04 / unit, X=$1.4, One contract specifies £31,250 )
He exercise the option shortly before expiration, when the spot rate of the pound was $1.30. What is his profit? What is the profit of the seller? (refer to ppt) When spot rate was $1.5, what are the profits of seller and buyer?
Solution:
Spot rate is
$1.30, option buyer’s total profit: (1.4 - 1.3 – 0.04) *31250
Spot rate is
$1.50, option buyer’s total profit: -0.04*31250
Spot rate is $1.30,
option seller’s total profit: -(1.4 - 1.3 – 0.04) *31250
Spot rate is
$1.50, option seller’s total profit: 0.04*31250
Calculator: https://www.jufinance.com/option1/
5. Locational arbitrage (similar to the following question):
Exercise 1: Bank1 –
bid Bank1-ask Bank2-bid Bank2-ask
£ in
$: $1.60 $1.61 $1.62 $1.63
How to arbitrage? Arbitrage profits?
Answer: Buy pound at bank1’s ask price and sell pound at bank2’s
bid price. Profit is $0.01/pound
For instance, with $1,610, you can buy £
at bank 1 @ $1.61/£ and get back £1,000.
Then, you can sell £ at bank 2 @ $1.62/£
and get back $1,620, and make a profit of $10.
Pound is cheaper in bank 1 but more
expensive in bank 2. Therefore, you can arbitrage.
Hint: Always buy from dealer at ask
price, and sell to dealer at bid price.
6. Triangular arbitrage (similar to the following question):
£ is
quoted at $1.60. Malaysian Rinnggit (MYR) is quoted at $0.20 and
the cross exchange rate is £1 = MYR 8.1. How can you arbitrage?
Solution:

7. Triangular arbitrage (similar to the following question):
How can you arbitrage with the above information?
Solution:

8. Interest rate parity (similar to the following question):
i$ is 8%; iSF
is 4%; If spot rate S =0.68
$/SF, then how much is F90 (90 day forward rate)?
Answer:
S =0.68 $/SF è CHF/USD = 0.68, so CHF is base currency
and USD is the quoted currency.
So, F = 0.68*(1+8%/4) / (1+4%/4) = 0.6867
$/CHF (or CHF/USD = 0.6867)
Calculator:
www.jufinance.com/ife
9. PPP (similar to the following question):
If the inflation of US is 10% and that of UK
is 5%, which country’s currency will
appreciate, by how much? Imagine 1£=1.6$.
Answer:
Home currency is $ and foreign currency is €. ef = Ih – If, Ih= 10%, If =5%,
so ef = 10%-5% = 5%,
so the old rate is that 1£=1.6$. The new rate should be 5% higher. So new
rate is that 1£=1.6*(1+5%) = 1.68$
Calculator:
www.jufinance.com/ife
10. IFE (similar to the following question):
If the interest rate of US is 10% and that of UK is 5%, which country’s currency will appreciate, by how much? Imagine 1£=1.6$.
Answer:
Home currency is $ and foreign currency is €. ef = Rh – Rf, Rh= 10%, Rf =5%,
so ef = 10%-5% =
5%, so the old rate is that 1£=1.6$. The new rate should be 5% higher. So new
rate is that 1£=1.6*(1+5%) = 1.68$
that 1£=1.6*(1+5%) = 1.68$
Calculator:
www.jufinance.com/ife
Chapter 11: Managing
Transaction Exposure
What Is Transaction Exposure?
Transaction
exposure is the level of uncertainty businesses involved in international
trade face. Specifically, it is the risk that currency
exchange rates will fluctuate after a firm has already undertaken a
financial obligation. A high level of vulnerability to shifting exchange
rates can lead to major capital losses for these international businesses.
One way that firms can limit their exposure to changes in the exchange rate
is to implement a hedging strategy. Through hedging
using forward rates, they may lock
in a favorable rate of currency exchange and avoid exposure to risk.
Risks
of Transaction Exposure
The danger of transaction
exposure is typically one-sided. Only the business that completes a
transaction in a foreign currency may feel the vulnerability. The entity that
is receiving or paying a bill using its home currency is not subjected to the
same risk. Usually, the buyer agrees to buy the product using foreign money.
If this is the case, the hazard comes it that foreign currency should
appreciate, costing the buyer to spend more than they had budgeted for the
goods.
Key
Takeaways
- The
level of risk companies involved in international trade face.
- A
high level of exposure to fluctuating exchange rates can lead to major
losses for firms.
- The
risk of transaction exposure is typically one-sided.
Real
World Example of Transaction Exposure
Suppose that a United States-based
company is looking to purchase a product from a company in Germany. The
American company agrees to negotiate the deal and pay for the goods using the
German company's currency, the euro. Assume that when the U.S. firm
begins the process of negotiation, the value of the euro/dollar exchange is a
1-to-1.5 ratio. This rate of exchange equates to one euro being equivalent to
1.50 U.S. dollars (USD).
Once the agreement is
complete, the sale might not take place immediately. Meanwhile, the exchange
rate may change before the sale is final. This risk of change is transaction
exposure. While it is possible that the values of the dollar and the euro may
not change, it is also possible that the rates could become more or less
favorable for the U.S. company, depending on factors affecting the currency
marketplace. More or less favorable rates could result in changes to
the exchange rate ratio, such as a more favorable 1-to-1.25 rate or
a less favorable 1-to-2 rate.
Regardless of the change in
the value of the dollar relative to the euro, the Belgian company experiences
no transaction exposure because the deal took place in its local
currency. The Belgian company is not affected if it costs the U.S. company
more dollars to complete the transaction because the price was set
as an amount in euros as dictated by the sales agreement.
(https://www.investopedia.com/terms/t/transactionexposure.asp)
Types of foreign exchange exposure
Transaction Exposure – measures changes in the value of
outstanding financial obligations incurred prior to a change in exchange
rates but not to be settled until after the exchange rate changes
Operating (Economic)Exposure – also called economic exposure, measures the
change in the present value of the firm resulting from any change in expected
future operating cash flows caused by an unexpected change in exchange rates
Translation Exposure – also called accounting exposure,
is the potential for accounting derived changes in owner’s equity to occur
because of the need to “translate” financial statements of foreign
subsidiaries into a single reporting currency for consolidated financial
statements
Tax Exposure – the tax consequence of foreign exchange exposure varies by
country, however as a general rule only realized foreign
losses are deductible for purposes of calculating income taxes
\
What
is transaction exposure

Example of transaction exposure
— Purchasing or selling on credit
goods or services when prices are stated in foreign currencies
— Borrowing or lending funds when
repayment is to be made in a foreign currency
— Being a party to an unperformed
forward contract and
— Otherwise acquiring assets or
incurring liabilities denominated in foreign currencies
How to reduce the transaction exposure risk?
1. 1. Forward (Future) Market Hedge
2. 2.
Money Market Hedge
3. 3.
Options Market Hedge: call and put
· To hedge a
foreign currency payable buy calls on the currency.
· To hedge a
foreign currency receivable buy puts on the currency.
Exercise
1: Hedging currency
payable
A
U.S.–based importer of Italian bicycles
· In
one year owes €100,000 to an Italian supplier.
· The
spot exchange rate is $1.18 = €1.00
· The
one year forward rate is $1.20 = €1.00
· The
one-year interest rate in Italy is i€ =
5%
· The
one-year interest rate in US is i$ = 8%
— Call option exercise
price is $1.2/ € with premium of $0.03.
How to
hedge the currency payable risk
a. With
forward contract?
b. With
money market?
c. With
call option? Can we use put option?
Answer: Need €100,000
one year from now to pay the payable and plan to hedge the risk of overpaying
for the payable one year from now.
1) With
forward contract:
Buy the
one year forward contract @$1.20 = €1.00. So need
100,000€*1.2$/€ = $120,000
one year from now. So the company needs to come up with $120k for this
payable obligation.
2) With
money market:
Need €100,000 one year from now, and the rate is 5% in Italy, so
can deposit €100,000/(1+5%) = €95238.10
now.
For
this purpose, need to convert from € to
$: €95238.10*$1.18 /€=$112380.98.
Imagine
the company does not have that much of cash and it borrows @8%. So one year
from now, the total $ required to pay back to the banks is: $112380.98 *(1+8%)
= $121371.43. So the company needs to come up
with $121371.43for this payable obligation.
Summary: Borrow
$112380.98 @8% and convert to €95238.10 at present;
One year later, the company can get the €100,000 and
needs to pay back to the bank a total of $121371.43.
3) With
call option:
Imagine
the rate one year later is $1.25/€. So should
exercise the call option and the cost one year later should be
€100,000
*(1.2+0.03) $/€ = $123000, lower than the actual cost
without the call option. So $123k is the most that the company needs to
prepare for this payable obligation. USING CALL OPTION, THE ACTAUL PAYMENT
COULD BE A LOT LESS, DEPENDING ON THE ACTAUL EXCHANGE RATE ONE YEAT LATER.
Exercise
2: Hedging currency receivable
(refer to the PPT of chapter 11 for answers)
· A
U.S.–based exporter of US bicycles to Swiss
distributors
· In
6 months receive SF200,000 from an Swiss distributor
· The
spot exchange rate is $0.71 = SF1.00
· The
6 month forward rate is $0.71 = SF1.00
· The
one-year interest rate in Swiss is iSF = 5%
· The
one-year interest rate in US is i$ = 8%
· Put
option exercise price is $0.72/ SF with premium of $0.02.
How to
hedge the currency payable risk
a. With
forward contract?
b. With
money market?
c. With
call option? Can we use put option?
Answer: Will
receive SF200000 six month from now as receivable and plan to
hedge the risk of losing value in the receivable six month from now.
1) With
forward contract:
Sell
the one year forward contract @$0.71 = €1.00. So get
200,000SF * 0.71$/SF = $142,000 six month from now. So the company could
receive $142k with forward contract.
2) With
money market:
Get
SF200000 six month from now, and the rate is 5% in Swiss (or 2.5% for six
months), so can borrow SF 200,000/(1+2.5%) = SF195121.95 now.
And can
convert @ spot rate to SF195121.95 * 0.71$/SF = $138536.59. This is
the money you have now.
So six
month from now, the total you have in the bank is: $138536.59*(1+4%) =
$144078.05. And you can use the SF200000 receivable to pay back the
loan. So the company could receive $144078.05 with money
market.
Summary: Borrow SF195121.95
@5% at present; six month later, the company can get
the SF200,000 receivable and payback the loan. Meanwhile, convert
the borrowed SF to $ and deposit in US banks @ 8%.
3) With
put option: With SF200000 received six month later, need
to converting it back to $. So can buy put option which allows to sell SF for
$ at the exercise price $0.72/ SF.
Imagine
the rate one year later is $0.66/ SF. So should exercise the put option
and the total amount of $ six month later should be SF
200,000 *(0.72-0.02) $/ SF = $140000. So $140k is the LEAST that the
company CAN OBTAIN. USING PUT OPTION, THE ACTAUL INCOME COULD BE A
LOT MORE, DEPENDING ON THE ACTAUL EXCHANGE RATE ONE YEAT LATER.
Homework of Chapter 11
(due with final)
1. Suppose that your company will be billed
£10 million payable in one year. The money market interest rates
and foreign exchange rates are given as follows. How to hedge the risk for
parable using forward contract. How to hedge the risk using money market? How
to hedge risk using call option?
|
Call option exercise price The U.S. one-year interest
rate: |
$1.46/ €
with premium of $0.03 6.10% per annum |
|
The U.K. one-year interest rate: |
9.00% per annum |
|
The spot exchange rate: |
$1.50/£ |
|
The one-year forward exchange rate |
$1.46/£ |
(Answer: With forward contract: $14.6
million; Money market: $14.6million; Call option: $14.9million)
2. Suppose that your company will be
billed £10 million receivable in one year. The money market
interest rates and foreign exchange rates are given as follows. How to hedge
the risk for parable using forward contract. How to hedge the risk using
money market? How to hedge risk using put option?
|
put option exercise price The U.S. one-year interest
rate: |
$1.46/ €
with premium of $0.03 6.10% per annum |
|
The U.K. one-year interest rate: |
9.00% per annum |
|
The spot exchange rate: |
$1.50/£ |
|
The one-year forward exchange rate |
$1.46/£ |
(Answer: With forward contract: $14.6 million; Money market: $14.6million; Put option: $14.3million)
Putin's plan to prop up the ruble is working.
For now
By
Charles Riley, CNN Business
Updated
7:53 AM ET, Thu March 31, 2022
https://www.cnn.com/2022/03/31/investing/russia-ruble-putin/index.html
London
(CNN Business) The barrage of sanctions imposed by the West following
Russia's invasion of Ukraine decimated the ruble. But one month after the
tanks rolled, the currency has made a full recovery and is now trading at
levels seen prior to the war. How is that possible?
Russia's central bank has taken dramatic
steps in recent weeks to intervene in the market, implementing policies to
prevent investors and companies from selling the currency and other measures
that force them to buy it.
What has Moscow done to boost the ruble?
·
The central bank has more than doubled
interest rates to 20%. That encourages Russian savers to keep their money in
local currency.
·
Exporters have been ordered to swap
80% of their foreign currency revenues for rubles rather than holding onto US
dollars or euros.
·
Russian brokers have been banned from
selling securities held by foreigners.
·
Residents are not allowed to make bank
transfers outside Russia.
·
Russia has threatened to demand
payment for natural gas in rubles, not euros or dollars.
These measures have allowed Moscow to
artificially manufacture demand for the ruble. The problem facing policymakers is that with Russia's economy in
tatters, nobody actually wants to buy the currency of their own accord. When
the restrictions are lifted, demand for the ruble will drop, and its value
will slide — perhaps dramatically.
The
same is true for Russia's stock market. The benchmark MOEX index trended
higher when trading resumed a week ago after a long stoppage forced by the
war, but analysts say that's due to restrictions in place on investors,
including a ban on short selling. Only 33 stocks were allowed to trade when
the market reopened. When trading was extended to all stocks this week, the
index fell again.
With
that in mind, the rebound of the ruble
and stock market moves shouldn't be taken as a signal that Russia's economy is
on the mend. The country is facing its deepest recession since the 1990s, and
the economy will shrink by a fifth this year, according to a recent
forecast from S&P Global Market Intelligence.
Analysis:
For falling euro, ECB intervention probably a move too far
By
Saikat Chatterjee and Dhara Ranasinghe
https://www.reuters.com/business/falling-euro-ecb-intervention-probably-move-too-far-2022-03-09/
LONDON,
March 9 (Reuters) - The euro's fall of as much as 4% against the dollar and
Swiss franc in two weeks is raising the question of what - if anything - the
European Central Bank will do about it.
Euro
weakness, in normal times, would be welcomed by an export-reliant bloc that
has long struggled to meet a 2% inflation target. But in days of 5%-plus inflation, record energy import bills and a
looming Russia-linked growth hit, it is something the policymakers cannot
ignore.
What
the ECB says is in focus after the Swiss National Bank on Monday pledged to
curb franc strength - while the SNB frequently steps in to buy euros and
dollars, it has not intervened verbally since 2016.
"The
ECB should intervene in EUR/USD," is the title of a note by Deutsche
Bank's head of global currency strategy George Saravelos, who said euro depreciation was already inflicting
economic damage via the import price channel.
Commodity markets have seen eye-watering
price surges this year, with Brent crude
touching 14-year highs around $140 a barrel or, in euros, a record-high of
around 128 euros per barrel.
European
gas prices, up 150% this year, are projected by some to rise by another third
to 300 euros a megawatt hour.
Annual euro area inflation was a record 5.8% in
February, with energy inflation running at 31%. Citi estimates Brent's latest surge will add 0.3 percentage points
to the harmonised index of consumer prices (HICP) in March-April while gas
prices will add 0.4 percentage points in the coming year.
Saravelos
does not see FX intervention as the most likely outcome, although he does not
rule out a coordinated move involving G7 central banks if "things get
disorderly".
Instead he suggested lifting interest rates
to 0% from the current -0.5% and a further bond-buying boost as the most
effective solution.
Currency
market ructions are worrying many central banks, with several, from Poland to
South Korea, intervening to support exchange rates.
But the
ECB, which has said repeatedly it does not target the exchange rate, has not
intervened in the $6.6 trillion a day forex market since 2011, when it joined
a concerted G7 effort to weaken the yen following the Fukushima disaster and
earthquake.
Its
last solo intervention happened in 2000 when it conducted seven bouts of
euro-buying amounting to 10 billion euros to prop up the single currency soon
after its launch.
One
reason for reluctance may be the view that exchange rate pass-through (ERPT)
to inflation may have declined: a paper published by the ECB in September
estimates the ERPT linked to import prices from outside the bloc at around
0.3%, compared to 0.8% in 1999.
So
while a 1% euro depreciation raises import prices on average by 0.3% over a
year, headline HICP increases around 0.04%, the paper added.
"The
current environment has to worsen significantly and the currency has to fall
more rapidly for them to intervene," said Aaron Hurd, senior portfolio
manager, currency, at State Street Global Advisors.
He
reckons the euro would have to fall to parity versus the dollar - a further
8% drop - for the ECB to step in.
Moreover,
to move the currency significantly, an intervention would have to be
sizeable. Daily euro-dollar turnover averaged almost $770 billion in October
2021 in London, a Bank of England survey found.
ING
Bank analysts also do not consider the euro "screamingly
undervalued", attributing its fall to diverging rate-hike expectations
with the Fed, and hefty outflows from equity markets.
So for
now, the ECB may merely talk about
"monitoring the exchange rate," which would "introduce the
notion that the ECB may consider measures to support the currency should it
fall further" it said.
A
further energy price shock could see the currency fall towards the 2020 lows
around $1.0640, the bank added.
Chapter 18 Long Term Debt Financing - Interest rate swap
ppt
Intro:
• All
firms—domestic or multinational, small or large,
leveraged, or unleveraged—are sensitive to interest rate movements in
one way or another.
• The
single largest interest rate risk of the nonfinancial firm (our focus in this
discussion) is debt service
– The
multicurrency dimension of interest rate risk for the MNE is a complicating
concern.
• The
second most prevalent source of interest rate risk for the MNE lies in its
portfolio holdings of interest-sensitive securities
Interest
rate swap 1 | Finance & Capital Markets | Khan Academy
Interest
rate swap 2 | Finance & Capital Markets | Khan Academy
Example: Consider a firm
facing three debt strategies
– Strategy #1: Borrow $1
million for 3 years at a fixed rate
– Strategy #2: Borrow $1
million for 3 years at a floating rate, LIBOR + 2% to be reset annually
(LIBOR: London Interbank Offered Rate,)
– Strategy #3: Borrow $1
million for 1 year at a fixed rate, then renew the credit annually
– Although the lowest cost of
funds is always a major criterion, it is not the only one
• Strategy #1 assures itself
of funding at a known rate for the three years
– Sacrifices the ability to
enjoy a fall in future interest rates for the security of a fixed rate of
interest should future interest rates rise
• Strategy #2 offers what #1
didn’t, flexibility (and, therefore, repricing risk)
– It too assures funding for
the three years but offersrepricing risk
when LIBOR changes
– Eliminates credit risk as
its spread remains fixed
• Strategy #3 offers more
flexibility but more risk;
– In the second year the firm
faces repricing and credit
risk, thus the funds are not guaranteed for the three years and neither is
the price
– Also, firm is borrowing on
the “short-end” of the yield curve which is typically upward sloping—hence,
the firm likely borrows at a lower rate than in Strategy #1
Volatility, however, is far greater on the short-end
than on the long-end of the yield curve.
What is
interest rate swap?
Swaps are contractual agreements to exchange or swap a
series of cash flows
– Whereas a forward rate
agreement or currency forward leads to the exchange of cash flows on just one
future date, swaps lead to cash flow exchanges on several future dates
• If the agreement is to swap
interest payments—say, fixed for a floating—it is termed an interest
rate swap
– Most commonly,
interest rate swaps are associated with a debt service, such
as the floating-rate loan described earlier
– An agreement between two
parties to exchange fixed-rate for floating-rate financial obligations is
often termed a plain vanilla swap
– This type of swap forms
the largest single financial derivative market in the world.

Why
Interest-rate Swaps Exist
• If company A (B) wants
a floating- (fixed-) rate loan, why doesn’t it just do it from the start? An
explanation commonly put forward is comparative advantage!
• Example: Suppose that two
companies, A and B, both wish to borrow $10MM for 5 years and have been
offered the following rates:
Fixed Floating
Company
A 10% 6
month LIBOR+0.3%
Company
B 11.2% 6month
LIBOR+1.0%
Note:
·
Company A anticipates the
interest rates to fall in the future and prefers a floating rate loan. However, company A can get a better deal in
a fixed rate loan.
·
On the contrary, company B anticipates
the interest rates to rise and therefore prefers a fixed rate loan. Company B’s
comparative advantage is in getting a floating rate loan.
·
So both companies could be
better off with a interest rate swap contract.
– The difference between the two
fixed rates (1.2%) is greater than the difference between the two floating
rates (0.7%)
• Company B has a comparative
advantage in floating-rate markets
• Company A has a comparative
advantage in fixed-rate markets
• In fact, the combined
savings for both firms is 1.2% - 0.70% = 0.50%

Solution:
A: Receive fixed rate 10.5% from B, pay LIBOR + 0.55% to B, and
pay 10% to bank
è
Final outcome: A could pay the
debt at 10% interest rate to the bank with the10.5% interest received from Bè leaving A
with 0.5% under A’s control.
è
Since A needs to pay B at
LIBOR + 0.55% and A has kept 0.5% previously
è
A’s net result = LIBOR + 0.55%
- 0.5% = LIBOR + 0.05% = LIBOR + 0.05%
è
A anticipates the rates to go
down and prefers to pay at a flexible rate.
è
Eventually, A gets LIBOR +
0.05%, better than the rate A could obtain from the bank directly which is
LIBOR + 0.3%, so A would benefit from this interest rate swap deal.
B: Receive
LIBOR + 0.55% from A, pay 10.5% to A,
and pay LIBOR + 1% to bank
è
Final outcome: B could pay the
debt at LIBOR + 1% interest rate to
the bank with the LIBOR + 0.55%
interest received from Aè leaving B with -0.45%.
è
Since B needs to pay A at
10.5% and B still have -0.45% debt previously
è
B’s net result = 10.5% + 0.45%
= 10.95%
è
B anticipates the rates to go
up and prefers to pay at a fixed rate.
è
Eventually, B gets 10.95%,
better than the rate B could obtain from the bank directly which is 11.2%, so
B would benefit from this interest rate swap deal.
Plain vanilla swap: An agreement between two
parties to exchange fixed-rate for floating-rate financial obligations

How Do Currency Swaps Work?
By CORY MITCHELL Updated September 22, 2021, Reviewed by GORDON
SCOTT
https://www.investopedia.com/ask/answers/042315/how-do-currency-swaps-work.asp
What Is a
Currency Swap?
A currency swap
is a transaction in which two parties exchange an equivalent amount of money
with each other but in different currencies. The parties are essentially loaning
each other money and will repay the amounts at a specified date and exchange
rate. The purpose could be to hedge exposure to exchange-rate risk, to
speculate on the direction of a currency, or to reduce the cost of borrowing
in a foreign currency.
The parties involved in currency swaps are usually financial
institutions, trading on their own or on behalf of a non-financial
corporation. Currency swaps and FX
forwards now account for a majority of the daily transactions in global
currency markets, according to the Bank for International Settlements.
KEY TAKEAWAYS
·
Two parties exchange
equivalent amounts of two different currencies and trade back at a later
specified date.
·
Currency swaps are often
offsetting loans, and the two sides often pay each other interest on amounts
exchanged.
·
Financial institutions conduct
most of the FX swaps, often on behalf of a non-financial corporation.
·
Swaps can be used to hedge
against exchange-rate risk, speculate on currency moves, and borrow foreign
exchange at lower interest rates.
How a Currency
Swap Works
In a currency swap, or FX swap, the counter-parties exchange
given amounts in the two currencies. For example, one party might receive 100
million British pounds (GBP), while the other receives $125 million. This implies
a GBP/USD exchange rate of 1.25. At the end of the agreement, they will swap
again at either the original exchange rate or another pre-agreed rate,
closing out the deal.
FX Swaps and
Exchange Rates
Swaps can last for years, depending on the individual agreement,
so the spot market's exchange rate between the two currencies in question can
change dramatically during the life of the trade. This is one of the reasons
institutions use currency swaps. They
know exactly how much money they will receive and have to pay back in the
future. If they need to borrow money in a particular currency, and they
expect that currency to strengthen significantly in the coming years, a swap
will help limit their cost in repaying that borrowed currency.
FX Swaps and
Cross Currency Swaps
A currency swap is often referred to as a cross-currency swap,
and for all practical purposes, the two are basically the same. But there can
be slight differences. Technically, a cross-currency swap is the same as an
FX swap, except the two parties also exchange interest payments on the loans
during the life of the swap, as well as the principal amounts at the
beginning and end. FX swaps can also involve interest payments, but not all
do.
There are a number of ways interest can be paid. Both parties
can pay a fixed or floating rate, or one party may pay a floating rate while
the other pays a fixed.
In addition to
hedging exchange-rate risk, this type of swap often helps borrowers obtain
lower interest rates than they could get if they needed to borrow directly in
a foreign market.
Real-World
Example
Consider a company that is holding U.S. dollars and needs
British pounds to fund a new operation in Britain. Meanwhile, a British company
needs U.S. dollars for an investment in the U.S. The two seek each other out
through their banks and come to an agreement where they both get the cash
they want without having to go to a foreign bank to get a loan, which would
likely involve higher interest rates and increase their debt loads. Currency swaps don't need to appear on a
company's balance sheet, while a loan would.
What Are the
Pros and Cons of a Currency Swap?
Peter Hann, Last Modified Date: March 06, 2022
A currency swap
occurs when two parties agree to exchange the principal and interest of a
loan in one currency for the principal and interest of a loan in another
currency. The intention of the swap is to hedge against currency fluctuations
by reducing the exposure to the other currency and increasing the certainty
of future cash flows. An enterprise might also achieve a lower rate of
interest by looking for a low-interest loan in another currency and engaging
in a currency swap. The costs involved
in arranging the transaction might be a disadvantage, and as with other
similar transactions, there also is a risk that the other party to the swap
might default.
A structure often used in a currency swap is including only the
principal of the loan in the arrangement. The parties agree to swap the
principal of their loans at a specified time in the future at a specified
rate. Alternatively, the exchange of
the principal of the loans might be combined with an interest rate swap,
whereby the parties would also swap the streams of interest on the loans.
In some cases,
the currency swap would relate only to the interest on the loans and not the
principal. The two interest streams would be
swapped over the life of the agreement. These interest streams are in
different currencies, so the payments generally would be made by each party
in full, rather than being netted off into one payment as might occur if only
one currency is involved.
The advantage of
currency swaps is that they bring together two parties who each have an
advantage in a particular market. The arrangement enables each party to
exploit a comparative advantage. For example, a domestic company might be able to borrow on more
favorable terms than a foreign company in a particular country. It therefore
would make sense for the foreign company entering that market to look for a
currency swap.
Costs that might
arise for an enterprise looking for a foreign currency swap include the expense
of finding a willing counterparty. This might be done through the services of an intermediary or
by direct negotiation with the other party. The process might be expensive in
terms of fees charged by an intermediary or the cost of management time in negotiation.
There also will be legal fees for
drawing up the currency swap agreement.
The expenses of
setting up a currency swap might make it unattractive as a hedging mechanism
against currency movements in the short term. In the longer term, where there
is increased risk, the swap might be cost effective in comparison with other
types of derivative. A disadvantage is that, in any such arrangement, there
is a risk that the other party to the contract might default on the
arrangement.
Homework of
chapter 18 (due with final)
1.
How did
Goldman Sacks help Greece to cover its debt using currency swap? (Hint: Goldman Sachs helped the Greek government to mask the
true extent of its deficit with the help of a derivatives deal (Goldman
Sachs arranged a secret loan of 2.8 billion euros for Greece, disguised as an off-the-books “cross-currency swap”.—a
complicated transaction in which Greece's foreign-currency debt was converted
into a domestic-currency obligation using a fictitious market exchange rate.) that legally
circumvented the EU Maastricht deficit rules. At some point the so-called cross currency
swaps will mature, and swell the country's already bloated deficit https://www.thenation.com/article/archive/goldmans-greek-gambit/)
2.
What are the
pros and cons associated with establishing a currency swap?
3.
Explain what
is an interest rate swap using an example.
4. Company AAA will borrow $1,000,000 for ten years at a floating rate. Company BBB will borrow for ten years at a fixed rate for $1,000,000. Refer to the following for details.
|
|
Fixed-Rate Borrowing Cost |
Floating-Rate Borrowing Cost |
|
|
|
Company AAA |
10% |
LIBOR |
|
|
|
Company BBB |
12% |
LIBOR + 1.5% |
|
|
|
Note: ·
Company AAA anticipates
the interest rates to fall in the future and prefers a floating rate loan. However, company AAA can get a better deal
in a fixed rate loan. ·
On the contrary, company BBB
anticipates the interest rates to rise and therefore prefers a fixed rate
loan. Company BBB’s comparative advantage is in getting a floating rate
loan. ·
So both companies could be
better off with a interest rate swap contract. Assume that a swap bank help the
two parties. 1 According to the swap contract, Firm BBB will pay the swap
bank on $1,000,000 at a fixed rate of 10.30% 2 The swap bank will pay firm
BBB on $1,000,000 at the floating
rate of (LIBOR - 0.15%). 3 Firm AAA needs to pay the swap bank
on $1,000,000 at the floating rate of (LIBOR - 0.15%); 4 The swap bank will pay firm AAA on
$10,000,000 at a fixed rate of 9.90%. Please answer the following
questions. · Show the value of this swap to firm
AAA? (answer: Firm AAA can save $500
each year) · Show the value of this swap to firm
BBB? ( answer:
Firm BBB will save $500 per year) · Show the value of the swap to the swap bank. (answer: The swap bank can earn $4,000 each year) |
|
||||

Hint: Just write down all relevant transactions for each player,
and sum them up. For example, AAA pays 10% and LIBOR-0.15%, and receive 9.9% è net result: 10% - 9.9% + LIBOR-0.15% = LIBOR
-0.05%, a saving of 0.05%, since if AAA gets the debt from the bank, AAA’s
interest rate would be LIBOR. Similarly, for BBB, pay LIBOR + 1.5% - (LIBOR -0.15%) + 10.3% = 11.95%, a
saving of 0.5%, since BBB could get 12% interest rate if BBB gets the loan
from the bank directly; To the SWAP Bank, its net result = Receive 10.3% from
BBB, and pays 9.9% to AAA, and receive LIBOR-0.15% from AAA and pays
LIBOR-0.15% to BBB, so net result = 10.3% - 9.9% +(LIBOR -0.15%) –
(LIBOR=0.15%) = 0.4%, the profit of the SWAP bank.)
Goldman Sachs
and Greece's decline - VPRO documentary – 2012
(FYI)
How Goldman Sachs Helped
Mask Greece's Debt
Goldman
Sachs details 2001 Greek derivative trades
By
Reuters Staff
LONDON, Feb 22, 2010 (Reuters) - Goldman Sachs GS.N has
defended the cross-currency derivatives it conducted for Greece in 2001 which
reduced the country's debt as a common currency risk management procedure
consistent with EU debt reporting rules. The US bank said that it did the
deals to reduce foreign denominated liabilities of Greece, which had become a
priority following the nation's entry into the single European currency.
“The Greek government has stated (and we agree) that these
transactions were consistent with the Eurostat principles governing their use
and application at the time,” said Goldman Sachs in a
statement on its website on Sunday.
Details on the nine-year old swaps have re-emerged after
several months of concern about Greece‘s budget and debt levels.
The country has battled to establish credibility over reducing
its budget deficit, which at just under 13 percent is more than four times
the 3 percent level stipulated by Maastrict.
Goldman has explained the derivatives in the context of EU
rules on unhedged foreign currency debt which stated that these had to be
converted into euros using the year-end currency rate.
Therefore a rise in the dollar or yen, currencies in which
Greece had frequently issued debt, increased the country’s reported debt.
To mitigate this currency risk, in December 2000 and in June 2001, Greece conducted cross-currency
swaps and restructured its cross-currency swap portfolio with Goldman Sachs
at a historical implied foreign exchange rate, the U.S. investment bank
said.
This was a practice commonly undertaken by European
sovereigns, Goldman Sachs said.
These transactions reduced
Greece’s foreign denominated debt in euro terms by 2.367 billion euros and,
in turn, decreased Greece’s debt as a percentage of GDP by just 1.6%, from
105.3% to 103.7%.
To offset a fall in the
value of the swap portfolio Greece and Goldman Sachs entered into a long-dated
interest rate swap.
The new interest rate swap
was on the back of a newly issued Greek bond, where Goldman Sachs paid the
bond coupon for the life of the trade and received the cash flows based on
variable interest rates.
In total the currency and
interest rate hedges reduced the Greece’s debt by a total of 2.3 billion
euros.
Greek
debt crisis: How easy is it to swap currencies?
Published
July 2015
https://www.bbc.com/news/world-europe-33462294
The
euro was meant to cast the Greek drachma into the book of obsolete
currencies, a note somewhere between the Rhodesian dollar and the brass
dupondius coins used in ancient Rome.
Yet as
the Greek government battles to satisfy its creditors, and avoid exiting the
single currency, its citizens face the very real possibility that the drachma
- or an alternative - could return.
While
there have been high-profile cases of countries switching currencies, in many
ways Greece's situation is unique. Here are some things Athens has to
consider.
We do not know what plans, if any, Greece has
to replace the euro. But nor would we expect to.
A mere
hint from any government that the money in their citizen's pockets will soon
become worthless would send people rushing to the banks.
If the
Syriza-led government is preparing an alternative currency, such plans will
have been worked out in secret. This might involve a foreign firm creating
the new notes.
A
precedent is post-war Germany. In 1948, confidence in the currency had
collapsed.
The
allies, keen to restore economic stability, printed billions of Deutsche
marks, as the new currency was called, and in a matter of days distributed it
around the country. It was quickly accepted.
Whether
Greece has the capacity for such a dramatic move is unclear, but the German
case shows how decisive action can work.
Greece already has capital controls in place
- which can be a precursor to a new currency
Another
example of a successful currency switch came in 1993 after Czechoslovakia
spilt.
A
currency union between the new Czech and Slovak nations lasted just 38 days,
when it became clear the faltering Slovakian economy could not keep pace with
its neighbour.
As in
Germany, notes were printed in secret and distributed around the country with
the help of the army.
But
also important were the capital controls and bans on cross-border transfers,
which kept money in state banks and prevented speculative flows between the
two nations.
Greece already has capital controls, and its
banks are closed, so in theory it has a head start, were it to introduce a
new currency.
After
the "Velvet Revolution" of 1989, Czechoslovakia had an amicable
"Velvet Divorce", including a currency split
So you
have printed wads of new notes and have your bank system on a tight leash.
You now need to find a way to introduce the new currency, and phase out the
old.
This is
where it gets tricky. It took years of planning and careful transition to
introduce the euro, yet Greece would have to bring a new currency in days.
Greece might run its new money side-by-side
with the old, meaning shops for a period would accept both.
Citizens could only be allowed to swap a set
amount of euros for cash, and be forced to deposit the rest, as the Czechs
and Slovaks were compelled too.
The government would have to decide on an
exchange rate to convert balances into the new currency. But would foreign
buyers of Greek goods want to be paid in drachma?
In an
interview with Britain's the Daily Telegraph, former Greek finance minister
Yanis Varoufakis suggested his country
could issue "California-style IOUs" as a way of introducing
liquidity into a system thirsty for cash.
He was referring to California in 2009, when
the US state, reeling from the financial crisis and unable to meet its bills,
gave IOUs to contractors in lieu of payments.
This is
not as outlandish as it sounds - the European Central Bank reportedly
examined a scenario where the Greek state paid civil servants in IOUs.
The move would buy Greece time, and could
ease the way to a formal new currency.
But
unless such notes can easily be exchanged for goods, this would not help
ordinary Greeks such as pensioners who rely on cash.
Greece
already has the means to print more euros at its press in Holargos, a suburb
of Athens, which once pumped out drachma.
Developing
new banknotes is expensive, and difficult - the notes must be secure and be
able to be recognised by cash machines - so such a scenario has appeal.
But
this would not be the euro, but rather a "euro" - a parallel Greek
version of the currency that is likely to devalue rapidly.
Greece
could also look to its Balkan neighbours Kosovo and Montenegro if it fails to
reach a deal. Despite the objections of the European authorities, both have
unilaterally adopted the euro.
Such a
move would give Greece a stable, internationally-recognised currency - but
one in which they had no say.
Slovakia's
economy may have been struggling when it abandoned its currency union with
the Czech Republic, but it bounced back and later qualified for eurozone
membership.
Estonia
was the first to leave the Soviet rouble. Although the new currency was
unstable at first, its adoption helped the country towards a successful free-market
economy.
And having your own currency is not just a
financial decision, but a point of national pride.
South
Sudan introduced a new currency after it split from the north four years ago.
Inflation has been a problem ever since, but for many in South Sudan it was
an important way of asserting their new sovereignty.
Long-term
damage
East
Germany is arguably still paying the price for adopting the Deutsche mark
after reunification.
East Germans
were able to exchange their eastern marks one to one - great for individuals,
but industry was unable to compete with the advanced West German economy.
Introducing
a new currency is possible - former Czech Republic President Vaclav Klaus
called it "a simple administrative thing to do" but its success
depends on more than technical considerations.
Anything can be used as money, so long as
there is confidence in it - it seems bizarre
to think that Chinese traders once used cowrie shells, but imagine what they
would make of Bitcoins.
A Greek break with the euro is unlikely to be
clean, as its former currency will remain in circulation. It is unclear how readily a Greek society already divided over the
euro would take to something new.
Greek
Debt Crisis
How
Goldman Sachs Helped Greece to Mask its True Debt
Goldman Sachs helped the Greek government to
mask the true extent of its deficit with the help of a derivatives deal that
legally circumvented the EU Maastricht deficit rules. At some point the so-called
cross currency swaps will mature, and swell the country's already bloated
deficit.
Von
Beat Balzli, 08.02.2010, 18.55 Uhr, Zur Merkliste hinzufügen
Greeks
aren't very welcome in the Rue Alphones Weicker in Luxembourg. It's home to
Eurostat, the European Union's statistical office. The number crunchers there
are deeply annoyed with Athens. Investigative reports state that important
data "cannot be confirmed" or has been requested but "not
received."
Creative accounting took priority when it
came to totting up government debt. Since 1999, the Maastricht rules threaten
to slap hefty fines on euro member countries that exceed the budget deficit
limit of three percent of gross domestic product. Total government debt
mustn't exceed 60 percent.
The Greeks have never managed to stick to the
60 percent debt limit, and they only adhered to the three percent deficit
ceiling with the help of blatant balance sheet cosmetics. One time, gigantic military expenditures were left out, and another
time billions in hospital debt. After recalculating the figures, the experts
at Eurostat consistently came up with the same results: In truth, the deficit each year has been far greater than the three
percent limit. In 2009, it exploded to over 12 percent.
Now,
though, it looks like the Greek figure jugglers have been even more brazen
than was previously thought. "Around
2002 in particular, various investment banks offered complex financial
products with which governments could push part of their liabilities into the
future," one insider recalled, adding that Mediterranean countries
had snapped up such products.
Greece's debt managers agreed a huge deal
with the savvy bankers of US investment bank Goldman Sachs at the start of
2002. The deal involved so-called cross-currency swaps in which government
debt issued in dollars and yen was swapped for euro debt for a certain period
-- to be exchanged back into the original currencies at a later date.
Fictional
Exchange Rates
Such transactions are part of normal
government refinancing. Europe's governments obtain funds from investors
around the world by issuing bonds in yen, dollar or Swiss francs. But they
need euros to pay their daily bills. Years later the bonds are repaid in the
original foreign denominations.
But in the Greek case the US bankers devised
a special kind of swap with fictional exchange rates. That enabled Greece to
receive a far higher sum than the actual euro market value of 10 billion
dollars or yen. In that way Goldman Sachs secretly arranged additional credit
of up to $1 billion for the Greeks.
This credit disguised as a swap didn't show
up in the Greek debt statistics. Eurostat's reporting rules don't
comprehensively record transactions involving financial derivatives.
"The Maastricht rules can be circumvented quite legally through
swaps," says a German derivatives dealer.
In
previous years, Italy used a similar trick to mask its true debt with the
help of a different US bank. In 2002 the Greek deficit amounted to 1.2
percent of GDP. After Eurostat reviewed the data in September 2004, the ratio
had to be revised up to 3.7 percent. According to today's records, it stands
at 5.2 percent.
At some
point Greece will have to pay up for its swap transactions, and that will
impact its deficit. The bond maturities range between 10 and 15 years.
Goldman Sachs charged a hefty commission for the deal and sold the swaps on
to a Greek bank in 2005.
The
bank declined to comment on the controversial deal. The Greek Finance Ministry
did not respond to a written request for comment.
Final Exam on 4/28 on blackboard
Study guide (chapters 11,
18 and interest rate parity)
Multiple choice and true/false questions
(2 points each; 2*30=60 points; only chapters 11 and 18; lockdown browser)
1
How to hedge transaction
exposure? (hint: option, forward contract, money market)
2
How to hedge with options
(hint: receivable and payable use either put or call options)
3
How to hedge with forward
contracts
4
How to hedge with money
market
5
What is interest rate swap?
6
What is currency swap?
7
What are the primary reasons
for a multinational firm to use an interest rate swap?
8
What are the primary reasons
for a multinational firm to use a currency swap?
9
What is a plain vanilla
swap?
10
What are the primary risks
for a multinational firm involving in an interest rate swap?
11
What are the primary risks
for a multinational firm involving in a currency swap?
12
Greece debt crisis: How did
Goldman Sacks help Greek to mask its true debt?
Calculation part (five
questions; 8 points each; open book open notes)
1
Interest rate parity question (similar to
the following)
FYI:
i$ is
8%; iyen is 4%; If spot rate S =
0.0094 $/YEN, then how much is F180 (180 day forward rate)?
Answer:
S = 0.0094
$/YEN, so $ is the quoted currency, Yen is the base currency.
F = S *(1+
interest rate of quoted currency) / (1+ interest rate of base) F=0.0094*(1+8%/2)/(1+4%/2)
= 0.0096 $/YEN
FYI: calculator https://www.jufinance.com/irp/
2
Hedging payable using money market
instrument, forward contract, and call option (similar to the in class
exercise)
FYI:
A U.S.–based
importer of Italian bicycles
· In
one year owes €100,000 to an Italian supplier.
· The
spot exchange rate is $1.18 = €1.00
· The
one year forward rate is $1.20 = €1.00
· The
one-year interest rate in Italy is i€ = 5%
· The
one-year interest rate in US is i$ = 8%
— Call option
exercise price is $1.2/ € with premium of $0.03.
How to hedge the
currency payable risk
a. With
forward contract?
b. With
money market?
c. With
call option? Can we use put option?
Answer: Need €100,000 one
year from now to pay the payable and plan to hedge the risk of overpaying for
the payable one year from now.
1) With
forward contract:
Buy the one year
forward contract @$1.20 = €1.00. So need 100,000€*1.2$/€ = $120,000
one year from now. So the company needs to come up with $120k for this
payable obligation.
2) With
money market:
Need €100,000
one year from now, and the rate is 5% in Italy, so can
deposit €100,000/(1+5%) = €95238.10 now.
For this
purpose, need to convert from € to $: €95238.10*$1.18
/€=$112380.98.
Imagine the
company does not have that much of cash and it borrows @8%. So one year from
now, the total $ required to pay back to the banks is: $112380.98 *(1+8%) =
$121371.43. So the company needs to come up
with $121371.43for this payable obligation.
Summary: Borrow
$112380.98 @8% and convert to €95238.10 at present; One year later, the
company can get the €100,000 and needs to pay back to the bank a total
of $121371.43.
3) With
call option:
Imagine the rate
one year later is $1.25/€. So should exercise the call option and the cost
one year later should be
€100,000
*(1.2+0.03) $/€ = $123000, lower than the actual cost without the call
option. So $123k is the most that the company needs to prepare for this
payable obligation. USING CALL OPTION, THE ACTAUL PAYMENT COULD BE A LOT
LESS, DEPENDING ON THE ACTAUL EXCHANGE RATE ONE YEAT LATER.
3
Hedging receivable using money market
instrument, forward contract, and call option(similar to the in class
exercise)
FYI:
A U.S.–based exporter of
US bicycles to Swiss distributors
· In
6 months receive SF200,000 from an Swiss distributor
· The
spot exchange rate is $0.71 = SF1.00
· The
6 month forward rate is $0.71 = SF1.00
· The
one-year interest rate in Swiss is iSF = 5%
· The
one-year interest rate in US is i$ = 8%
· Put
option exercise price is $0.72/ SF with premium of $0.02.
How to hedge the
currency payable risk
a. With
forward contract?
b. With
money market?
c. With
call option? Can we use put option?
Answer: Will receive SF200000
six month from now as receivable and plan to hedge the risk of losing value
in the receivable six month from now.
1) With
forward contract:
Sell the one
year forward contract @$0.71 = €1.00. So get 200,000SF * 0.71$/SF =
$142,000 six month from now. So the company could receive $142k with forward
contract.
2) With
money market:
Get SF200000 six
month from now, and the rate is 5% in Swiss (or 2.5% for six months), so can
borrow SF 200,000/(1+2.5%) = SF195121.95 now.
And can convert
@ spot rate to SF195121.95 * 0.71$/SF = $138536.59. This is the
money you have now.
So six
month from now, the total you have in the bank is: $138536.59*(1+4%) =
$144078.05. And you can use the SF200000 receivable to pay back the
loan. So the company could receive $144078.05 with money
market.
Summary: Borrow SF195121.95
@5% at present; six month later, the company can get
the SF200,000 receivable and payback the loan. Meanwhile, convert the
borrowed SF to $ and deposit in US banks @ 8%.
3) With
put option: With SF200000 received six month later, need
to converting it back to $. So can buy put option which allows to sell SF for
$ at the exercise price $0.72/ SF.
Imagine the rate
one year later is $0.66/ SF. So should exercise the put option
and the total amount of $ six month later should be SF
200,000 *(0.72-0.02) $/ SF = $140000. So $140k is the LEAST that
the company CAN OBTAIN. USING PUT OPTION, THE ACTAUL INCOME COULD
BE A LOT MORE, DEPENDING ON THE ACTAUL EXCHANGE RATE ONE YEAT LATER.
4
Interest rate swap: calculate the net
outcome of each party involved, including two multinational firms and the
swap bank (similar to the homework question)
FYI
Company AAA will borrow
$1,000,000 for ten years at a floating rate. Company BBB will borrow for ten
years at a fixed rate for $1,000,000. Refer to the following for details.
|
|
|
Fixed-Rate Borrowing
Cost |
Floating-Rate Borrowing Cost |
|
|
|
|
Company AAA |
10% |
LIBOR |
|
|
|
|
Company BBB |
12% |
LIBOR + 1.5% |
|
|
|
Note: ·
Company AAA anticipates
the interest rates to fall in the future and prefers a floating rate loan. However, company AAA can get a better deal
in a fixed rate loan. ·
On the contrary, company BBB
anticipates the interest rates to rise and therefore prefers a fixed rate
loan. Company BBB’s comparative advantage is in getting a floating rate
loan. ·
So both companies could be
better off with a interest rate swap contract. Assume that a swap bank help the two
parties. 1
According to the swap contract, Firm BBB will pay the swap bank on
$1,000,000 at a fixed rate of 10.30% 2
The swap bank will pay firm BBB on $1,000,000 at the floating rate of (LIBOR - 0.15%). 3
Firm AAA needs to pay the swap bank on $1,000,000 at the floating
rate of (LIBOR - 0.15%); 4
The swap bank will pay firm AAA on $10,000,000 at a fixed rate of
9.90%. Please answer the following questions. •
Show the value of this swap to firm AAA? (answer: Firm AAA can save
$500 each year) •
Show the value of this swap to firm BBB? ( answer: Firm BBB will
save $500 per year) •
Show the value of the swap to the swap bank. (answer: The swap bank
can earn $4,000 each year) |
|||||
Warmest congratulations on your graduation!
