FIN301 Class Web Page, Spring ' 25
Instructor: Maggie Foley
Jacksonville University
The
Syllabus PDF file Risk Tolerance Test (FYI) Term Project Guidelines Grade Calculator
Weekly SCHEDULE, LINKS, FILES and Questions
|
Chapter |
Coverage, HW, Supplements -
Required |
References |
|||||||||||||||||||||||||||||||||||||||||||||||||||||||||||||||||||||||||||||||||||||||||||||||||||||||||||||||||||||||||||||||||||||||||||||||||||||||||||||||||||||||||||||||||||||||||||||||||||||||||||||||||||||||||||||||||||||||||||||||||||||||||||||||||||||||||||||||||||||||||||||||||||||||||||||||||||||||||||||||||||||||||||||||||||||||||||||||||||||||||||||||||||||||||||||||||||||||||||||||||||||||||||||||||||||||||||||||||||||||||||||||||||||||||||||||||||||||||||||||||||||||||||||||||||||||||||||||||||||||||||||||||||||||||||||||||||||||||||||||||||||||||||||||||||||||||||||||||||||||||||||||||||||||||||||||||||||||||||||||||||||||||||||||||||||||||||||||||||||||||||||||||||||||||||||||||||||||||||||||||||||||||||||||||||||||||||||||||||||||||||||||||||||||||||||||||||||||||||||||||||||||||||||||||||||||||||||||||||||||||||||||||||||||||||||||||||||||||||||||||||||||||||||||||||||||||||||||||||||||||||||||||||||||||||||||||||||||||||||||||||||||||||
Chapter 1: Introduction Flow
of funds describes the financial assets flowing from various sectors through financial
intermediaries for the purpose of buying physical or financial assets. *** Household, non-financial business, and our government Financial
institutions facilitate exchanges of funds and financial products. ***
Building blocks of a financial system. Passing and transforming funds and
risks during transactions. ***
Buy and sell, receive and deliver, and create and underwrite financial
products. ***
The transferring of funds and risk is thus created. Capital utilization for
individual and for the whole economy is thus enhanced. Part
1 - Who Wants to Chair the Fed? Quiz 1 Game: https://lewis500.github.io/macro/ The
Federal Reserve (Fed) often faces the challenging dilemma of balancing economic
growth with price stability - commonly
referred to as the trade-off between controlling inflation
and minimizing unemployment. 1. Inflation vs. Unemployment
2. Long-term Stability vs. Short-term Relief
3. Uncertainty and Lag Effects
In
the game, you play as the Fed chair and must make interest rate decisions to
strike this delicate balance while keeping inflation and unemployment within
acceptable ranges. Success depends on how well you manage these competing
goals over time. Factors
to Consider:
1.
Current Inflation Rate:
2.
Unemployment Rate:
3.
Economic Growth:
4.
Consumer and Business
Confidence:
5.
Financial Market
Conditions:
6.
Global Economic Trends:
7.
Lag Effects of Monetary
Policy:
8.
Federal Reserve’s Dual Mandate:
In-Class
Debate: Should the Fed Reduce Interest Rates Soon, or Is It Better to Wait?
The next Federal Open Market Committee (FOMC) meeting is scheduled for January 28–29, 2025. Let’s wait and see what unfolds leading up to this critical decision. Chapter 2 Introduction
of Financial Market 1.
What are the six parts of the financial
markets
Money: ·
To pay for purchases and store wealth
(fiat money, fiat currency) Financial
Instruments: ·
To transfer resources from savers to investors
and to transfer risk to those best equipped to bear it. Financial
Markets: ·
Buy and sell financial instruments ·
Channel funds from savers to investors,
thereby promoting economic efficiency ·
Affect personal wealth and behavior of business
firms. Example? Financial
Institutions. ·
Provide access to financial markets,
collect information & provide services ·
Financial Intermediary: Helps get funds
from savers to investors Central
Banks ·
Monitor financial Institutions and
stabilize the economy Regulatory
Agencies ·
To provide oversight for financial system.
2. What are the five core
principals of finance
No homework for chapters 1, 2 |
The Implications of Trump's Return on U.S.
Trade Policy: Will Tariffs and Trade Wars Resurface? (FYI) Background Trump's
presidency (2017-2021) featured aggressive trade policies, including significant
tariffs on China and other trading partners, renegotiations of trade
agreements, and discussions about protecting American manufacturing through
quotas and tariffs.
Key
Insights
1.
Jobs:
2.
Cost of Living: ·
Prices rise for everyday goods (e.g.,
food, clothes, electronics) when tariffs increase import costs. ·
Higher energy costs can have widespread
effects across industries. 3.
Availability of Goods: ·
Imported goods (e.g., seasonal produce,
luxury cars, and tech gadgets) may become limited or delayed. ·
Domestic alternatives might not match global
competition in terms of quality, price, or innovation. Now,
let’s work on this survey about tariffs. Tariff Survey Game: Tariff Trade Simulation A simple game What Determines the
Strength of the US Dollar? (self-produced video) Swiss franc carry trade
comes fraught with safe-haven rally risk (FYI) By Harry Robertson September 2, 20241:03 AM EDTUpdated 5 months ago LONDON, Sept 2 (Reuters) - As investors turn to the Swiss
franc as an alternative to Japan's yen to fund carry trades, the risk of the
currency staging one of its rapid rallies remains ever present. The Swiss franc has long been used in the popular strategy
where traders borrow currencies with low interest rates then swap them into
others to buy higher-yielding assets. Its appeal has brightened further as the yen's has dimmed. Yen
carry trades imploded in August after the currency rallied hard on weak U.S.
economic data and a surprise Bank of Japan rate hike, helping spark global
market turmoil. The Swiss National Bank (SNB) was the first major central bank
to kick off an easing cycle earlier this year and its key interest rate
stands at 1.25%, allowing investors to borrow francs cheaply to invest
elsewhere. By comparison, interest rates are in a 5.25%-5.50% range in
the United States, 5% in Britain, and 3.75% in the euro zone. "The Swiss franc is back as a funding currency,"
said Benjamin Dubois, global head of overlay management at Edmond de
Rothschild STABILITY The franc is near its highest in eight months against the
dollar and in nine years against the euro , reflecting its status as a
safe-haven currency and expectations for European and U.S. rate cuts. But investors hope for a gradual decline in the currency's
value that could boost the returns on carry trades. Speculators have held on to a $3.8 billion short position against
the Swiss franc even as they have abruptly moved to a $2 billion long
position on the yen , U.S. Commodity Futures Trading Commission data shows. "There is more two-way risk now in the yen than there has
been for quite some time," said Bank of America senior G10 FX strategist
Kamal Sharma. "The Swiss franc looks the more logical funding currency
of choice." BofA recommends investors buy sterling against the franc ,
arguing the pound can rally due to the large interest rate gap between
Switzerland and Britain, in a call echoed by Goldman Sachs. The SNB appears set to cut rates further in the coming months
as inflation dwindles. That would lower franc borrowing costs and could weigh
on the currency, making it cheaper to pay back for those already borrowing
it. Central bankers also appear reluctant to see the currency
strengthen further, partly because of the pain it can cause exporters. BofA
and Goldman Sachs say they believe the SNB stepped in to weaken the currency
in August. "The SNB will likely guard against currency appreciation
through intervention or rate cuts as required," said Goldman's G10
currency strategist Michael Cahill. 'INHERENTLY RISKY' Yet the Swissie, as it is known in currency markets, can be an
unreliable friend. Investors are prone to pile into the currency when they get
nervous, thanks to its long-standing safe-haven reputation. Cahill said the franc is best used as a funding currency at
moments when investors are feeling optimistic. A quick rally in the currency used to fund carry trades can
wipe out gains and cause investors to rapidly unwind their positions, as the
yen drama showed. High levels of volatility or a drop in the higher-yielding
currency can have the same effect. The SNB and Swiss regulator Finma declined to comment when
asked by Reuters about the impact of carry trades on the Swiss currency. As stock markets tumbled in early August, the Swiss franc
jumped as much as 3.5% over two days. The franc-dollar pair has proven
sensitive to the U.S. economy, often rallying hard on weak data that causes
U.S. Treasury yields to fall. "Any carry trade
is inherently risky and this is particularly true for those funded with
safe-haven currencies," said Michael Puempel, FX strategist at
Deutsche Bank. "The main risk is that when yields move lower in a
risk-off environment, yield differentials compress and the Swiss franc can
rally," Puempel added. A gauge of how much investors expect the Swiss currency to
move , derived from options prices, is currently at around its highest since
March 2023. "Considering the central banks, you can see how there may
be more sentiment for some carry players to prefer the franc over the
yen," said Nathan Vurgest, head of trading at Record Currency
Management. "The ultimate success of this carry trade might still be
dependent on how quickly it can be closed in a risk-off scenario,"
Vurgest said, referring to a moment where investors cut their riskier trades
to focus on protecting their cash. Get the latest news and expert analysis about the state of the
global economy with the Reuters Econ World newsletter. Sign up here. Reporting by Harry Robertson; Editing by Dhara Ranasinghe and
Alexander Smith Key Insights from the
Article:
1.
Swiss Franc as a Funding
Currency:
2.
Carry Trade Dynamics:
3.
Safe-Haven Risks:
4.
Central Bank Influence:
5.
Strategist Views:
6.
Risks of Swiss Franc
Carry Trades:
7.
Investor Sentiment:
This
analysis highlights the opportunities |
||||||||||||||||||||||||||||||||||||||||||||||||||||||||||||||||||||||||||||||||||||||||||||||||||||||||||||||||||||||||||||||||||||||||||||||||||||||||||||||||||||||||||||||||||||||||||||||||||||||||||||||||||||||||||||||||||||||||||||||||||||||||||||||||||||||||||||||||||||||||||||||||||||||||||||||||||||||||||||||||||||||||||||||||||||||||||||||||||||||||||||||||||||||||||||||||||||||||||||||||||||||||||||||||||||||||||||||||||||||||||||||||||||||||||||||||||||||||||||||||||||||||||||||||||||||||||||||||||||||||||||||||||||||||||||||||||||||||||||||||||||||||||||||||||||||||||||||||||||||||||||||||||||||||||||||||||||||||||||||||||||||||||||||||||||||||||||||||||||||||||||||||||||||||||||||||||||||||||||||||||||||||||||||||||||||||||||||||||||||||||||||||||||||||||||||||||||||||||||||||||||||||||||||||||||||||||||||||||||||||||||||||||||||||||||||||||||||||||||||||||||||||||||||||||||||||||||||||||||||||||||||||||||||||||||||||||||||||||||||||||||||||||||
|
Chapter 5 Time value of Money Key Topics Covered: 1.
Future Value (FV): ·
Definition: The amount of money an
investment will grow to after earning interest over a specific period. ·
Formula: See the column to the right for
details. ·
Application: Learn how to calculate the
future value of savings or investments. 2.
Present Value (PV): ·
Definition: The current worth of a future
sum of money or cash flow, discounted at a specific rate. ·
Formula: See the column to the right for
details. ·
Application: Understand how to assess the
value of future payments or investments today. 3.
Payment (PMT): ·
Definition: The fixed payment required to
repay a loan over time, including interest. ·
Formula: See the column to the right for
details. ·
Application: Learn how to calculate
payments for loans, such as car loans or mortgages. 4.
Interest Rate (Rate): ·
Definition: The rate of return or cost of
borrowing, expressed as a percentage. ·
Formula: See the column to the right for
details. ·
Application: Learn how to determine the
interest rate needed to achieve a financial goal. 5.
Number of Periods (NPER): ·
Definition: The number of time periods
required for an investment to reach a specific future value or for a loan to
be paid off. ·
Formula: See the column to the right for
details. ·
Application: Determine how long it will
take to save or grow your money. 6.
Net Present Value (NPV), Net Future Value
(NFV) ·
Net Present Value (NPV): The difference between the
present value of cash inflows and outflows over a period of time. It is used
to assess the profitability of an investment or project. ·
Net Future Value (NFV): The future value of all
cash inflows and outflows accumulated at a specific interest rate. It
provides a measure of the total future worth of an investment. 7.
Effective Annual Rate (EAR) and Annual
Percentage Rate (APR) ·
Effective Annual Rate (EAR): ·
Annual Percentage Rate (APR): 8. Ordinary Annuity (PMT) and
Annuity Due (PMT, type=1) •
Ordinary Annuity (PMT): •
Annuity Due (PMT, type=1): Real-World Applications:
1.
Planning
for the Future: o Use
TVM concepts to plan for retirement, save for large purchases, or achieve
financial goals. 2.
Loan
Management: o Calculate
loan payments for car loans, mortgages, or student loans. o Compare
loans and understand the cost of borrowing. 3.
Credit
Card Decisions: o Evaluate
interest rates and payment terms to choose the best credit card. 4.
Investment
Opportunities: o Compare
investment options by calculating present and future values. Key Takeaways:
The time value of money - German Nande (video)
Tutoring of Time Value of Money
calculation in Excel (video) Chapter 5 – Escape Room – To Earn
Fake Etherum and Meme Coins Questions in the escape
room exercises: 1.
You
are investing $5,000 (Present Value) in an account that earns 4% annual
interest (Rate) for 8 years (Number of Periods). What is the Future Value of
your investment? (fv=abs(fv(4%, 8,
0, 5000)), or fv =5000*(1+4%)^8) 2.
You are investing $3,000 (Present Value) in
an account that earns 3% annual interest (Rate) for 12 years (Number of
Periods). What is the Future Value of your investment? (fv=abs(fv(3%, 12, 0, 3000)), or fv =3000*(1+3%)^12) 3.
You
need $20,000 in 10 years (Future Value) and can earn 3% annual interest
(Rate). What is the Present Value of your investment? (pv=abs(pv(3%, 10, 0, 20000)), or pv =20000/(1+3%)^10) 4. You need $15,000 in 5 years (Future
Value) and can earn 2% annual interest (Rate). What is the Present Value of
your investment? (pv=abs(pv(2%, 5,
0, 15000)), or pv =15000/(1+2%)^5) 5. You invested $5,000 (Present Value) and it
grew to $6,500 (Future Value) in 5 years. What was the annual interest rate? (rate=rate(5, 0, 5000, -6500)), or
rate = ln(6500/5000)^(1/5)-1) 6. You invested $8,000 (Present Value) and it
grew to $10,000 (Future Value) in 6 years. What was the annual interest rate?
(rate=rate(6, 0, 8000, -10000)), or
rate = ln(10000/5=6000)^(1/6)-1) 7. You invested $5,000 (Present Value) at an
annual interest rate of 4% and it grew to $6,000 (Future Value). How many
years did it take? (nper = nper(4%,
0, 5000, -6000), nper = ln(6000/5000)/(ln(1+4%)) 8. You invested $10,000 (Present Value) at an
annual interest rate of 5% and it grew to $15,000 (Future Value). How many
years did it take? (nper = nper(5%,
0,10000, -15000), nper = ln(15000/10000)/(ln(1+5%)) 9.
You take a $30,000 loan (Present Value) at 4% annual interest (Rate) for 5 years
(Number of Periods). What is your monthly payment? (pmt=pmt(4%/12, 5*12, 30000, 0)) 10. You take a $20,000 loan (Present
Value) at 3% annual interest (Rate) for 10 years (Number of Periods). What is
your monthly payment? (pmt=pmt(3%/12,
10*12, 20000, 0)) Chapter 5 Homework (due with the
first mid term) 1.
You
deposit $5,000 in a saving account at 10% compounded annually. How much is
your first year interest? How much is your second year interest? (500, 550) 2.
What
is the future value of $5,000 invested for 3 years at 10% compounded
annually? ( 6,655) 3.
You
just bought a TV for $518.4 on credit card. You plan to pay back of $50 a
month for this credit card debt. The credit card charges you 12% of interest
rate on the monthly basis. So how long does it take to pay back your credit
card debt? (11 months) 4.
You
are going to deposit certain amount in the next four years. Your saving
account offers 5% of annual interest rate. First year: $800 Second year: $900 Third year: $1000 Fourth year: $1200. How much you can withdraw four years later? (4168.35) (hint:
refer to https://www.jufinance.com/nfv/
) 5.
You
are going to deposit certain amount in the next four years. Your saving
account offers 5% of annual interest rate. First year: $800 Second year: $900 Third year: $1000 Fourth year: $1200. How much is the lump sum value as of today (NPV)? (3429.31)
(Hint: use npv function in excel) 6.
Ten
years ago, you invested $1,000. Today it is worth $2,000. What rate of
interest did you earn? (7.18%) 7.
At
5 percent interest, how long would it take to triple your
money? (22.52) 8.
What
is the effective annual rate if a bank charges you 12 percent compounded
monthly? (12.68%) (hint: use effect function in excel) 9.
Your
father invested a lump sum 16 years ago at 8% interest for your education.
Today, that account worth $50,000.00. How much did your father deposit 16
years ago? ($14594.52) 10.
You
are borrowing $300,000 to buy a house. The terms of the mortgage call for
monthly payments for 30 years at 3% interest. What is the amount of each
payment? ($1264.81) 11.
You
deposit $200 at the beginning of each month into your saving account
every month. After two years (24 deposits total), your account value is
$6,000. Assuming monthly compounding, what is your monthly rate that the bank
provides? (1.74%) 12.
You want to buy a fancy car. For this goal,
you plan to save $5,500 per year, beginning immediately. You will make 4 deposits in an account that
pays 8% interest. Under these
assumptions, how much will you have 4 years from today? ($26,766.31) 13. The Thailand Co. is considering the
purchase of some new equipment. The quote consists of a quarterly payment of
$4,740 for 10 years at 6.5 percent interest. What is the purchase price of
the equipment? ($138,617.88) 14. Today, you are purchasing a 15-year, 8
percent annuity at a cost of $70,000. The annuity will pay annual payments.
What is the amount of each payment? ($8,178.07) 15. Shannon wants to have $10,000 in an
investment account three years from now. The account will pay 0.4 percent
interest per month. If Shannon saves money every month, starting one month
from now, how much will she have to save each month? ($258.81) 16. Trevor's Tires is offering a set of 4
premium tires on sale for $450. The credit terms are 24 months at $20 per
month. What is the interest rate on this offer? (6.27 percent) 17. Top Quality Investments will pay you
$2,000 a year for 25 years in exchange for $19,000 today. What interest rate
are you earning on this annuity? (9.42 percent) 18. Around Town Movers recently purchased a
new truck costing $97,000. The firm financed this purchase at 8.25 percent
interest with monthly payments of $2,379.45. How many years will it take the
firm to pay off this debt? (4.0 years) 19. You just received a credit offer in an
email. The company is offering you $6,000 at 12.8 percent interest. The
monthly payment is only $110. If you accept this offer, how long will it take
you to pay off the loan? (82.17 months) 20. What is the future value of weekly
payments of $25 for six years at 10 percent? ($10,673.90) |
Summary of math and excel equations Math Formula FV = PV *(1+r)^n PV = FV / ((1+r)^n) N = ln(FV/PV) / ln(1+r) Rate = (FV/PV)1/n -1 Annuity: N = ln(FV/C*r+1)/(ln(1+r)) Or N = ln(1/(1-(PV/C)*r)))/ (ln(1+r))
Excel Formulas To get FV, use FV function. =abs(fv(rate, nper,
pmt, pv)) To get PV, use PV
function = abs(pv(rate, nper,
pmt, fv)) To get r, use rate
function =
rate(nper, pmt, pv, -fv) To get number of years,
use nper function = nper(rate, pmt, pv,
-fv) To
get annuity payment, use PMT function = pmt(rate, nper, pv,
-fv) To
get Effective rate (EAR), use Effect function =
effect(nominal_rate, npery) To
get annual percentage rate (APR), use nominal function =
nominal(effective rate, npery) NPV NFV calculator(FYI, might be helpful) Time Value of Money
Calculator |
||||||||||||||||||||||||||||||||||||||||||||||||||||||||||||||||||||||||||||||||||||||||||||||||||||||||||||||||||||||||||||||||||||||||||||||||||||||||||||||||||||||||||||||||||||||||||||||||||||||||||||||||||||||||||||||||||||||||||||||||||||||||||||||||||||||||||||||||||||||||||||||||||||||||||||||||||||||||||||||||||||||||||||||||||||||||||||||||||||||||||||||||||||||||||||||||||||||||||||||||||||||||||||||||||||||||||||||||||||||||||||||||||||||||||||||||||||||||||||||||||||||||||||||||||||||||||||||||||||||||||||||||||||||||||||||||||||||||||||||||||||||||||||||||||||||||||||||||||||||||||||||||||||||||||||||||||||||||||||||||||||||||||||||||||||||||||||||||||||||||||||||||||||||||||||||||||||||||||||||||||||||||||||||||||||||||||||||||||||||||||||||||||||||||||||||||||||||||||||||||||||||||||||||||||||||||||||||||||||||||||||||||||||||||||||||||||||||||||||||||||||||||||||||||||||||||||||||||||||||||||||||||||||||||||||||||||||||||||||||||||||||||||||
|
Chapter 3 Financial Statement Analysis Ppt
Quiz on BS and IS
Quiz on Cash Flow
Statement Explaining 4
Financial Statements (youtube)
*************
Introduction *************** Let’s
compare Nike with GoPro based on 10K (www.nasdaq.com) https://www.nasdaq.com/market-activity/stocks/nke/financials https://www.nasdaq.com/market-activity/stocks/nke/financials Nike’s
Income Statement
Nike’s
Balance Sheet
Nike’s
Cash Flow Statement
Nike’s
Financial Ratios
Nike vs GoPro Financial Summary
Let’s
find it out by comparing stock performance between the two firms. Nike Stock Performance (finance.yahoo.com) https://finance.yahoo.com/quote/NKE/
Observations:
******* Part I: Balance Sheet and
Income Statement ************** Home Depot (Ticker in the market:
HD) reported the following information for the year ended January 30th,
2011 (expressed in millions). Sales: $67,977 Cost of goods sold: $44,693 Marketing, general and
administrative expenses: $15,885 Depreciation expenses:
$1,616 Interest expense: $530 Tax rate: 36.70% Number of shares
outstanding: 1,623 Dividends paid to
stockholders: $1,569. Use the above information
to try to prepare the income statement of Home Depot
for the year ended January 30th, 2011 Home Depot (Ticker in the
market: HD) reported the following information for the year ended January 30th,
2011 (expressed in millions). Cash: $545 Accounts receivables: $1,085 Inventories: $10625 Other current assets: $1,224 Gross fixed assets: $38,471 Accumulated depreciation:
$13,411 Other fixed assets: $1,586 Accounts payable: $9,080 Short term notes payable:
$1,042 Long term debt: $11,114 Total common stock: $3,894 Retained earnings: $14,995 Use the
above information to try to prepare the balance sheet
of Home Depot for the year ended January 30th, 2011 |
https://www.nasdaq.com/market-activity/stocks/gpro/financials
GoPro GoPro’s
Income Statement
GoPro’s
Balance Sheet
GoPro’s
Cash Flow Statement
GoPro’s
Financial Ratios
* GoPro
Stock performance ( finance.yahoo.com
) https://finance.yahoo.com/quote/GPRO/
http://www.jufinance.com/10k/bs http://www.jufinance.com/10k/is http://www.jufinance.com/10k/cf Ratio Analysis (plus balance sheet, income statement) http://www.jufinance.com/ratio * |
||||||||||||||||||||||||||||||||||||||||||||||||||||||||||||||||||||||||||||||||||||||||||||||||||||||||||||||||||||||||||||||||||||||||||||||||||||||||||||||||||||||||||||||||||||||||||||||||||||||||||||||||||||||||||||||||||||||||||||||||||||||||||||||||||||||||||||||||||||||||||||||||||||||||||||||||||||||||||||||||||||||||||||||||||||||||||||||||||||||||||||||||||||||||||||||||||||||||||||||||||||||||||||||||||||||||||||||||||||||||||||||||||||||||||||||||||||||||||||||||||||||||||||||||||||||||||||||||||||||||||||||||||||||||||||||||||||||||||||||||||||||||||||||||||||||||||||||||||||||||||||||||||||||||||||||||||||||||||||||||||||||||||||||||||||||||||||||||||||||||||||||||||||||||||||||||||||||||||||||||||||||||||||||||||||||||||||||||||||||||||||||||||||||||||||||||||||||||||||||||||||||||||||||||||||||||||||||||||||||||||||||||||||||||||||||||||||||||||||||||||||||||||||||||||||||||||||||||||||||||||||||||||||||||||||||||||||||||||||||||||||||||||||
********* Part II: Cash Flow Statement ******************
·
Self produced video On
Cash Flow Statement
·
Cash Flows Explained
(youtbe)
Here
is the cash flow statement of home depot as of 2/2/2014.
Discussion: 2. What does net change in cash mean?
Now
let’s learn how to calculate cash changes in each session Source
of cash
Use
of Cash
Cash
Flow from Operations: Five Steps 1. Add back depreciation. 2. Subtract (add) any increase (decrease) in accounts
receivable. 3. Subtract (add) any increase (decrease) in inventory. 4. Subtract (add) any increase (decrease) in other current
assets. 5. Add (subtract) any increase (decrease) in accounts payable
and other accrued expenses
Chapter 3 HW (due with the First midterm exam) 1.
Firm AAA
just showed how it operated in the prior year. Sales
= $2,000; Cost of Goods Sold = $1,000; Depreciation Expense = $200;
Administrative Expenses = $180; Interest Expense = $30; Marketing Expenses =
$50; and Taxes = $200. Prepare income
statement 2.
A firm has $2000 in current assets, $3000
in fixed assets, $300 in accounts receivables, $300 accounts payable, and
$800 in cash. What is the amount of the inventory? (hint: 900) 3.
A
firm has net working capital of $1000. Long-term debt is $5000, total assets
are $8000, and fixed assets are $5000. What is the amount of the total
equity? (Hint: to find total equity, you need to calculate total debt, which
is a sum of long term debt and short term debt. Short term can be found from
new working capital.) (hint: 1000) 4.
Andre's Bakery has sales of $100,000 with
costs of $50,000. Interest expense is $20,000 and depreciation is $10,000. The
tax rate is 35 percent. What is the amount of tax paid? (hint:
7000)(hint: tax = taxable income * tax rate and taxable income = EBT) 5.
Andre's Bakery has sales of $100,000 with
costs of $50,000. Interest expense is $20,000 and depreciation is $10,000. The
tax rate is 35 percent. The company also paid $3,000 for dividend. What is
the retained earning? (hint: retained earning = net income -
dividend)(hint: 10,000) 6.
The Blue Bonnet's 2018 balance
sheet showed net fixed assets of $2.2 million, and the 2019 balance sheet
showed net fixed assets of $2.6 million. The company's income statement
showed a depreciation expense of $1,000,000. What was the amount of the net
capital spending for 2019? ($1,400,000) 7.
A firm has $500 in inventory,
$1,860 in fixed assets, $190 in accounts receivables, $210 in accounts
payable, and $70 in cash. What is the amount of the current assets? (760) 8.
A firm has net working capital
of $640. Total liability is $5,860. Total assets are $6,230, and fixed assets
are $3,910. What is the amount of long term debt? (4180) 9.
Which one of the following is
a use of cash? (answer: B) 10. A firm generated net income of $878. The depreciation
expense was $40 and dividends were paid in the amount of $25. Accounts
payables decreased by $13, accounts receivables increased by $20, inventory
decreased by $14, and net fixed assets decreased by $8. There was no interest
expense. What was the net cash flow from operating activity? (899) 11.
Teddy’s Pillows has beginning net fixed assets of $480 and ending net fixed
assets of $530. Assets valued at $300 were sold during the year. Depreciation
was $40. What is the amount of capital spending? (90) 12.
Art’s Boutique has sales of $640,000 and costs of $480,000. Interest expense
is $40,000 and depreciation is $60,000. The tax rate is 34%. What is the net
income? (39,600) |
(The excel file of the above cash flow statement is
here) More
exercises of chapter 3 (word file here) (solution) In class exercise 1.
Refer to the above table. Inventory has increased from $18,776
to $21,908. This is ____________ of cash; Long term
debt has increased from $9,800 to $11,500. This is ____________ of
cash. 2.
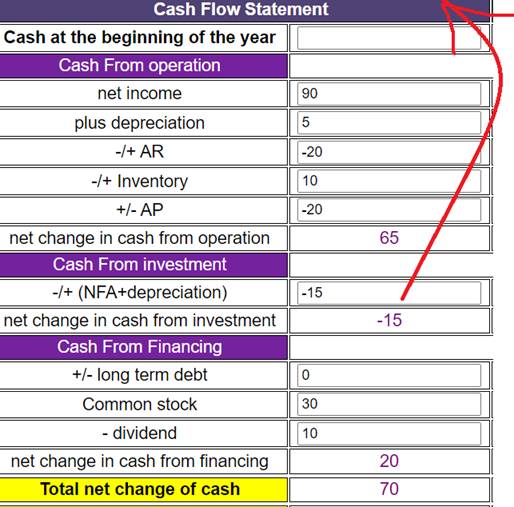
Prepare cash flow statement based on
information given Increase
in accounts receivable $20 Decrease
in inventory 10 Operating
income 120 Interest
expense 20 Decrease
in accounts payable 20 Dividend 10 Increase
in common stock 30 Increase
in net fixed asset 10 Depreciation 5 Income
tax 10 Beginning
cash 100 Why is
Investment Cash flow -$15? Assume
that Net fixed assets =$10 in previous year. Depreciation
= $5 è Net fixed assets will drop by $5 due to depreciation, so net fixed assets should be $10-$5=$5,
if the company has done nothing on fixed assets. However,
increase in Net Fixed Asset = $10 è net fixed assets = $10 + $10 = $20 this
year. How
much has been spent on fixed assets? $20-$5=$15
è It is a cash outflow, so -$15.
Solution: see above Note:
NI = EBIT – Interest – Tax = 120-20-10=90 |
||||||||||||||||||||||||||||||||||||||||||||||||||||||||||||||||||||||||||||||||||||||||||||||||||||||||||||||||||||||||||||||||||||||||||||||||||||||||||||||||||||||||||||||||||||||||||||||||||||||||||||||||||||||||||||||||||||||||||||||||||||||||||||||||||||||||||||||||||||||||||||||||||||||||||||||||||||||||||||||||||||||||||||||||||||||||||||||||||||||||||||||||||||||||||||||||||||||||||||||||||||||||||||||||||||||||||||||||||||||||||||||||||||||||||||||||||||||||||||||||||||||||||||||||||||||||||||||||||||||||||||||||||||||||||||||||||||||||||||||||||||||||||||||||||||||||||||||||||||||||||||||||||||||||||||||||||||||||||||||||||||||||||||||||||||||||||||||||||||||||||||||||||||||||||||||||||||||||||||||||||||||||||||||||||||||||||||||||||||||||||||||||||||||||||||||||||||||||||||||||||||||||||||||||||||||||||||||||||||||||||||||||||||||||||||||||||||||||||||||||||||||||||||||||||||||||||||||||||||||||||||||||||||||||||||||||||||||||||||||||||||||||||||
|
Chapter 4: Ratio
Analysis 3 Minutes! Financial Ratios & Financial
Ratio Analysis Explained & Financial Statement Analysis
Ratio
analysis template ( https://www.jufinance.com/ratio) Stock
screening tools FINVIZ.com http://finviz.com/screener.ashx We will focus on the following several ratios: P/E (price per share/earning per share, P/E < 15, a bargain) PEG (PE ratio / growth rate. PEG<1, undervalued stock)
(optional) EPS (earning per share) ROA (Return on Asset = NI/TA, ROA>10% should be a nice benchmark) ROE (return on equity = NI/TE, ROE>15% should be good) Current ratio (liquidity measure. = CA/CL, has to be
greater than one) Quick ratio (liquidity measure. = (CA-Inventory)/CL, has to be greater
than one) Debt Ratio (Leverage measure. = TD/TA, need to be optimal, usually
between 30% and 40%) Gross margin (profit measure. = EBITDA/sales, or = Gross margin/sales,
has to be positive) Operating margin (profit measure. = EBIT/sales, or = operating
income/sales, has to be positive) Net profit margin (profit measure. = NI/sales, has to be
positive) Payout ratio (= dividend / NI, measures distribution to shareholders.
No preferences. Usually value stocks have high payout ratio; Growth stocks
have low payout ratio). Total assets turnover = Sales/TA Inventory turnover ratio = Sales/Inventory Fixed assets turnover ratio = Cost of goods sold / Fixed assets Ratios &
Margins Nike Inc. Cl B
All values updated annually at fiscal year
end
Valuation
https://www.wsj.com/market-data/quotes/NKE/financials
In class exercise
How much is ROA in 2009? ROA in 2009? Quick
Ratio? Current Ratio? Debt Ratio? Payout Ratio? Operating margin? Net profit
margin? If the company’s stock is traded at $40 per
share and there are 2,000 shares outstand. How much is PE? Homework of chapter 4 ( due with the first midterm exam) 1. 1 .A firm has total
equity of $2,000 and a debt-equity ratio of 2. What is the value of the total
assets? (answer: $6,000) 2, The Co. has sales =
$50 million, total assets = $30 million, and total debt = $15 million. The
profit margin = 20%. What is the return on equity (ROE)? (answer: 66.67%. Hint: TE= 15 million; NI =10 million) |
|||||||||||||||||||||||||||||||||||||||||||||||||||||||||||||||||||||||||||||||||||||||||||||||||||||||||||||||||||||||||||||||||||||||||||||||||||||||||||||||||||||||||||||||||||||||||||||||||||||||||||||||||||||||||||||||||||||||||||||||||||||||||||||||||||||||||||||||||||||||||||||||||||||||||||||||||||||||||||||||||||||||||||||||||||||||||||||||||||||||||||||||||||||||||||||||||||||||||||||||||||||||||||||||||||||||||||||||||||||||||||||||||||||||||||||||||||||||||||||||||||||||||||||||||||||||||||||||||||||||||||||||||||||||||||||||||||||||||||||||||||||||||||||||||||||||||||||||||||||||||||||||||||||||||||||||||||||||||||||||||||||||||||||||||||||||||||||||||||||||||||||||||||||||||||||||||||||||||||||||||||||||||||||||||||||||||||||||||||||||||||||||||||||||||||||||||||||||||||||||||||||||||||||||||||||||||||||||||||||||||||||||||||||||||||||||||||||||||||||||||||||||||||||||||||||||||||||||||||||||||||||||||||||||||||||||||||||||||||||||||||||||||||||
|
Firm Midterm
Exam Solutions T/F Calculations Study
Guide 2.25.
- In Class Exam - Closed Book Closed
Notes
Time
Value of Money (TVM) - You Should Know:
Financial
Statements - You Should Know:
Cash
Flow - You Should Know:
Understanding
cash flow is important
because it shows how money moves in and out of a business. Even if a company
is profitable, it can still run out of cash if it doesn’t
manage its finances well. 1. What is Cash Flow?
2. Three Sections of the Cash Flow Statement
Operating
Activities (Day-to-Day Business Cash Flow)
Investing
Activities (Buying & Selling Assets)
Financing Activities (Raising Money &
Paying Debt)
3. Cash Flow vs. Profit –
What’s the Difference?
Example: A
company sells $10,000 worth of products but only collects $2,000 in cash now.
Profit looks good on paper, but cash
flow is low, which could cause trouble paying bills! 4. Why is Cash Flow Important?
·
Tells if a company can
survive – A company needs
enough cash to pay expenses. ·
Shows real financial
health – Net income
(profit) can be misleading, but cash flow is real. ·
Helps in decision-making – Investors look at cash flow to see if a company is a good
investment. 5. Key Cash Flow Red Flags
·
Negative Operating Cash
Flow – The company
isn't making enough money from its business. ·
High Debt Payments – If too much cash is going toward debt, the company may
struggle. ·
Declining Free Cash Flow – Less money available for growth or returning money to
investors. Final Takeaways
Financial
Ratios - You Should Know:
Liquidity Ratios (Can a company pay its
short-term bills?)
Profitability Ratios (Is the company
making money?)
Efficiency Ratios (How well does the
company use its assets?)
Leverage Ratios (How much debt does the
company have?)
Market Ratios (How valuable is the
company’s stock?)
Final Reminders:
|
|||||||||||||||||||||||||||||||||||||||||||||||||||||||||||||||||||||||||||||||||||||||||||||||||||||||||||||||||||||||||||||||||||||||||||||||||||||||||||||||||||||||||||||||||||||||||||||||||||||||||||||||||||||||||||||||||||||||||||||||||||||||||||||||||||||||||||||||||||||||||||||||||||||||||||||||||||||||||||||||||||||||||||||||||||||||||||||||||||||||||||||||||||||||||||||||||||||||||||||||||||||||||||||||||||||||||||||||||||||||||||||||||||||||||||||||||||||||||||||||||||||||||||||||||||||||||||||||||||||||||||||||||||||||||||||||||||||||||||||||||||||||||||||||||||||||||||||||||||||||||||||||||||||||||||||||||||||||||||||||||||||||||||||||||||||||||||||||||||||||||||||||||||||||||||||||||||||||||||||||||||||||||||||||||||||||||||||||||||||||||||||||||||||||||||||||||||||||||||||||||||||||||||||||||||||||||||||||||||||||||||||||||||||||||||||||||||||||||||||||||||||||||||||||||||||||||||||||||||||||||||||||||||||||||||||||||||||||||||||||||||||||||||||
|
Chapter 6 Risk and Return ppt Quiz
on Diversification Quiz on CAPM
ICE Data and Results Topic
1: Single Stock - Risk and Return Tradeoff
Given a
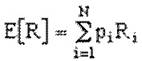
probability distribution of returns, the expected return can be calculated
using the following equation:
where
https://www.zenwealth.com/businessfinanceonline/RR/ExpectedReturn.html Given an asset's
expected return, its variance can be calculated using the following equation:
where
The standard deviation
is calculated as the positive square root of the variance.
https://www.zenwealth.com/businessfinanceonline/RR/MeasuresOfRisk.html Exercise: Stock A has the following returns for various
states of the economy:
Stock A's expected return is? Standard
deviation? Solution: · Expected return = 10%*(-30%)) + 20%*(-2%) +
40% *10% + 20%*18% + 10%*40% = 8.2% · Standard deviation (not required) = sqrt(10%*(-30%-8.2%)2 +
20%*(-2%-8.2%)2 +40%*(10%-8.2%)2 +
20%*(18%-8.2%)2 +10%*(40%-8.2%)2) = 16.98% Or, https://www.jufinance.com/return/
Drawbacks of Holding One Stock: ·
Holding
only one stock is risky due to lack of diversification. ·
All
your “eggs” are in one basket, so company-specific bad news can severely hurt
your portfolio. ·
This
concentration leads to high volatility and uncompensated risk – risk
that could be diversified away but isn’t. Topic
2: A Portfolio with Two Stocks - Risk
and Return Tradeoff Quiz Key
Insights on Two-Stock Portfolio and Diversification
1) If
two stocks have high correlation (+1),
they move together, offering little
risk reduction. 2) If
they have low correlation (~0),
they move independently, reducing
overall volatility. 3) If
they have negative correlation
(-1), one stock rises while the other falls, potentially eliminating risk.
For example: By thoughtfully selecting stocks with varying correlations
to NVIDIA, investors can construct a portfolio that balances potential
returns with reduced risk. 1. NVIDIA and Intel Corporation (INTC):
2. NVIDIA and Amazon.com Inc. (AMZN):
3. NVIDIA and Advanced Micro Devices, Inc. (AMD):
Key Takeaways:
W1 and W2 are the percentage of
each stock in the portfolio.
Exercise: Stocks A and B have the following returns for
various states of the economy:
Solution: (or use calculator at https://www.jufinance.com/return/) Stock 1: · Expected return = 10%*(-30%)) + 20%*(-2%) +
40% *10% + 20%*18% + 10%*40% = 8.2% · Standard deviation (not required) = sqrt(10%*(-30%-8.2%)2 +
20%*(-2%-8.2%)2 +40%*(10%-8.2%)2 +
20%*(18%-8.2%)2 +10%*(40%-8.2%)2) = 16.98% Stock 2: · Expected return = 10%*(10%)) + 20%*(2%) + 40%
*1% + 20%*2% + 10%*(-5)% = 1.7% · Standard deviation (not required) =
sqrt(10%*(10%-1.7%)2 + 20%*(2%-1.7%)2 +40%*(1%-1.7%)2 +
20%*(2%-1.7%)2 +10%*((-5)%-1.7%)2) = 3.41% Covariance (not required): · Covariance =
10%*(-30%-8.2%)*(10%-1.7%)+20%*(-2%-8.2%)*(2%-1.7%)+40%*(10%-8.2%)*(1%-1.7%)+20%*(18%-8.2%)*(2%-1.7%)+10%*(40%-8.2%)*((-5%)-1.7%)
= -0.54% Correlation (not required): · Correlation = -0.54%/(16.98%* 3.41%) = -0.93
Topic
3: A Portfolio with Three Stocks -
Risk and Return Tradeoff Quiz Key Insights:
1) Tech stock
(growth potential) 2) Consumer staples stock
(stable in recessions) 3) Utility stock
(defensive, steady returns) 6. Bottom Line: The third stock acts as a buffer, making the portfolio more
resilient and reducing reliance on any single stock or sector. In class Exercise 1.
Pick three stocks. Has to be the leading firm
in three different industries. We
chose Stock 1, Stock 2,
Stock 3 (Use following app to get monthly stock returns in the past
five years) https://script.google.com/macros/s/AKfycbxao_yHFToaMAs2fuEiYMfHapioFAjIukvBAFyJIOS6ccYL2WAepMMyrO8afpRjsVBA/exec) · Stock Prices Raw Data, Risk, Beta, CAPM (stock
1, Stock 2, Stock 3, S&P500 (Raw data), will be updated based
on the new stocks chosen in class (template)) 2. From finance.yahoo.com, collect stock prices
of the above firms, in the past five years Steps: · Goto finance.yahoo.com,
search for the company · Click
on “Historical prices” in the left column on the top and choose monthly stock
prices. · Change
the starting date and ending date to “1/31/2020” and “1/31/2025”,
respectively. · Download
it to Excel · Delete
all inputs, except “adj close”
– this is the closing price adjusted for dividend. · Merge
the three sets of data just downloaded 3. Evaluate the performance of each stock: · Calculate
the monthly stock returns. · Calculate
the average return · Calculate
standard deviation as a proxy for risk · Calculate
correlation among the three stocks. · Calculate
beta. But you need to download S&P500 index values in the past five years from
finance.yahoo.com. · Calculate stock returns based on CAPM. · Draw SML
· Conclusion and take away?
Conclusion:
More than 25 stocks should do the trick for diversification. Quiz Please refer to template Topic 4 - What Is the Capital Asset Pricing
Model? Quiz
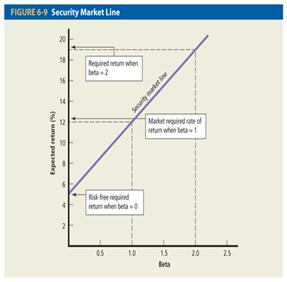
The Capital Asset Pricing Model (CAPM)
describes the relationship between systematic risk and expected
return for assets, particularly stocks. CAPM is widely used throughout
finance for pricing risky securities and generating expected
returns for assets given the risk of those assets and cost of capital. Ri = Rf + βi *
(Rm - Rf) ------ CAPM model Ri = Expected return
of investment Rf =
Risk-free rate βi =
Beta of the investment Rm =
Expected return of market (Rm -
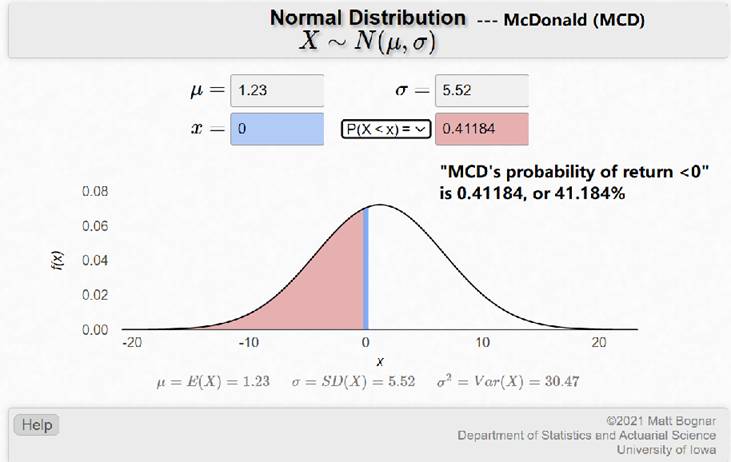
Rf) = Market risk premium Topic 5 – Normal Distribution – Predict Stock
Returns (FYI only)
Stock Price Normal Distribution (FYI) ( https://homepage.divms.uiowa.edu/~mbognar/applets/normal.html) For
example: from our in class exercise
Excel
command to get the probability to earn less than 0% for MCD: =NORM.DIST(0%,
1.23%, 5.52%, 1)
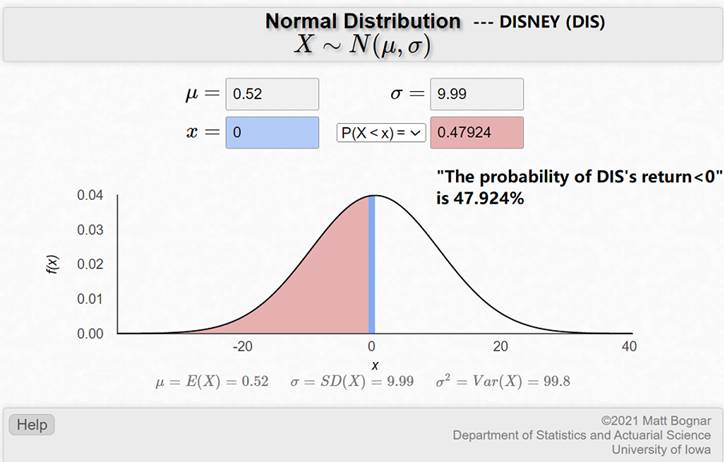
Excel
command to get the probability to earn less than 0% for DIS: =NORM.DIST(0%,
0.52%, 9.99%, 1)
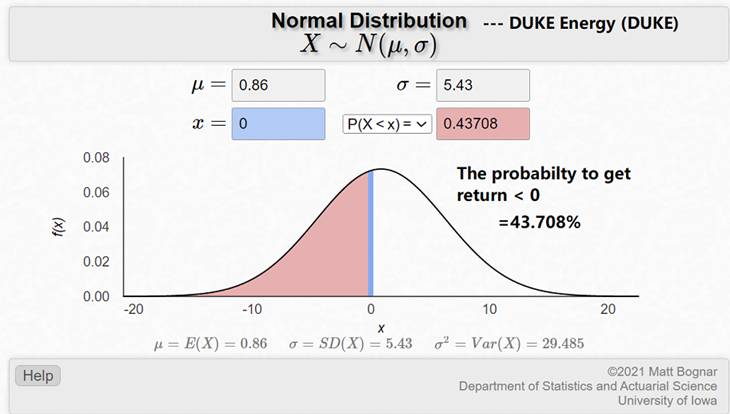
Excel
command to get the probability to earn less than 0% for DUKE: =NORM.DIST(0%,
0.86%, 5.43%, 1) Topic 6: Step-by-Step Guide for Screening Mutual
Funds (FYI)
|
|||||||||||||||||||||||||||||||||||||||||||||||||||||||||||||||||||||||||||||||||||||||||||||||||||||||||||||||||||||||||||||||||||||||||||||||||||||||||||||||||||||||||||||||||||||||||||||||||||||||||||||||||||||||||||||||||||||||||||||||||||||||||||||||||||||||||||||||||||||||||||||||||||||||||||||||||||||||||||||||||||||||||||||||||||||||||||||||||||||||||||||||||||||||||||||||||||||||||||||||||||||||||||||||||||||||||||||||||||||||||||||||||||||||||||||||||||||||||||||||||||||||||||||||||||||||||||||||||||||||||||||||||||||||||||||||||||||||||||||||||||||||||||||||||||||||||||||||||||||||||||||||||||||||||||||||||||||||||||||||||||||||||||||||||||||||||||||||||||||||||||||||||||||||||||||||||||||||||||||||||||||||||||||||||||||||||||||||||||||||||||||||||||||||||||||||||||||||||||||||||||||||||||||||||||||||||||||||||||||||||||||||||||||||||||||||||||||||||||||||||||||||||||||||||||||||||||||||||||||||||||||||||||||||||||||||||||||||||||||||||||||||||||||


|
Advice Category |
Key Insights |
|
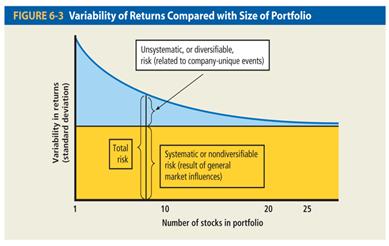
Reducing Unsystematic vs. Systematic Risk |
Adding more stocks reduces company-specific risk (unsystematic
risk), but market-wide risk (systematic risk) remains. Diversification
helps prevent the collapse of an entire portfolio due to one company's
failure. |
|
Diminishing Marginal Benefits of Diversification |
The first few added stocks provide the greatest risk
reduction. Research shows about 20 well-chosen stocks across industries
eliminate most diversifiable risk. Beyond that, the additional benefit
diminishes. |
|
Sector & Asset Allocation Diversification |
True diversification isn’t just about quantity but variety.
Stocks should be spread across different sectors (tech, healthcare, energy,
etc.) and asset classes (stocks, bonds, real estate) to improve stability. |
|
Balancing Risk and Return |
The risk-return tradeoff remains: higher returns require
higher risk. However, diversification allows investors to lower risk
without significantly reducing returns. A well-balanced portfolio smooths
out volatility while capturing market gains. |
Chapter 6 Homework (due with the second midterm exam)
Need help? Watch this guide video: Chapter 6 Homework Help
1)
Stock A has the following returns for various states of the economy:
State
of
the
Economy Probability Stock
A's Return
Recession 10% -30%
Below
Average 20% -2%
Average 40% 10%
Above
Average 20% 18%
Boom 10% 40%
Stock
A's expected return is? (ANSWER: 8.2%)
2)
Joe purchased 800 shares of Robotics Stock at $3 per share on 1/1/19. Bill
sold the shares on 12/31/19 for $3.45. Robotics stock has a beta of 1.9, the
risk-free rate of return is 4%, and the market risk premium is 9%. Joe's
holding period return is? (ANSWER:
15%)
3. You
own a portfolio with the following expected returns given the various states
of the economy. What is the overall portfolio expected return? (ANSWER:
9.05%)
State
of
economy probability
of state of
economy rate
of return if state occurs
Boom 27% 14%
Normal 70% 8%
Recession 3% -11%
4)
The prices for the Electric Circuit Corporation for the first quarter of 2019
are given below. The price of the stock on January 1, 2019 was
$130. Find the holding period return for an investor who purchased the stock
onJanuary 1, 2009 and sold it the last day of March 2019. (ANSWER: 2.12%)
Month
End Price
January $125.00
February 138.50
March 132.75
5)
Collectibles Corp. has a beta of 2.5 and a standard deviation of returns of
20%. The return on the market portfolio is 15% and the risk free rate is 4%.
What is the risk premium on the market?
(ANSWER: 11%)
6)
An investor currently holds the following portfolio:
Amount
Invested
8,000
shares of
Stock A $16,000 Beta = 1.3
15,000
shares of Stock B $48,000 Beta = 1.8
25,000
shares of Stock C $96,000 Beta = 2.2
The
beta for the portfolio is? (ANSWER:
1.99)
7)
Assume that you have $165,000 invested in a stock that is returning 11.50%,
$85,000 invested in a stock that is returning 22.75%, and $235,000 invested
in a stock that is returning 10.25%. What is the expected return of your
portfolio? (ANSWER: 13%)
8)
If you hold a portfolio made up of the following stocks:
Investment
Value Beta
Stock
A $8,000 1.5
Stock
B $10,000 1.0
Stock
C $2,000 .5
What
is the beta of the portfolio? (ANSWER:
1.15)
9. The risk-free rate of
return is 3.9 percent and the market risk premium (rm –rf)
is 6.2 percent. What is the expected rate of return on a stock with a beta of
1.21? (ANSWER: 11.4%)
10. You own a portfolio consisting of the stocks below.
Stock Percentage
of
portfolio Beta
1. 20% 1
2. 30% 0.5
3. 50% 1.6
The risk free rate is 3% and
market return is 10%.
a. Calculate
the portfolio beta. (ANSWER:
1.15)
b. Calculate
the expected return of your portfolio. (ANSWER: 11.05%)
11. Computing holding period return for Jazman and
Solomon for period 1 through 3 (bought in period 1 and sold in period 3).
Show the holding period returns for each company. (ANSWER: 50%, -25%)
Period Jazman Solomon
1 $10 $20
2 $12 $25
3 $15 $15
12. Calculate expected return
(ANSWER:
12%)
|
State of the economy |
Probability of the states |
% Return (Cash Flow/Inv. Cost) |
|
Economic Recession |
30% |
5% |
|
Strong and moderate Economic Growth |
70% |
15% |
13. Calculate the expected returns of the
following cases, respectively
1) Invest
$10,000 in Treasury bill with guaranteed return of 4%. (ANSWER: 4%)
2) Investment
$10,000 in Apple. 50% possibility to earn 20% return and 50% possibility to
lose 10% of investment.(ANSWER: 5%)
3) Investment
$10,000 in Wal-Mart. 50% possibility to earn 5% return and 50% possibility to
earn 0% of investment.(ANSWER: 2.5%)
14. Rank the risk of the following cases, from
the least risky one the most risky one
(ANSWER: 1, 3, 2)
1) Invest
$10,000 in Treasury bill with guaranteed return of 4%.
2) Investment
$10,000 in Apple. 50% possibility to earn 20% return and 50% possibility to
lose 10% of investment.
3) Investment
$10,000 in Wal-Mart. 50% possibility to earn 5% return and 50% possibility to
earn 0% of investment.
15. An
investor currently holds the following portfolio:
Amount
Invested
8,000
shares of
Stock A $10,000 Beta = 1.5
15,000
shares of Stock B $20,000 Beta = 0.8
25,000
shares of Stock C $20,000 Beta = 1.2
Calculate
the beta for the portfolio.(ANSWER:
1.1)
Excel Command:
sumproduct(array1,
array2) ---- to get expected returns
stdev(observation1,
obv2, obv3,….) ---- to get standard deviation
correl(stock
1’s return, stock 2’s return) --- to get correlation between stocks
beta
= slope(stock return, sp500 return) --- to get the stock’s beta
Holding
Period Return Calculator
Two
Stock Portfolio Return and Standard Deviation
FYI only
![]()
W1 and W2 are the percentage of each stock in the
portfolio.

![]()
- r12 = the
correlation coefficient between the returns on stocks 1 and 2,
- s12 = the
covariance between the returns on stocks 1 and 2,
- s1 = the
standard deviation on stock 1, and
- s2 = the
standard deviation on stock 2.

![]()
- s12 = the
covariance between the returns on stocks 1 and 2,
- N = the number of states,
- pi = the probability of state i,
- R1i = the return on stock 1 in state i,
- E[R1] = the expected return on stock 1,
- R2i = the return on stock 2 in state i, and
- E[R2] = the expected return on stock 2.
2022 High Beta Stocks List | The 100 Highest Beta S&P 500
Stocks (FYI)
Updated
on September 15th, 2022 by Bob Ciura
https://www.suredividend.com/high-beta-stocks/
#5: Fortinet, Inc. (FTNT)
Fortinet,
Inc. provides broad, integrated, and automated cybersecurity solutions around
the world. It offers FortiGate hardware and software licenses that provide
various security and networking functions. Fortinet is a large-cap stock with
a market cap above $40 billion.
In
the 2022 second quarter, Fortinet generated revenue of $1.03 billion, up 29%
from the same quarter last year. Product and service revenue grew 34% and
25%, respectively. Adjusted earnings-per-share increased 26% year-over-year.
For
2022, Fortinet expects revenue of $4.25 billion to $4.40 billion, consisting
of $2.62 billion to $2.67 billion in service revenue. Billings are expected
between $5.56 billion and $5.64 billion. Adjusted earnings-per-share are
expected in a range of $1.01 to $1.06 for the full year.
FTNT
has a Beta value of 1.71.
#4: Paycom Software Inc. (PAYC)
Paycom
is a technology stock that produces cloud-based human capital management
(HCM) as-a-service software. Services help employers manage a variety of HCM
tasks such as talent acquisition, and time and labor management.
In
the most recent quarter, Paycom generated $317 million in revenue, up 31%
year-over-year. Recurring revenue grew 31%, and represented 98% of total
revenue. Earnings-per-share of $1.26 increased 30% compared with $0.97 in the
year-ago quarter.
PAYC
has a Beta
value of 1.71.
#3: ServiceNow (NOW)
ServiceNow
is a high-quality technology company, which transforms old, manual ways of
working into modern digital workflows. It reduces the complexity of jobs and
makes work more pleasant to employees, thus resulting in increased
productivity.
ServiceNow
currently has more than 7,400 enterprise customers, which include about 80%
of the Fortune 500. All these customers use the Now Platform, which is an
intelligent cloud platform that carries out their digital transformation.
ServiceNow
is a leader in the digital transformation of companies towards making work
better for their employees. According to a research of IDC, more than $3
trillion has been invested in digital transformation initiatives but only 26%
of the investments have delivered acceptable returns.
NOW has
a Beta value of 1.77.
#2: Advanced Micro Devices (AMD)
Advanced
Micro Devices was founded in 1959 and in the decades since it has become a
sizable player in the chip market. AMD is heavy in gaming chips, competing
with others like NVIDIA for the lucrative, but competitive market.
In
the 2022 second quarter, AMD reported revenue of $6.6 billion. This was a 70%
year-over-year increase, driven by organic growth as well as the contribution
from Xilinx. Gross margin contracted two percentage points to 46% for the
quarter. Operating income rose 22% to $526 million. Adjusted
earnings-per-share of $1.05 increased 67%.
AMD has
a Beta value of 2.09.
#1: NVIDIA Corporation (NVDA)
NVIDIA
Corporation is a specialized semiconductor company that designs and
manufactures graphics processors, chipsets and related software products.
Its
products include processors that are specialized for gaming, design,
artificial intelligence, data science and big data research, as well as chips
designed for autonomous vehicles and robots.
Over
the last five years, NVIDIA’s growth exploded. This
growth was partially driven by cryptocurrency mining, although that has
mostly ceased to be a tailwind, and future growth will be centered on other
growth drivers. NVIDIA’s GPUs are very versatile in
AI applications, which was an unintended benefit of the company’s research and development efforts.
The
company has immediately started to capitalize on this trend by offering GPUs that
are optimized for deep learning and other specialized applications. These
GPUs act as the brains of computers, robots, and self-driving cars. Those
GPUs are, among others, utilized in professional visualization and data
centers. The markets NVIDIA supplies GPUs for have strong growth tailwinds,
which bodes well for NVIDIA’s long-term revenue
outlook.
NVDA
has a Beta value of 2.31.
Negative Beta Stocks | The 1 Negative Beta S&P 500 Stock
In 2022 (FYI)
Updated
on January 19th, 2022 by Bob Ciura
https://www.suredividend.com/negative-beta-stocks/
Negative
Beta Stock: Clorox Company (CLX)
With
over 40 years of dividend increases, Clorox is on the exclusive Dividend
Aristocrats list.
Clorox
is a manufacturer and marketer of consumer and professional products,
spanning a wide array of categories from charcoal to cleaning supplies to
salad dressing.
More
than 80% of its revenue comes from products that are #1 or #2 in their
categories across the globe, helping Clorox produce more than $7 billion in
annual revenue.
Clorox
reported first quarter earnings on November 1st, 2021, and results were
better than expected, although expectations were low.
Total
revenue declined nearly –6% year–over–year to $1.8 billion, as organic sales
fell –5% during the quarter. The decline was due to unfavorable pricing and
mix, a decline in volume, and forex translation.
Cleaning
and professional products were higher, but consumer products like vitamins
and supplements posted strong declines.
Clorox
stock has a Beta value of -0.24.
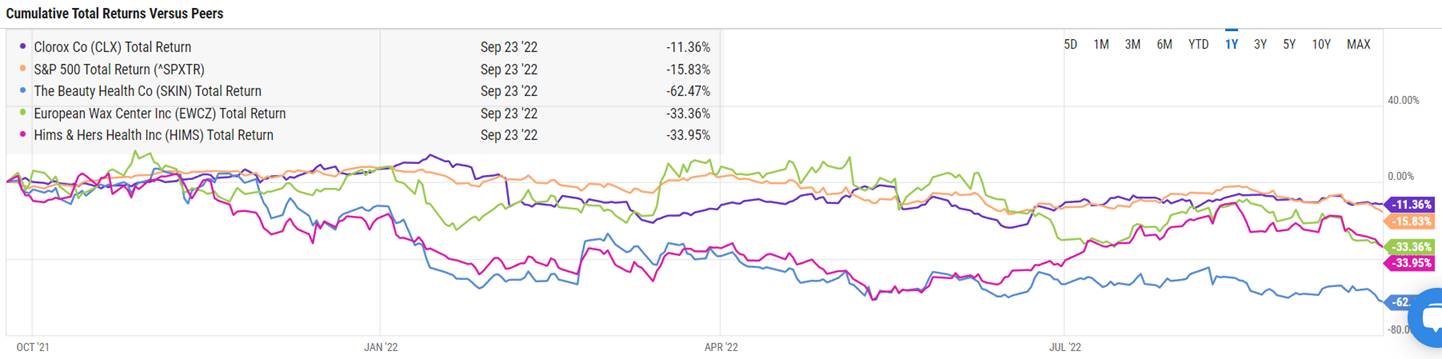
https://ycharts.com/companies/CLX/performance/price
Chapter 7 Bond pricing
·
Ppt
Yield Curve http://finra-markets.morningstar.com/BondCenter/Default.jsp 3/24/2025

https://www.gurufocus.com/yield_curve.php
Investing
Basics: Bonds(video)
FINRA
– Bond market information
https://www.finra.org/finra-data/fixed-income
Chapter 7 Study guide
1.
Go to https://www.finra.org/finra-data/fixed-income,
the bond market data website of FINRA to find bond information. For example,
find bonds sponsored by Wal-mart
Corporate
Bond
Understand what is coupon,
coupon rate, yield, yield to maturity, market price, par value, maturity,
annual bond, semi-annual bond, current yield. https://finra-markets.morningstar.com/BondCenter/


For
WALMART bond Symbol: WMT5571329CUSIP: 931142FE8 Bond Type: CORP
https://www.finra.org/finra-data/fixed-income/bond?symbol=WMT5571329&bondType=CORP

3. 3. Understand how to
price bond
Bond price = abs(pv(yield, maturity, coupon, 1000)) ------- annual coupon
Bond price = abs(pv(yield/2, maturity*2, coupon/2, 1000))
------- semi-annual coupon
Also change the yield and observe the price changes.
Summarize the price change pattern and draw a graph to demonstrate your
findings.
Again, when yield to maturity of this semi_annual coupon
bond is 3%, how should this WMT bond sell for?
4. Understand how to
calculate bond returns
Yield to maturity = rate(maturity,
coupon, -market price, 1000) – annual coupon
Yield to maturity = rate(maturity*2,
coupon/2, -market price, 1000)*2 – semi-annual coupon
For example, when the annual coupon bond is selling for
$1,200, what is its return to investors?
For example, when the semi-annual coupon bond
is selling for $1,200, what is its return to investors?
5. Current yield: For the
above bond, calculate current yield
(hint: current yield = annual
coupon / bond price)
6. Zero coupon bond:
coupon=0 and treat it as semi-annual coupon bond.
Example:
A ten year zero coupon bond is selling for $400. How much is its yield to
maturity?
A ten year zero coupon bond’s yield to maturity is 10%.
How much is its price?
7. Understand
what is bond rating and how to read those ratings. (based on z
score. What is z score?)
a. Who are Moody,
S&P and Fitch?
b. What is IBM’s
rating?
c. Is the rating
for IBM the highest?
d. Who earned the
highest rating?
8.
Understand the cash flows from a bond as a bond investor
For
example, a five year, annual coupon bond, with 5% coupon rate. Its cash flows
are as follows.

Chapter 7 Home
Work (due with the second mid-term)
Instructor Walkthrough for Chapter 7 Homework: Click to watch
1. IBM
5 year 2% annual coupon bond is selling for $950. How much
this IBM bond’s YTM? 3.09%
2. IBM
10 year 4% semi_annual coupon bond is selling for $950. How
much is this IBM bond’s YTM? 4.63%
3. IBM
10 year 5% annual coupon bond offers 8% of return. How much
is the price of this bond? 798.7
4. IBM
5 year 5% semi-annual coupon bond offers 8% of return. How
much is the price of this bond? $878.34
5. IBM
20 year zero coupon bond offers 8% return. How much is the price of this
bond? 208.29
6. Collingwood
Homes has a bond issue outstanding that pays an 8.5 percent coupon and
matures in 18.5 years. The bonds have a par value of $1,000 and a market
price of $964.20. Interest is paid semiannually. What is the yield to
maturity? 8.9%
7. Grand
Adventure Properties offers a 9.5 percent coupon bond with annual payments.
The yield to maturity is 11.2 percent and the maturity date is 11 years from
today. What is the market price of this bond if the face value is
$1,000? 895
8. The
zero coupon bonds of D&L Movers have a market price of $319.24, a face
value of $1,000, and a yield to maturity of 9.17 percent. How many years is
it until these bonds mature? 12.73 years
9. A
zero coupon bond with a face value of $1,000 is issued with an initial price
of $212.56. The bond matures in 25 years. What is the yield to
maturity? 6.29%
10.
The bonds issued by Stainless Tubs bear a 6 percent coupon, payable semiannually.
The bonds mature in 11 years and have a $1,000 face value. Currently, the
bonds sell for $989. What is the yield to maturity? 6.14%
Summary of bond pricing EXCEL functions
To calculate bond price (annual coupon bond):
Price=abs(pv(yield to maturity, years left to maturity,
coupon rate*1000, 1000)
To calculate yield to maturity (annual coupon
bond):
Yield to maturity = rate(years left to
maturity, coupon rate *1000, -price, 1000)
To calculate bond price (semi-annual
coupon bond):
Price=abs(pv(yield to maturity/2, years
left to maturity*2, coupon rate*1000/2, 1000)
To calculate yield to maturity (semi-annual
coupon bond):
Yield to maturity = rate(years left to
maturity*2, coupon rate *1000/2, -price, 1000)*2
To calculate number of years left(annual
coupon bond)
Number of years =nper(yield to
maturity, coupon rate*1000, -price, 1000)
To calculate number of years left(semi-annual
coupon bond)
Number of years =nper(yield to
maturity/2, coupon rate*1000/2, -price, 1000)/2
To calculate coupon (annual coupon bond)
Coupon = pmt(yield to maturity, number of
years left, -price, 1000)
Coupon rate = coupon / 1000
To calculate coupon (semi-annual coupon bond)
Coupon = pmt(yield to maturity/2, number of
years left*2, -price, 1000)*2
Coupon rate = coupon / 1000
Current Yield = annual coupon / bond market price
·
Current yield is the return you earn just from
the bond’s coupon payments, not including any price gain or loss (this is
capital gain yield).
·
Yield to maturity = total return =
current yield + capital gain yield
Math
Formula (FYI)

C: Coupon, M: Par, $1,000; i: Yield to maturity; n:
years left to maturity

For Semi-annual, F=2 for semi-annual coupon
M: Par, $1,000; i: Yield to maturity; n:
years left to maturity
Second Midterm
Exam (chapters 6 and 7 only)
·
Date: 4/3
·
T/F Solution (33
questions, 33*1.5=49 points, closed book close notes)
·
Multiple
Choice Solution (17 questions, 17*3=51 points)
Chapter 6 Study Guide
1.
Single Stock – Risk & Return Tradeoff
- Expected Return (E[R]): Weighted average of returns
using probabilities.
v Formula: E[R] = Σ (pi * Ri)
- Variance & Standard Deviation: Measures of total risk
(volatility).
v Std Dev = √Variance
- Higher standard deviation = more risk
- Holding one stock = High risk (lack of
diversification)
- Risk
cannot be eliminated with one stock.
2.
Two-Stock Portfolio
- Diversification: Reduces risk if stocks are not perfectly
correlated.
- Correlation (ρ):
v +1 = perfect positive (no diversification benefit)
v 0 = no relationship (moderate benefit)
v -1 = perfect negative (best risk reduction)
- Portfolio Variance depends on weights, std dev,
and correlation.
- Correlation
example: -0.93 between Stock A and B (strong diversification)
- You
can lower risk without lowering return via diversification.
3.
Three-Stock Portfolio
Key Concepts:
- More stocks = more diversification
- Correlation is key: Low/negative correlation
helps most.
- Portfolio Expected Return = Weighted average of
individual expected returns.
- Combining
3 stocks reduces risk more than 2, especially from different sectors.
- After
~20 well-chosen stocks, diversification benefit flattens.
4.
Capital Asset Pricing Model (CAPM)
Key Formula:
- Ri
= Rf + βi * (Rm - Rf)
Key Concepts:
- Beta (β): Measures stock’s volatility relative to the market.
1.
β
= 1 → same risk as market
2.
β
> 1 → more volatile
3.
β
< 1 → less volatile
- Market Risk Premium (Rm - Rf): Additional return for
market risk.
- High
beta = higher expected return under CAPM
- Risk-free
rate = return with no risk (e.g., T-bills)
- Only
systematic risk is priced
in CAPM, not company-specific risk.
5.
Portfolio Concepts
Key Concepts:
- Expected Portfolio Return = Weighted average of
individual returns
- Portfolio Beta = Weighted average of each stock's beta
- Unsystematic Risk (company-specific): Can be
diversified away
- Systematic Risk (market risk): Cannot be diversified away
- Diversification reduces unsystematic risk
only
Chapter 7 Study Guide
1. Bond Basics
Understand
these key terms:
|
Term |
Meaning |
|
Par Value |
The face
value of the bond, usually $1,000. |
|
Coupon Rate |
The % of par
paid annually/semi-annually as interest. |
|
Coupon Payment |
Actual
dollar payment (e.g., 5% of $1,000 = $50 annually). |
|
Market Price |
Current
price the bond is trading at (may be above/below par). |
|
Maturity |
The time
when bond repays principal ($1,000). |
|
Yield to Maturity (YTM) |
Investor’s
total return if held to maturity. |
|
Current Yield |
= Annual
Coupon ÷ Current Market Price. |
|
Zero Coupon Bond |
Pays no
coupon. Only pays $1,000 at maturity. |
|
Annual vs. Semiannual |
Semiannual
bonds pay 2x per year, so divide rate and double periods in formulas. |
2. Bond Price-Yield Relationship
- Inverse Relationship:
- When
YTM ↑, Bond Price ↓
- When
YTM ↓, Bond Price ↑
Key takeaway:
Rising interest rates cause bond prices to fall and vice versa.
3. Bond Pricing Formulas
- Annual
Coupon Bond:
Price = abs(pv(YTM, N, Coupon, 1000)) - Semi-Annual
Coupon Bond:
Price = abs(pv(YTM/2, N*2,
       Coupon/2, 1000))
4. Calculating Yield to
Maturity (YTM)
- YTM is
the interest rate that sets present value of cash flows = current price.
Excel/Calculator
formulas:
- Annual:
=rate(n, coupon, -price, 1000) - Semi-Annual:
=rate(n*2, coupon/2, -price,
       1000)*2
5. Current Yield
Formula:
Current Yield = Annual Coupon ÷ Market
  Price
Example:
- $50
coupon bond trading at $950 →
50 ÷ 950 = 5.26%
6. Zero-Coupon Bonds
- Coupon = 0, trades
at deep discount.
- Treated
as semi-annual for formulas.
- Only pays
$1,000 at maturity.
Chapter 8 Stock Valuation
· ppt
· Quiz
Part I Dividend payout and
Stock Valuation
Companies that have consistently increased
their dividends over the past 30 years
|
Company |
Ticker |
Sector |
Beta |
Current Quarterly Dividend |
Annual Dividend |
Years of Consecutive Increases |
Recent Increase (%) |
|
Johnson & Johnson |
JNJ |
Health Care |
0.56 |
$1.24 |
$4.96 |
62 |
4.2% (2024) |
|
Coca-Cola |
KO |
Consumer Staples |
0.59 |
$0.51 |
$2.04 |
63 |
5.2% (2025) |
|
Procter & Gamble |
PG |
Consumer Staples |
0.42 |
$1.01 |
$4.03 |
68 |
7% (2024) |
|
PepsiCo |
PEP |
Consumer Staples |
0.55 |
$1.36 |
$5.42 |
51 |
7% (2025) |
|
3M |
MMM |
Industrials |
0.95 |
$1.51 |
$6.04 |
65 |
0.7% (2024) |
|
Lowe’s |
LOW |
Consumer Discretionary |
1.09 |
$1.15 |
$4.60 |
60 |
5% (2024) |
|
Colgate-Palmolive |
CL |
Consumer Staples |
0.6 |
$0.50 |
$2.00 |
62 |
4.2% (2024) |
|
Hormel Foods |
HRL |
Consumer Staples |
0.41 |
$0.29 |
$1.16 |
59 |
2.7% (2025) |
|
Illinois Tool Works |
ITW |
Industrials |
1.12 |
$1.50 |
$6.00 |
50+ |
7% (2024) |
|
AbbVie |
ABBV |
Health Care |
0.56 |
$1.64 |
$6.56 |
10 (post spin-off) |
5.8% (2025) |
Companies with Near-Fixed Dividend Growth
|
Company |
Ticker |
Sector |
Quarterly Dividend (USD) |
Annual Dividend (USD) |
Recent Increase (%) |
Dividend Yield (%) |
Dividend History Link |
|
Microsoft |
MSFT |
Technology |
0.83 |
3.32 |
10 |
0.92 |
https://www.microsoft.com/en-us/Investor/dividendhistory.aspx |
|
Visa |
V |
Financial Services |
0.59 |
2.36 |
13 |
0.76 |
https://investor.visa.com/financial-information/stock-info/default.aspx |
|
McDonald's |
MCD |
Consumer Discretionary |
1.77 |
7.08 |
6 |
2.31 |
https://corporate.mcdonalds.com/corpmcd/investors/stock-information/dividends.html |
|
PepsiCo |
PEP |
Consumer Staples |
1.355 |
5.42 |
5 |
3.93 |
https://www.pepsico.com/investors/stock-information/dividends |
|
Waste Management |
WM |
Industrials |
0.825 |
3.3 |
10 |
1.56 |
Large-cap and well-known smaller companies that haven't
paid dividends in the past decade:
|
Company |
Ticker |
Sector |
Stock Price (USD) |
Beta |
Dividend Paid (Past 10 Years) |
Reason for Not Paying Dividends |
Buy Recommendation |
|
Amazon |
AMZN |
Consumer Discretionary |
175.26 |
1.39 |
No |
Reinvests in logistics, AWS, and growth initiatives |
Buy for long-term growth |
|
Alphabet (Google) |
GOOGL |
Communication Services |
155.2 |
1.06 |
No |
Reinvests in AI, cloud, YouTube, and search technologies |
Buy for AI/cloud exposure |
|
Meta Platforms (Facebook) |
META |
Communication Services |
488.1 |
1.21 |
No |
Focus on innovation and acquisitions; reinvests in VR, AI |
Buy cautiously; growth with volatility |
|
Tesla |
TSLA |
Consumer Discretionary |
168.38 |
2.19 |
No |
Capital goes into production, R&D, and expansion |
Buy only if comfortable with risk |
|
Berkshire Hathaway |
BRK.A / BRK.B |
Financials |
626185 |
0.92 |
No |
Prefers reinvestment; Buffett's philosophy is against
dividends |
Hold; slow but safe compounder |
|
Netflix |
NFLX |
Communication Services |
595.98 |
1.26 |
No |
Spends on original content and global expansion |
Buy for content/streaming growth |
|
Shopify |
SHOP |
Technology |
77.65 |
1.87 |
No |
Focus on reinvestment and expansion of e-commerce tools |
Buy for aggressive tech exposure |
|
Uber Technologies |
UBER |
Technology |
75.1 |
1.58 |
No |
Reinvests heavily in rideshare, freight, and autonomous tech |
Buy if bullish on mobility and AI |
|
Roku |
ROKU |
Communication Services |
63.43 |
1.83 |
No |
Spends on content deals, platform development, and growth |
Speculative buy; high risk/high reward |
|
Palantir Technologies |
PLTR |
Technology |
22.75 |
2.05 |
No |
Invests in AI, government contracts, and data platforms |
Buy for long-term AI and defense exposure |
|
Snowflake |
SNOW |
Technology |
188.9 |
0.9 |
No |
Focus on cloud data growth and scalability |
Buy cautiously; strong revenue, no profits |
|
Twilio |
TWLO |
Technology |
61.3 |
1.41 |
No |
Reinvests in developer tools and enterprise solutions |
Hold; uncertain path to profitability |
Key Insight: Dividend Growth Model (DGM), Or Gordon’s Growth Model
|
Section |
Details |
|
What Is It? |
A valuation tool that estimates a stock’s true worth
based on the idea that dividends will grow at a constant rate forever. |
|
Where Does It Come From? |
Created by Myron Gordon (1960s). Based on the Discounted
Cash Flow (DCF) concept — except it focuses only on dividends as
future cash flows. |
|
Formula (Equation) |
P0o=D1/(r−g)
(Refer to https://www.jufinance.com/dividend/,
Dividend growth model calculator) |
|
Where: |
|
|
• Po: today's stock price |
|
|
• D1=D0×(1+g) D1 is
next year’s dividend |
|
|
• r: required return |
|
|
• g: growth rate |
|
|
Used For? |
• Pricing dividend stocks |
|
• Checking if a stock is over- or under-valued |
|
|
• Estimating expected return if you know current price |
|
|
Works Best For... |
• Mature companies |
|
• Steady profits and consistent dividend growth |
|
|
• Big names like Coca-Cola, P&G, J&J, Pepsi |
|
|
Real-World Examples |
Coca-Cola (KO): pays rising dividend yearly since 1963 |
|
Microsoft (MSFT): 10% dividend increase in 2024 |
|
|
PepsiCo (PEP): 51+ years of dividend increases |
|
|
Limitations / Weaknesses |
Needs constant growth g - not realistic for every firm |
|
Very sensitive to inputs - small error in r or g gives wild
valuation |
|
|
Doesn’t work for growth companies (e.g., Amazon, Tesla) |
|
|
Assumes company lives forever paying dividends |
|
|
Common Misunderstandings |
• You can’t use it if the company doesn’t pay dividends |
|
• Don’t assume growth rate = GDP or inflation — use actual dividend
history |
|
|
Extensions & Variations |
• Two-stage model: fast growth now, slower growth later |
|
• Multi-stage DDM: for complex growth paths |
|
|
• Compare to Discounted Cash Flow (DCF) for companies
without dividends |
If the company doesn’t
pay dividends, use other valuation methods:
|
Model |
Good
For |
|
Discounted
Cash Flow (DCF) |
Growth
companies with reinvested profits |
|
Price/Earnings
Ratio (P/E) |
Companies
with positive earnings, no dividends |
|
EV/EBITDA |
For
comparing firms in the same industry |
|
Price/Sales |
For
early-stage or fast-growing tech companies |
Class
Exercise: Estimate JNJ’s Stock Price Using the Dividend Growth Model
Objective:
Use the Dividend Growth Model (DGM) to estimate the
intrinsic value of Johnson
& Johnson (JNJ) stock, then compare it to the actual market price.
Step-by-Step Instructions:
1. Gather These Inputs
From Public Sources
(Yahoo Finance, etc.):
- Current Dividend per Share (D₀) =
$4.76 (2023 full-year dividend)
- Dividend Growth Rate (g) = 4.2% (recent annual increase)
- Beta (β) = 0.56
Use These Fixed
Assumptions:
- Risk-Free Rate (Rf) = 4.2% (10-year Treasury yield, as
of 2025)
- Market Return (Rm) = 10.0% (long-run market average)
2. Calculate the Required Rate of Return (r)
Use the CAPM formula:
Expected
Return of stock i = Rf + Beta * (Rm – Rf)
Where:
•
Rf: Risk free rate
•
Rm: Market return proxied by S&P500 index returns
- Look
up the real stock price of
JNJ (e.g., on Yahoo Finance or Google).
- Compare your DGM estimate with the market price.
- The
student with the closest estimate can win a prize or bonus
point!
Optional Challenge Questions:
- What
would happen if the dividend growth rate increased?
- What
if the beta were higher - would the stock seem more or less expensive?
- Why
might your estimate differ from the market?
Part II: Constant Dividend Growth-Dividend growth model
Calculate stock prices
1) Given
next dividends and price
Po= ![]()
Po= ![]() +
+![]()
Po= ![]() +
+![]() +
+![]()
Po= ![]() +
+![]() +
+![]() +
+![]()
……

Refer
to http://www.calculatinginvestor.com/2011/05/18/gordon-growth-model/
· Now
let’s apply this Dividend growth model in problem solving.
Constant
dividend growth model calculator ( www.jufinance.com/dividend)
Equations
· Po=
D1/(r-g) or Po= Do*(1+g)/(r-g)
· r =
D1/Po+g = Do*(1+g)/Po+g
· g=
r-D1/Po = r- Do*(1+g)/Po
·
D1
= Po *(r-g); D0 = Po*(r-g)/(1+g)
· Capital
Gain yield = g
· Dividend
Yield = r – g = D1 / Po = Do*(1+g) / Po
· D1=Do*(1+g);
D2= D1*(1+g); D3=D2*(1+g)…
HW of chapter
8 (due with final)
1. Northern Gas recently paid a $2.80 annual dividend on
its common stock. This dividend increases at an average rate of 3.8 percent
per year. The stock is currently selling for $26.91 a share. What is the
market rate of return? (answer:
14.6%)
2. Douglass Gardens pays an annual dividend that is
expected to increase by 4.1 percent per year. The stock commands a market
rate of return of 12.6 percent and sells for $24.90 a share. What is the
expected amount of the next dividend? (answer:
2.12)
3. IBM just paid $3.00 dividend per share to investors.
The dividend growth rate is 10%. What is the expected dividend of the next
year? (answer: 3.3)
4.
You bought 1
share of HPD for $20 in May 2018 and sold it for $30 in May 2019. How much is
the holding period return? (answer:
50%)
5. The current market price of stock is $50 and the
stock is expected to pay dividend of $2 with a growth rate of 6%. How much is
the expected return to stockholders? (answer:
10%)
6. The stockholder’s expected return is 8% and the
stock is expected to pay dividend of $2 with a growth rate of 4%. How much
should the stock be traded for? (answer:
50)
7. The stockholder’s expected return is 8% and the
stock is expected to pay dividend of $2 with a growth rate of 4%. How much is the dividend expected to be
three years from now? (Hint: D3 = D2*(1+g) = D1*(1+g)2
)(answer: 2.16)
8.
Kilsheimer
Company just paid a dividend of $5 per share. Future dividends are expected
to grow at a constant rate of 7% per year. The value of the stock is $42.80.
What is the required return of this stock?(answer: 19.5%)
9.
Investors of Creamy
Custard common stock earns 15% of return. It just paid a dividend of $6.00
and dividends are expected to grow at a rate of 6% indefinitely. What is
expected price of Creamy Custard's stock?(answer: 70.67)
10.
Douglass
Gardens pays an annual dividend that is expected to increase by 6 percent per
year. The stock commands a market rate of return of 12.6 percent and sells
for $24.90 a share. What is the dividend yield of this stock? (answer: 6.6%)
Dividend growth model Calculator
(very
useful)
Useful website
money.msn.com/investing
zacks.com
minyanville.com
moneychimp.com
navellier.investor.com/portfolio-grader/
nasdaq.com
marketwatch.com
superstockscreener.com
gurufocus.com
portfoliomoney.com
stockconsultant.com
marketgrader.com
moderngraham.com
stockpickr.com
stockta.com
thestreet.com
askstockguru.com
quotes.wsj.com
oldschoolvalue.com
fool.com
analystratings.com
barchart.com
stock2own.com
theonlineinvestor.com
seekingalpha.com
Details about how to derive the model mathematically (FYI)
The Gordon growth model is a simple discounted cash flow (DCF)
model which can be used to value a stock, mutual fund, or even the entire
stock market. The model is named after Myron Gordon who first published
the model in 1959.
The Gordon model assumes that a
financial security pays a periodic dividend (D) which
grows at a constant rate (g). These growing dividend payments are
assumed to continue forever. The future dividend payments are discounted at
the required rate of return (r) to find the price (P) for the stock
or fund.
Under these simple assumptions, the
price of the security is given by this equation:
![]()
In this equation, I’ve used
the “0” subscript on the price (P) and the “1” subscript
on the dividend (D) to indicate that the price is calculated at time zero and
the dividend is the expected dividend at the end of period one. However, the
equation is commonly written with these subscripts omitted.
Obviously, the assumptions built
into this model are overly simplistic for many real-world valuation
problems. Many companies pay no dividends, and, for those that do,
we may expect changing payout ratios or growth rates as the
business matures.
Despite these
limitations, I believe spending some time experimenting with the Gordon
model can help develop intuition about the relationship between
valuation and return.
Deriving the Gordon
Growth Model Equation
The Gordon growth model calculates the
present value of the security by summing an infinite series of discounted
dividend payments which follows the pattern shown here:
![]()
Multiplying both sides of the previous
equation by (1+g)/(1+r) gives:
![]()
We can then subtract the second equation
from the first equation to get:
![]()
Rearranging and simplifying:
![]()
![]()
Finally, we can simplify further to get
the Gordon growth model equation
dividend growth model:
Refer
to http://www.calculatinginvestor.com/2011/05/18/gordon-growth-model/
· Now let’s apply this
Dividend growth model in problem solving.
Chapter 10 Capital Budgeting
§ Ppt
§ Self-produced video: Exploring
Capital Budgeting Key Concepts and Strategies
§
Interactive
Game: https://www.jufinance.com/game/capital_budgeting_simple_game.html
§
Quiz on NPV, IRR, and Payback Period
§ NPV,
IRR, Payback Calculator
§ http://www.jufinance.com/capital/
§ NPV,
IRR, Payback Excel Template
§ http://www.jufinance.com/npv_1/
Chapter 10 In Class Exercise
Question 1: Project with an
initial cash outlay of $20,000 with following free cash flows for 5 years.
Year Cash
flows
1 $8,000
2 4,000
3 3,000
4 5,000
5 10,000
1) How
much is the payback period (approach one)?
· Does
this method consider time value of money?
· Easy
to explain to outsiders?
2) If
the firm has a 10% required rate of return. How much is NPV (approach
2)?
· What
does NPV means? NPV>0 indicates what? Otherwise?
· Does
this method consider time value of money?
· Easy
to explain to outsiders?
3) If
the firm has a 10% required rate of return. How much is IRR (approach
3)?
· What
does IRR mean? IRR > 10% indicates what? Otherwise?
· Does
this method consider time value of money?
· Easy
to explain to outsiders?
Question 2: Project with an initial cash
outlay of $60,000 with following free cash flows for 5 years.
Year FCF
Initial
outlay –60,000
1 25,000
2 24,000
3 13,000
4 12,000
5 11,000
The firm has a 15% required
rate of return.
Calculate payback period,
NPV, IRR. Analyze your results.
Question 3: Mutually
Exclusive Projects
1) Consider
the following cash flows for one-year Project A and B, with required rates of
return of 10%. You have limited capital and can invest in one but one
project. Which one?
§ Initial Outlay: A = $200; B =
$1,500
§ Inflow: A
= $300; B = $1,900
2) Example:
Consider two projects, A and B, with initial outlay of $1,000, cost of
capital of 10%, and following cash flows in years 1, 2, and 3:
A:
$100 $200 $2,000
B:
$650 $650 $650
Which project should you
choose if they are mutually exclusive? Independent? Crossover rate?
Question 4:
|
Period |
Project A |
Project B |
|
0 |
-500 |
-400 |
|
1 |
325 |
325 |
|
2 |
325 |
200 |
|
IRR |
||
|
NPV |
If
the required rate of return is 10%. Which project shall you choose?
1) How much
is the cross over rate? (answer: 11.8%)
2) How is
your decision if the required rate of return is 13%? (answer: NPV of
B>NPV of A)
· Rule for mutually exclusive projects: (answer:
Choose B)
· What about the two projects are
independent? (answer: Choose both)
Solution:
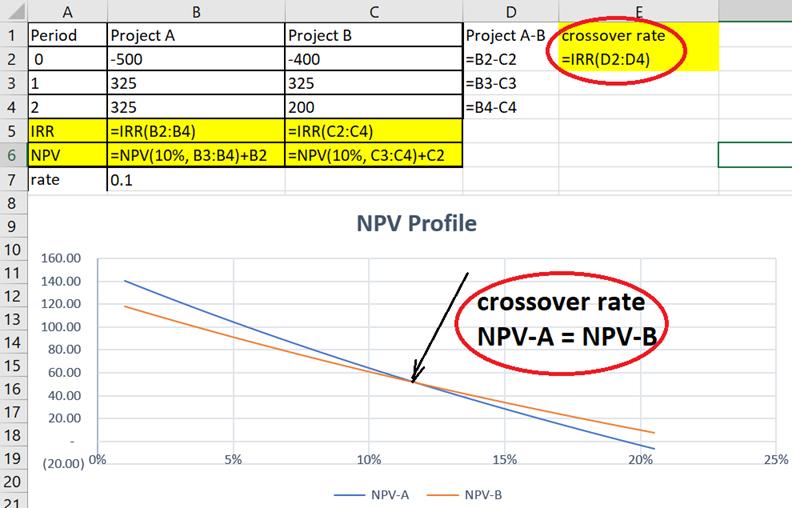
Chapter 10 Homework (due with final)
Video for
homework in class (4/14/2023)
1. Consider
the following two projects, calculate the NPVs of the two projects. If the
two projects are mutually exclusive, which one should you choose? What about
they are independent projects?(answer: NPVa: -8.67; NPVb: 12.65; Mutually
exclusive: B; Independent:B)
|
Project |
Year 0 Cash Flow |
Year 1 Cash Flow |
Year 2 Cash Flow |
Year 3 Cash Flow |
Year 4 Cash Flow |
Discount Rate |
|
A |
-100 |
40 |
40 |
40 |
N/A |
.15 |
|
B |
-73 |
30 |
30 |
30 |
30 |
.15 |
2. You are considering an investment
with the following cash flows. If the required rate of return for this
investment is 15.5 percent, should you accept the investment based solely on
the internal rate of return rule? Why? (answer: 17.53%; Yes,
rate<IRR, accept)
3. It will cost $6,000 to acquire an ice cream cart. Cart
sales are expected to be $3,600 a year for three years. After the three
years, the cart is expected to be worthless as the expected life of the
refrigeration unit is only three years. What is the payback period? (answer:
1.67)
4. An investment project provides
cash flows of $1,190 per year for 10 years. If the initial cost is $8,000,
what is the payback period? (answer: 6.72)
5. A firm evaluates all of its projects
by using the NPV decision rule. At a required return of 14 percent, the NPV
for the following project is _____ and the firm should _____ the project. (answer:
7264.95, accept)
6. Consider the following two mutually exclusive
projects. Use 10% for required rate of return.
|
Year |
Cash flow (A) |
Cash Flow (B) |
|
0 |
(10,110) |
(10,110) |
|
1 |
5,373 |
4,443 |
|
2 |
3,373 |
3,543 |
|
3 |
4,473 |
5,343 |
What is the NPV of each project? What is
the IRR of each project? (answer: A- 922.78; 15.33%; B- 871.47;
14.68%)
What is the crossover rate for these two projects? (answer:
6.29%)
7. Cash Flow in Period
Initial
Outlay 1 2 3 4
$4,000,000 $1,546,170 $1,546,170 $1,546,170 $1,546,170
The Internal Rate of Return (to nearest
whole percent) i? (answer: 20.03%)
Welltran Corp. can purchase a new
machine for $1,875,000 that will provide an annual net cash flow of $650,000
per year for five years. The machine will be sold for $120,000 after taxes at
the end of year five. What is the net present value of the machine if the
required rate of return is 13.5%. (Answer: $447,291.91. Hint: year 5’s
cash flow is 650k+120k = 770k)
Math
Equation
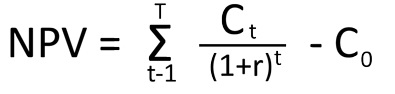
Here’s
what each symbol means:
- Ct = net cash inflow for
the period
- CO = initial investment
- r =
discount rate
- t =
number of periods
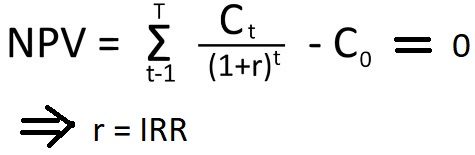
NPV
Excel syntax
Syntax
NPV(rate,value1,value2,
...)
Rate
is the rate of discount over the length of one period.
Value1, value2,
...
are 1 to 29 arguments representing the payments and income.
· Value1, value2,
... must be equally spaced in time and occur at the end of
each period. NPV uses the order of
value1, value2, ... to interpret the order of cash flows. Be sure
to enter your payment and income values in the correct sequence.
IRR Excel syntax
Syntax
IRR(values,
guess)
Values is an
array or a reference to cells that contain numbers for which you want to
calculate the internal rate of return.
Guess
is a number that you guess is close to the result of IRR.

Net Present Value NPV Explained with
NPV Example for NPV Calculation (Cartoon,
video)
http://www.youtube.com/watch?v=7FsGpi_W9XI
Using Excel for Net Present
Values, IRR's and MIRR's
https://www.youtube.com/watch?v=YgVQvn51noc
‘Simple Rules’ for
Running a Business
From the 20-page cellphone contract to the five-pound employee
handbook, even the simple things seem to be getting more complicated.
Companies have been complicating things for themselves,
too—analyzing hundreds of factors when making decisions, or consulting reams
of data to resolve every budget dilemma. But those requirements might be
wasting time and muddling priorities.
So argues Donald Sull,
a lecturer at the Sloan School of Management at the Massachusetts Institute
of Technology who has also worked for McKinsey & Co. and Clayton, Dubilier & Rice LLC. In the book Simple
Rules: How to Thrive in a Complex World, out this week from Houghton Mifflin
Harcourt HMHC -1.36%,
he and Kathleen Eisenhardt of Stanford University claim that
straightforward guidelines lead to better results than complex formulas.
Mr. Sull recently spoke with At Work about
what companies can do to simplify, and why five basic rules can beat a
50-item checklist. Edited excerpts:
WSJ: Where, in the business context, might “simple rules” help more than a complicated
approach?
Donald Sull: Well, a common decision
that people face in organizations is capital allocation. In many
organizations, there will be thick procedure books or algorithms–one company
I worked with had an algorithm that had almost 100 variables for every
project. These are very cumbersome approaches to making decisions and can
waste time. Basically, any decision about how to focus resources—either
people or money or attention—can benefit from simple rules.
WSJ: Can you give an example of how that simplification works in a
company?
Sull: There’s a German company called Weima GmBH that makes shredders. At one point,
they were getting about 10,000 requests and could only fill about a thousand
because of technical capabilities, so they had this massive problem of
sorting out which of these proposals to pursue.
They had a very detailed checklist with 40 or 50 items. People
had to gather data and if there were gray areas the proposal would go to
management. But because the data was hard to obtain and there were so many
different pieces, people didn’t
always fill out the checklists completely. Then management had to discuss a
lot of these proposals personally because there was incomplete data. So top
management is spending a disproportionate amount of time discussing this
low-level stuff.
Then Weima came up with guidelines that the
frontline sales force and engineers could use to quickly decide whether a
request fell in the “yes,” “no” or “maybe” category. They did it with five
rules only, stuff like “Weima had to collect at least 70% of the
price before the unit leaves the factory.”
Or, take Frontier Dental Laboratories in Canada. They were
working with a sales force of two covering the entire North American market.
Limiting their sales guidelines to a few factors that made someone likely to
be receptive to Frontier—stuff like “dentists
who have their own practice” and “dentists with a website”—helped
focus their efforts and increase sales 42% in a declining market.
WSJ: Weima used five factors—is that the
optimal number? And how do you choose which rules to follow?
Sull: You should have four to six rules. Any more than that, you’ll spend too much time trying to follow
everything perfectly. The entire reason simple rules help is because they
force you to prioritize the goals that matter. They’re easy to remember, they
don’t confuse or stress you, they save time.
They should be tailored to your specific goals, so you choose
the rules based on what exactly you’re trying to achieve. And you should of
course talk to others. Get information from different sources, and ask them
for the top things that worked for them. But focus on whether what will work
for you and your circumstances.
WSJ: Is there a business leader you can point to who has embraced
the “simple rules” guideline?
Donald Sull: Let’s look at
when Alex Behring took over the Brazilian railway and logistics company.
With a budget of $15 million, how do you choose among $200 million of
investment requests, all of which are valid?
The textbook business-school answer to this is that you run the
NPV (net present value) test on each project and rank-order them by NPV. Alex
Behring knows this. He was at the top of the class at Harvard Business School.
But instead, he decided what the most important
goals were. You can’t achieve everything at once. In their case, their
priorities were removing bottlenecks on growing revenues and minimizing
upfront expenditure. So when allocating money, they had a bias for projects
that both addressed the bottleneck problem and, for example, used existing
tracks and trains.
Similarly, the global-health arm of the Gates Foundation gets
many, many funding requests. But since they know that their goal is to have
the most impact worldwide, they focus on projects in developing countries
because that’s where the money will stretch farther.
Chapter 9 – WACC (Weighted
Average Cost of Capital)
Self produced video on WACC:
WACC Explained:
How Companies Balance Cost, Risk & Growth
WACC Learning Game:
§ https://www.jufinance.com/game/wacc_explanation.html
WACC Calculator:
§ Annual
Coupon Bond:
https://www.jufinance.com/wacc/
§ Semi-annual
coupon bond:
https://www.jufinance.com/wacc_1/
WACC = weight of debt *
cost of debt + weight of equity *( cost of equity)
Wd= total debt / Total capital =
total borrowed / total capital
We= total equity/ Total capital
Cost of debt = rate(nper,
coupon, -(price – flotation costs), 1000)*(1-tax rate)
Cost of Equity = D1/(Po –
Flotation Cost) + g
D1: Next period dividend; Po: Current stock price; g: dividend
growth rate
Note: flotation costs = flotation percentage *
price
Or if beta is given, use CAPM model (refer to
chapter 6)
Cost
of equity = risk free rate + beta *(market return – risk free rate)
Cost of equity = risk free rate + beta *
market risk premium
In Class Exercise
IBM financed 10m via debt coupon 5%, 10 year, price is $950 and
flotation is 7% of the price, tax 40%.
IBM financed 20m via equity. D1=$5. Po=50, g
is 5%. Flotation cost =0. So WACC?
Solution:
· Wd=1/3. We=2/3.
· Kd = rate(10,
5%*1000, -(950-950*7%), 1000)*(1-40%) = 3.98%
· Ke = 5/(50 – 0)
+ 5% =15%
· WACC = Wd*Kd
+We*Ke = 11 %
Wal-Mart
Inc (NYSE:WMT) WACC %: 8.08% As of 4/14/2025
As of today (2025-4-14), Walmart's weighted
average cost of capital is 8.08%. Walmart's ROIC % is 12.04% (calculated
using TTM income statement data). Walmart generates higher returns on
investment than it costs the company to raise the capital needed for that
investment. It is earning excess returns. A firm that expects to continue
generating positive excess returns on new investments in the future will see
its value increase as growth increases.https://www.gurufocus.com/term/wacc/WMT/WACC/Walmart%2BInc
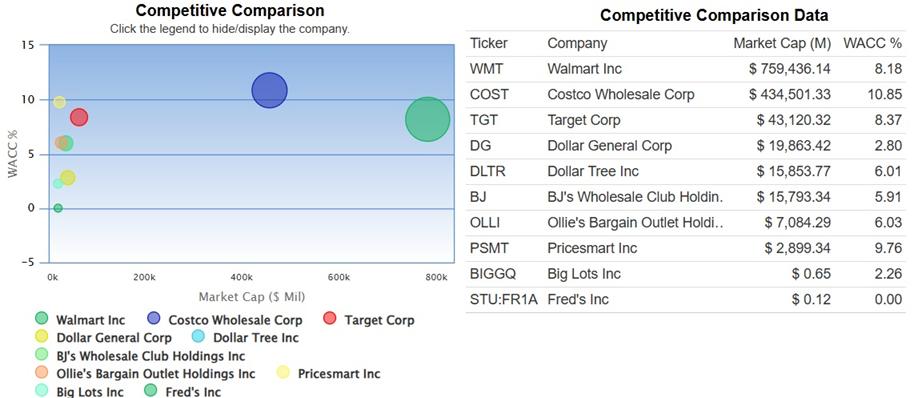
Amazon.com Inc (NAS:AMZN) WACC
%:10.98% As of 4/14/2025
As of today (2025-4-14),
Amazon.com's weighted average cost of capital is 12.51%. Amazon.com's ROIC % is 14.82% (calculated
using TTM income statement data). Amazon.com generates higher returns on
investment than it costs the company to raise the capital needed for that
investment. It is earning excess returns. A firm that expects to continue
generating positive excess returns on new investments in the future will see
its value increase as growth increases.
https://www.gurufocus.com/term/wacc/AMZN/WACC-Percentage/Amazon.com%20Inc

Apple Inc (NAS:AAPL) WACC
%:11.03% As of 4/14/2025
As of today (2025-4-14), Apple's weighted
average cost of capital is 11.09%. Apple's ROIC % is 33.16% (calculated
using TTM income statement data). Apple generates higher returns on
investment than it costs the company to raise the capital needed for that
investment. It is earning excess returns. A firm that expects to continue
generating positive excess returns on new investments in the future will see
its value increase as growth increases. https://www.gurufocus.com/term/wacc/AAPL/WACC/Apple%2Binc
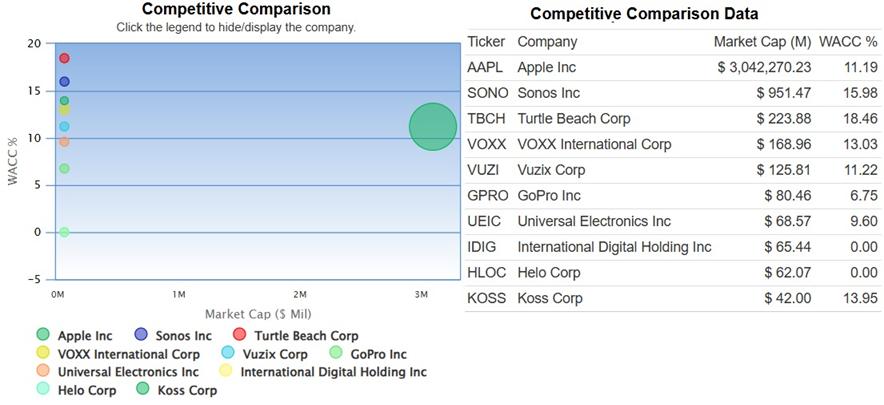

Final Exam (5/1, 11:30-2PM, #288) & Term
Project Due
Study
Guide
Part I:
True/False Concepts (1 point each — 50 total, closed book closed notes)
Core Topics Covered:
- Time
Value of Money (chapter 5)
- Financial
Statement Analysis (chapters 3 and 4)
- Risk
and Return (chapter 6)
- Bonds
& Valuation (chapter 7)
- Stock
Valuation (chapter 8)
- Capital
Budgeting (NPV, IRR, Payback) (chapter 10)
- Cost
of Capital (chapter 9)
Sample T/F Conceptual Prep Questions (similar
to the questions on the first and the second midterm exam)
- A
bond's price and interest rates are inversely related. ✅
- A
stock with a beta of 1.5 is less risky than the market portfolio. ❌
- The
internal rate of return (IRR) is the discount rate that sets NPV = 0. ✅
- When
calculating WACC, the cost of equity is irrelevant. ❌
- NPV
always gives the correct decision when choosing among mutually exclusive
projects. ✅
- According
to the CAPM, only systematic risk is priced. ✅
- If
IRP holds, there is no arbitrage opportunity in currency forward
markets. ✅
- The
payback rule considers the time value of money. ❌
- Preferred
stock dividends are tax-deductible to corporations. ❌
- The
dividend payout ratio equals dividends divided by earnings. ✅
…
Part
II: Calculation-Based Questions (2 points each — 25 total, similar to
questions on the first and the second midterm exam)
Topics
& Examples
- Bond Valuation (chapter 7)
Calculate the price of a 10-year bond with 6% coupon (semiannual), face value $1,000, market rate 8%. - Stock Valuation (Gordon Growth Model)
(chapter 8)
Find the price of a stock with D₁ = $2.00, g = 4%, and required return = 10%. - NPV / IRR / Payback period (chapter
10)
Evaluate a project with cash flows and initial investment. Discount at 9%. - CAPM (chapter 6)
Find expected return: R_f = 3%, Market = 9%, Beta = 1.2 - Beta from Portfolio Data (chapter 6)
Given returns, risk-free rate, and market return, back-solve beta. - Cash flow statement, balance sheet and
income statement (chapters 3 an 4)
Happy Summer!
